


Yesterday we laid out the rimland strategy. Interdict the ships, sell the crude in dollars, bring China into the conversation by controlling the water their energy flows through. The Abraham Accords pipeline as rimland coalition infrastructure built in pipe and steel.
Whether or not it’s working is up in the air. Crude is up 40% since the strait closed, but down ~5% since Trump’s blockade was announced. In response Iran threatened to close Bab el-Mandeb alongside Hormuz. Both chokepoints now at risk. VLCCs too large for Suez to carry oil at full weight. And yet, rumours that Iran was willing to bench on uranium enrichment, the key issue blocking any medium term solution. Stocks rallied. The market has priced the first order impact on energy and growth, whether or not appropriately, the assets move with the headlines.
What the market has not priced in is the second node in the chain. Or the third.
This article is about those nodes.
There’s this joke I post on Twitter every now and then, when one of my deep out-of-the-money calls hits.
“My hyperstitions usually take 6-18 months.”
Hyperstition being one of those SF/AI-speak words for NYC/Soros’s reflexivity. A prediction which becomes more true in the act of making it. The idea that making a call publicly sometimes influences the outcome. Markets work this way directly. You lift an offer, the price moves, other people react. Classic examples being Soros breaking the Bank of England or the market ganging up on LTCM.
I’m bringing this up because when I look at my best trades/hyperstitions, they come in two forms. The first is fast synthesis under pressure. Over the past few weeks there have been moments where a speech or news item hit the tape and I made 20-50bps by synthesizing quicker than the market. Trump’s speech where he opened with the length of WWI and Vietnam and then said “32 days”, he wasn’t about to say “and I’m OUT.” That kind of punting is real but it’s not scalable. You end up hitting 2/3rds, but the opportunities come almost at random, and you have to be glued to the screens to capture them. Plus, there are only so many Druckenmillers, and markets are more efficient than in his day so it’s hard work and not something you are going to retire on.
It also didn’t quite cover my theta bill, which is growing.
The second form is the one I hang my hat on. Looking at a chaotic, ambiguous system and identifying what idea or event is just outside the Overton window and about to come into frame. Which then results in a radical repricing. Gold in China from 2018. Silver from 2023. AI infrastructure from 2023. Rare earths in ‘24. All of them looked picked over or fundamentally unpopular when we started building positions. All of them took 6-18 months to reprice.
The cascade trade is this second form. The damage is locking in now, on biological and chemical timelines the market doesn’t track. The repricing comes later. The longer the heart attack in Hormuz lasts, the greater the repricing.
Quick update on the book before we get to the meat.
Credit short has been a waste of premium. We had an opportunity to capture gamma when it dipped below our strike, but late on the trigger meant we missed the move before headlines ripped through the top strike (I really need a trader to run all this stuff while I’m in meetings and traveling but again, no crying in the casino Campbell).
Lesson learned: when you’re trading credit via puts on actual bonds (HYG), your duration hedge gets messy. As the corporate bonds fall through your first strike, you pick up a lot of delta (which also means duration), and then if the risk-free rate compresses on growth fears your puts lose even if spreads are unchanged. I rolled the short exposure into May SPX put spreads, 1.5-4% out of the money. CDS remain the right instrument for this leg. We’ll get there, someday. Even if it means building an ISDA scale book brick by brick with newsletter subs (kidding).
VIX calls from Friday worked, for a little while and ended down on the day . I bought them expecting the fragile peace to break. What I didn’t expect was Trump taking my advice and counter-escalating to a full naval blockade so effectively that Iran came back to the table and began caving on enrichment. To me this is a real line in the sand that I am looking for to shift my peace balance. It’s also why stocks are rallying into what could be a radical escalation. I took off around 1% of crude call spreads after the news, down 15% from the daily highs, but still up on the trade.
Couple surprises in one day and the book still had a fine session, mostly bailed out by the rates and equity book (long AI equities, critical minerals, and energy exporters). The US equity market is either a monster or entirely delusional. Probably both.
Gold is trading terribly. Correlated with stocks, underperforming on the squeeze. Heavy. The Turkey/Middle East deleveraging from last month is still spooking people. But longer term, if Iran is demanding toll payments in yuan and crypto, this has to be constructive for gold. I’m getting more bullish, not less. Slowly moving out of delta one and into long-dated call spreads and flies. If we do get peace here, I’ll probably stick 5% of the book in long-dated broken butterflies and just stop watching it. IF you have friends looking to launch a gold-backed stablecoin, I’m in.
Which brings us to our ‘cascade positions’: our calls are underwater, down about 1% combined across a set of strikes and contracts. We’re early. And we added winter wheat futures after doing a ton of vol work which convinced me to puke the vol and just buy delta. Seems to use the wheat wheat market is looking at a chart that includes actual supply destruction from Ukraine in 2022 and pricing implied vol /skew way too high relative to what the current setup justifies. More on this below (maybe more than you want).
In terms of the outlook.
We continue to stand at the edge of war and peace. Today brought moves that suggest we may actually be close to some sort of resolution. We still want a portfolio that is balanced to both outcomes.
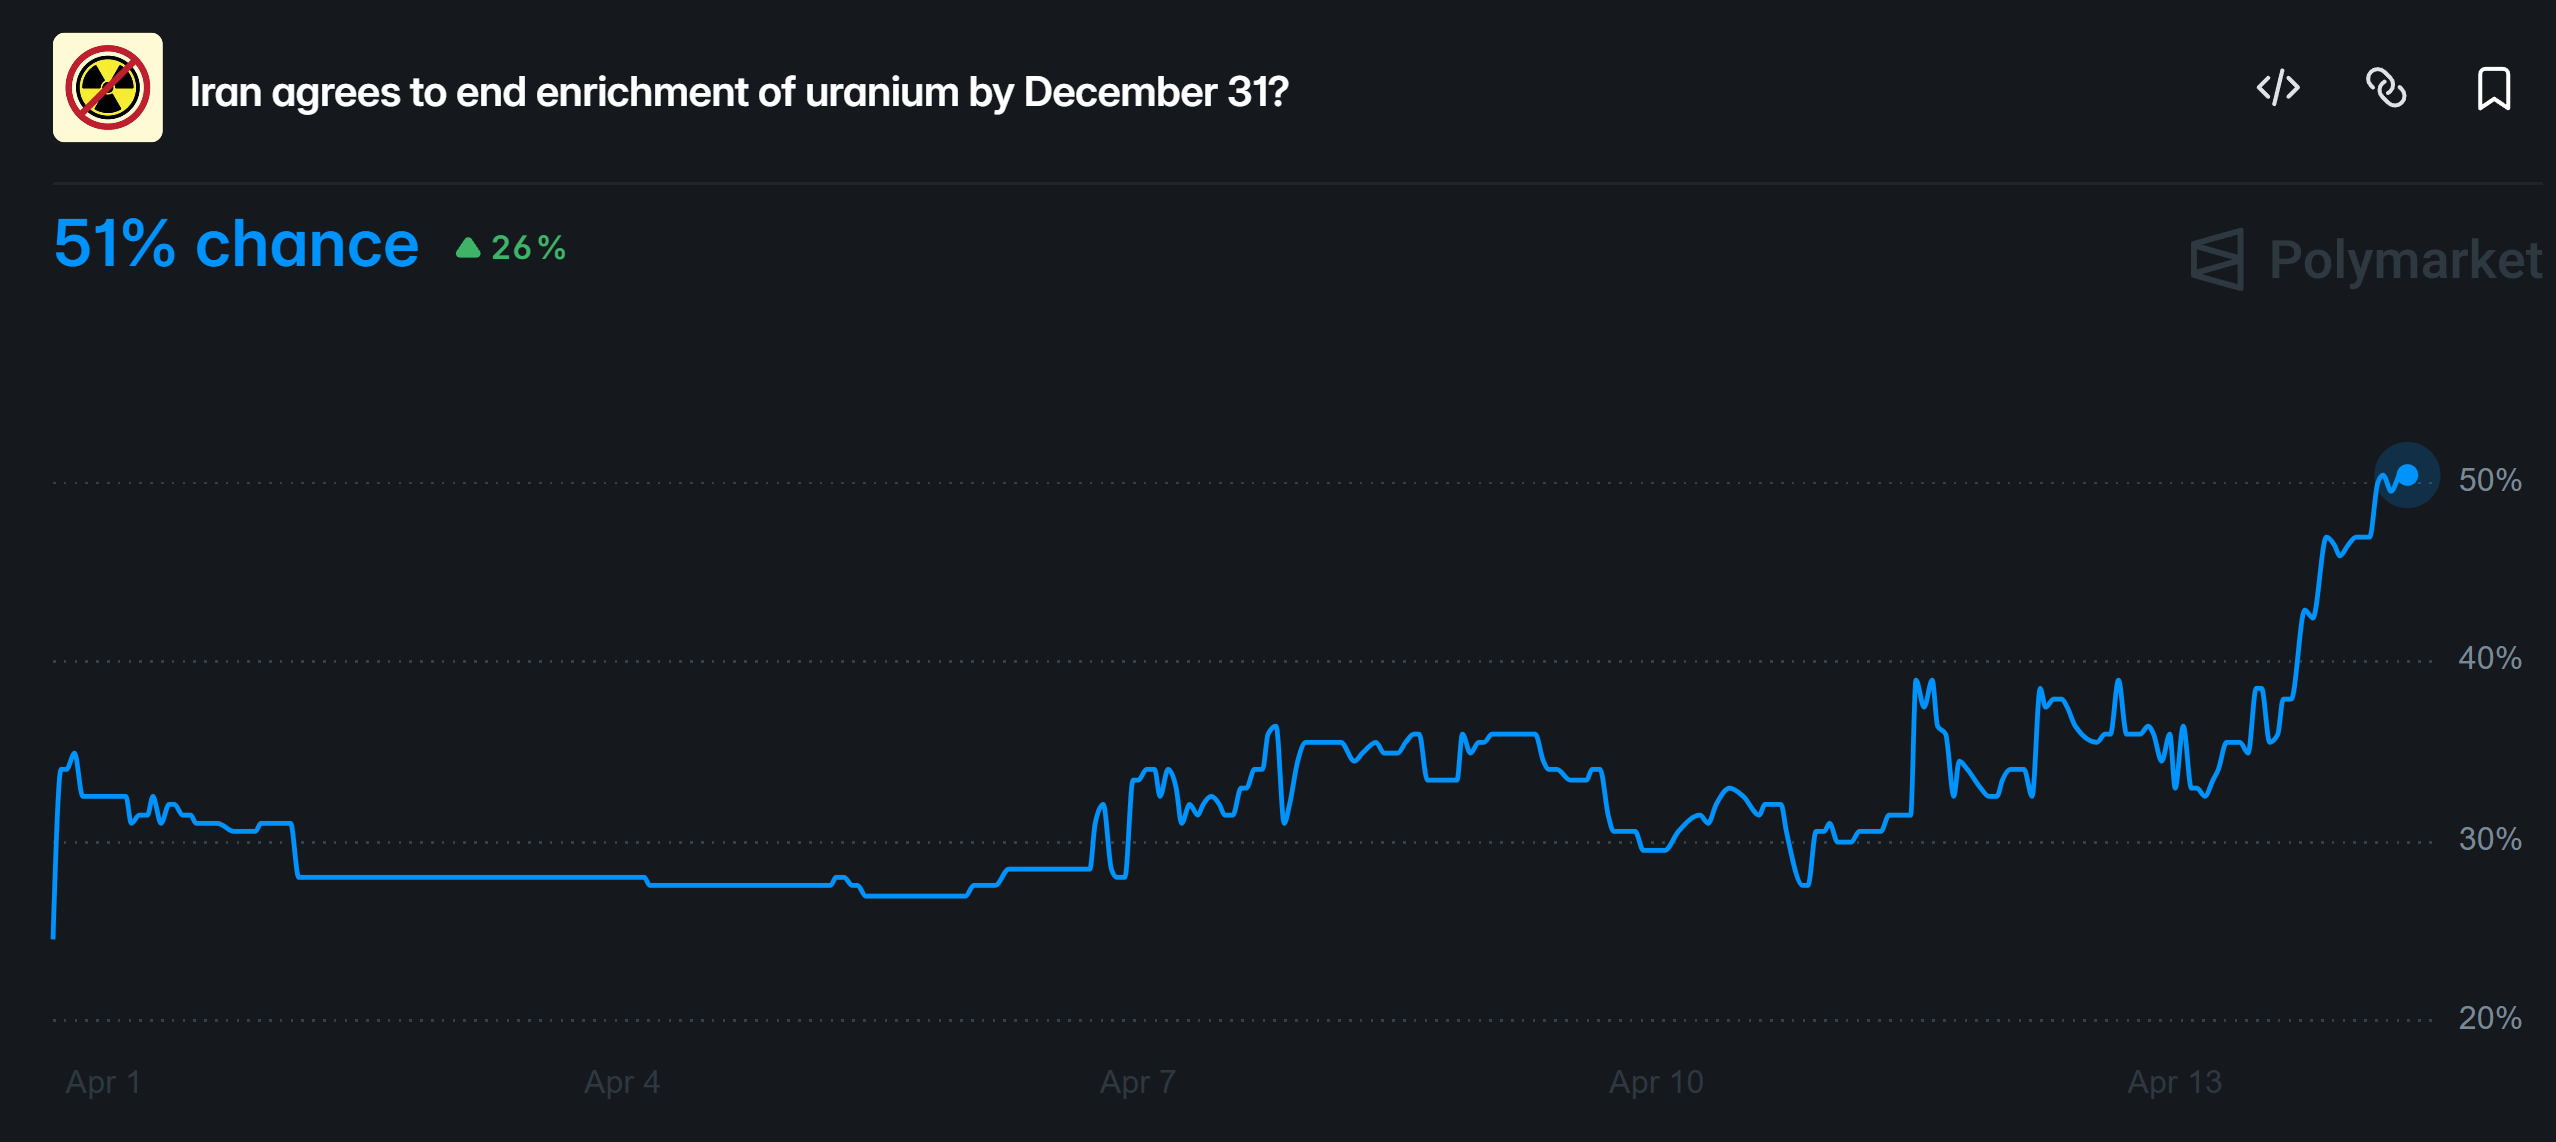
If Iran folds on enrichment, there are real odds Trump walks, claims victory, and pivots to stimulating the economy ahead of midterms. Venezuelan regime change, Iranian nuclear deal, Indonesian security deal, revitalized the Abraham Accords. Forcing the difficult conversation on NATO and heading into the USMCA review this summer with a very aggressive posture (watch out Canada, it’s going to hurt). There’s an argument to American voters that the sacrifices were worth it. The counter-blockade could be another “Leave the Bride at the Altar” (Stage 5 in the maximum pressure playbook) designed to extract last-minute concessions.

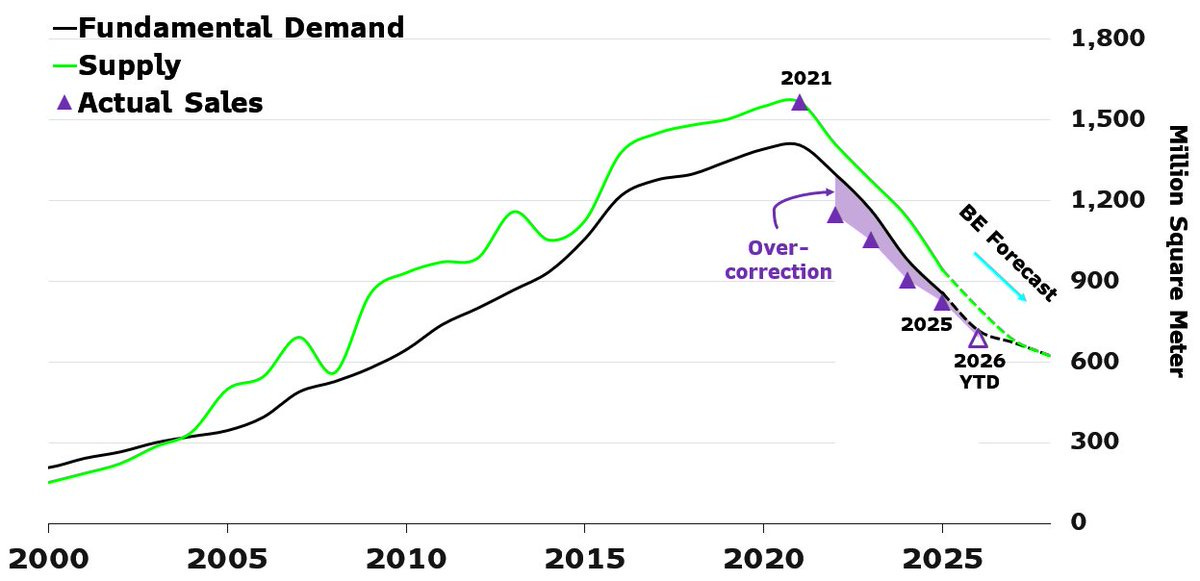
On the other hand, military assets are still moving into the region. Lebanon is unresolved. We don’t know who’s actually in charge in Tehran or what they’re willing to accept. China would clearly prefer the US get tied up in the heartland, but maybe by subjecting them to the same pain as Europe and the rest of Asia (and deepening their economic pain from property which appears never-ending), we can bring them to the table. Remember where all this military kit is coming from after.
Which brings us to the trade structure. We want a portfolio that is balance to peace and war.
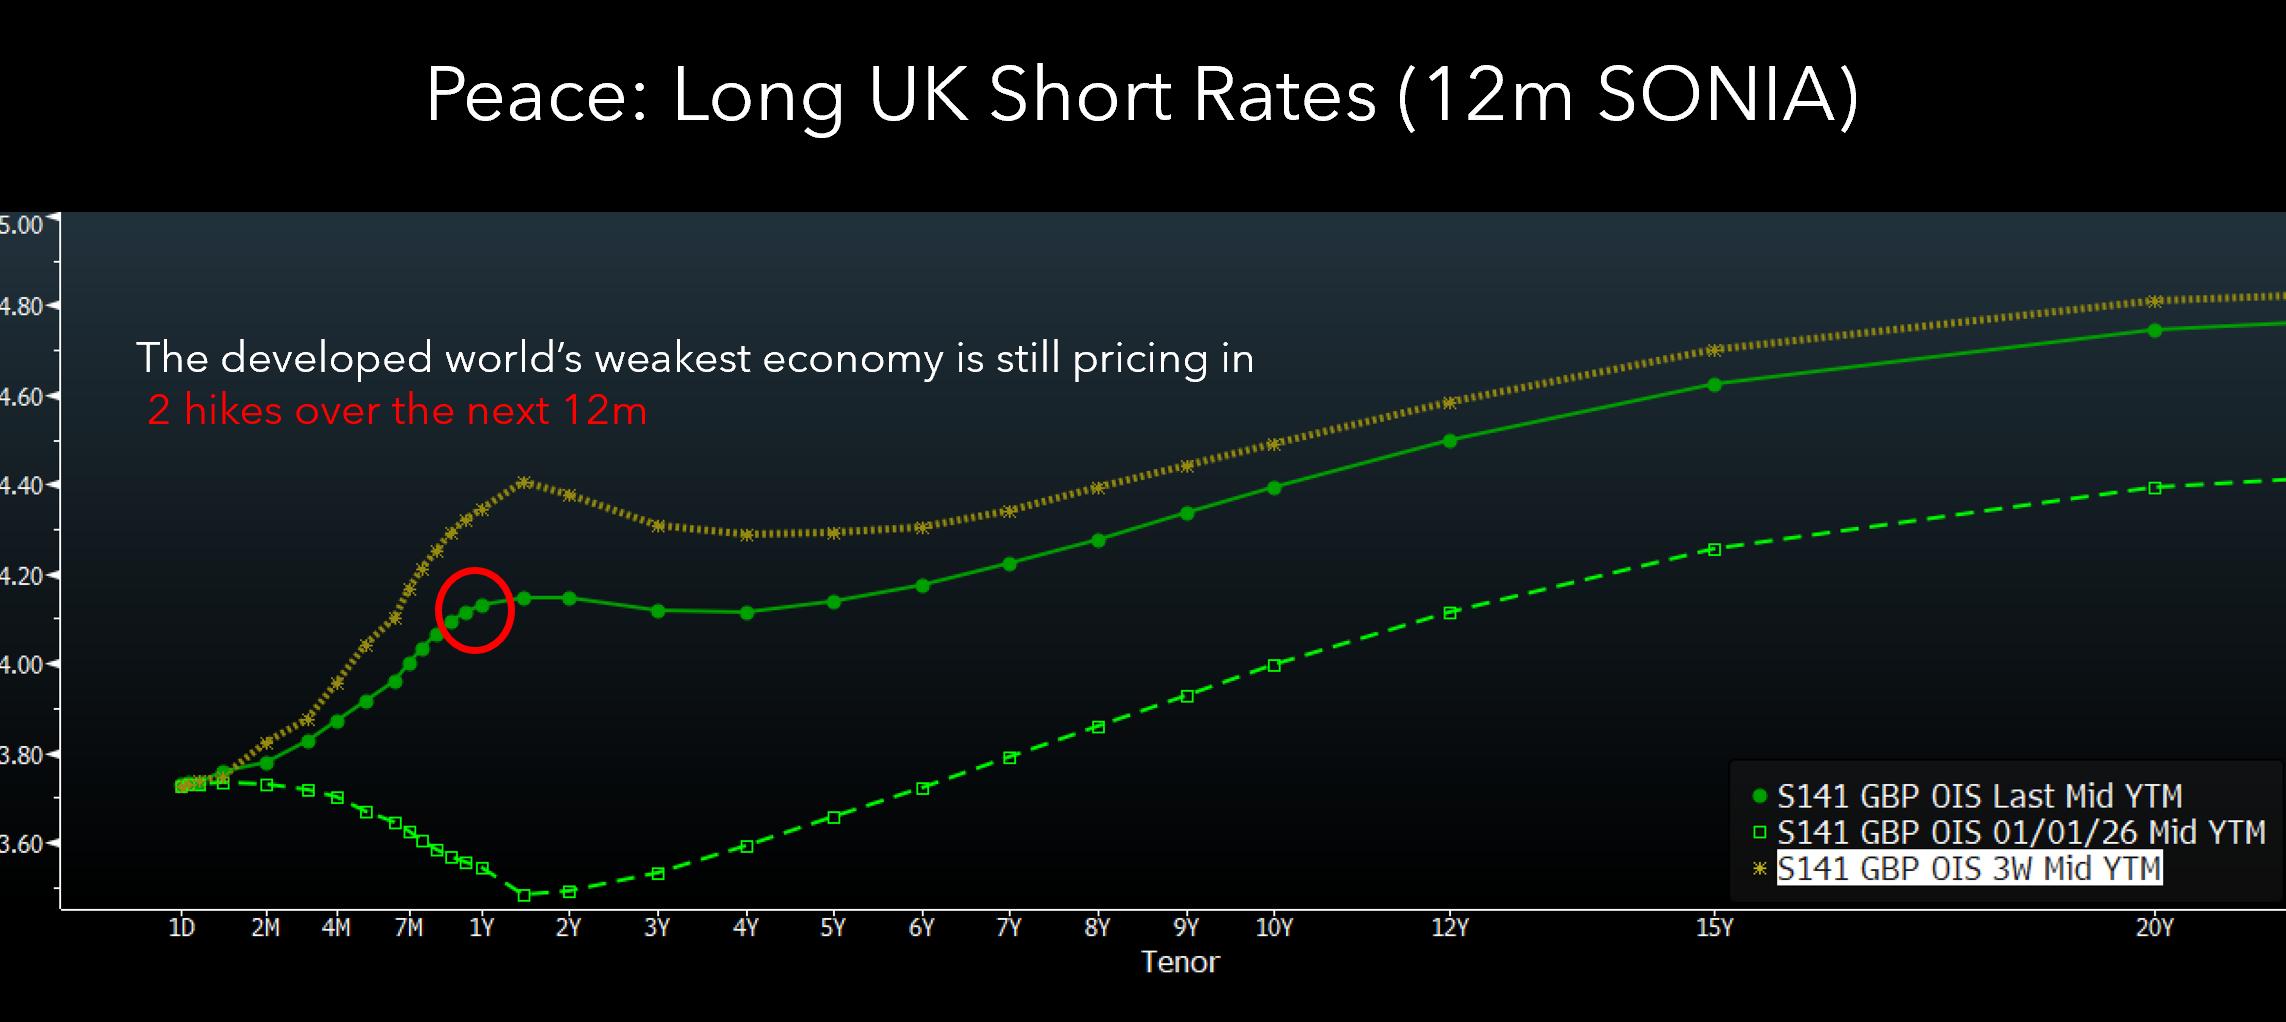
For peace: UK SONIA short rates. The UK is the most energy-import-sensitive major economy. If this resolves, oil falls back to $70, inflation expectations collapse, and the Bank of England cuts aggressively. SONIA Mar'27 futures are pricing that world at maybe 30% probability. We think peace odds are higher than that. The position has already paid us on the ceasefire rally, and if Iran folds on enrichment it likely pays enough to cover the grain book's losses in full. That's the portfolio construction: SONIA profits on peace, grains profit on war, and the calendar grinds in our favor either way. See our prior write up and Jason’s substack for this idea in depth. A lot of people will just yolo stonks here (and clearly already have - stocks are back at the highs!) but we want an expression with some more convexity to the upside.
For war: enter the grains. Add if things deteriorate. Every day the strait is closed and energy remains elevated, the combination of supply destruction and demand pressure is building, currently hidden by markets that are in supply glut for the short term. Exactly the kind of trades I specialize in. Early, but explosive.
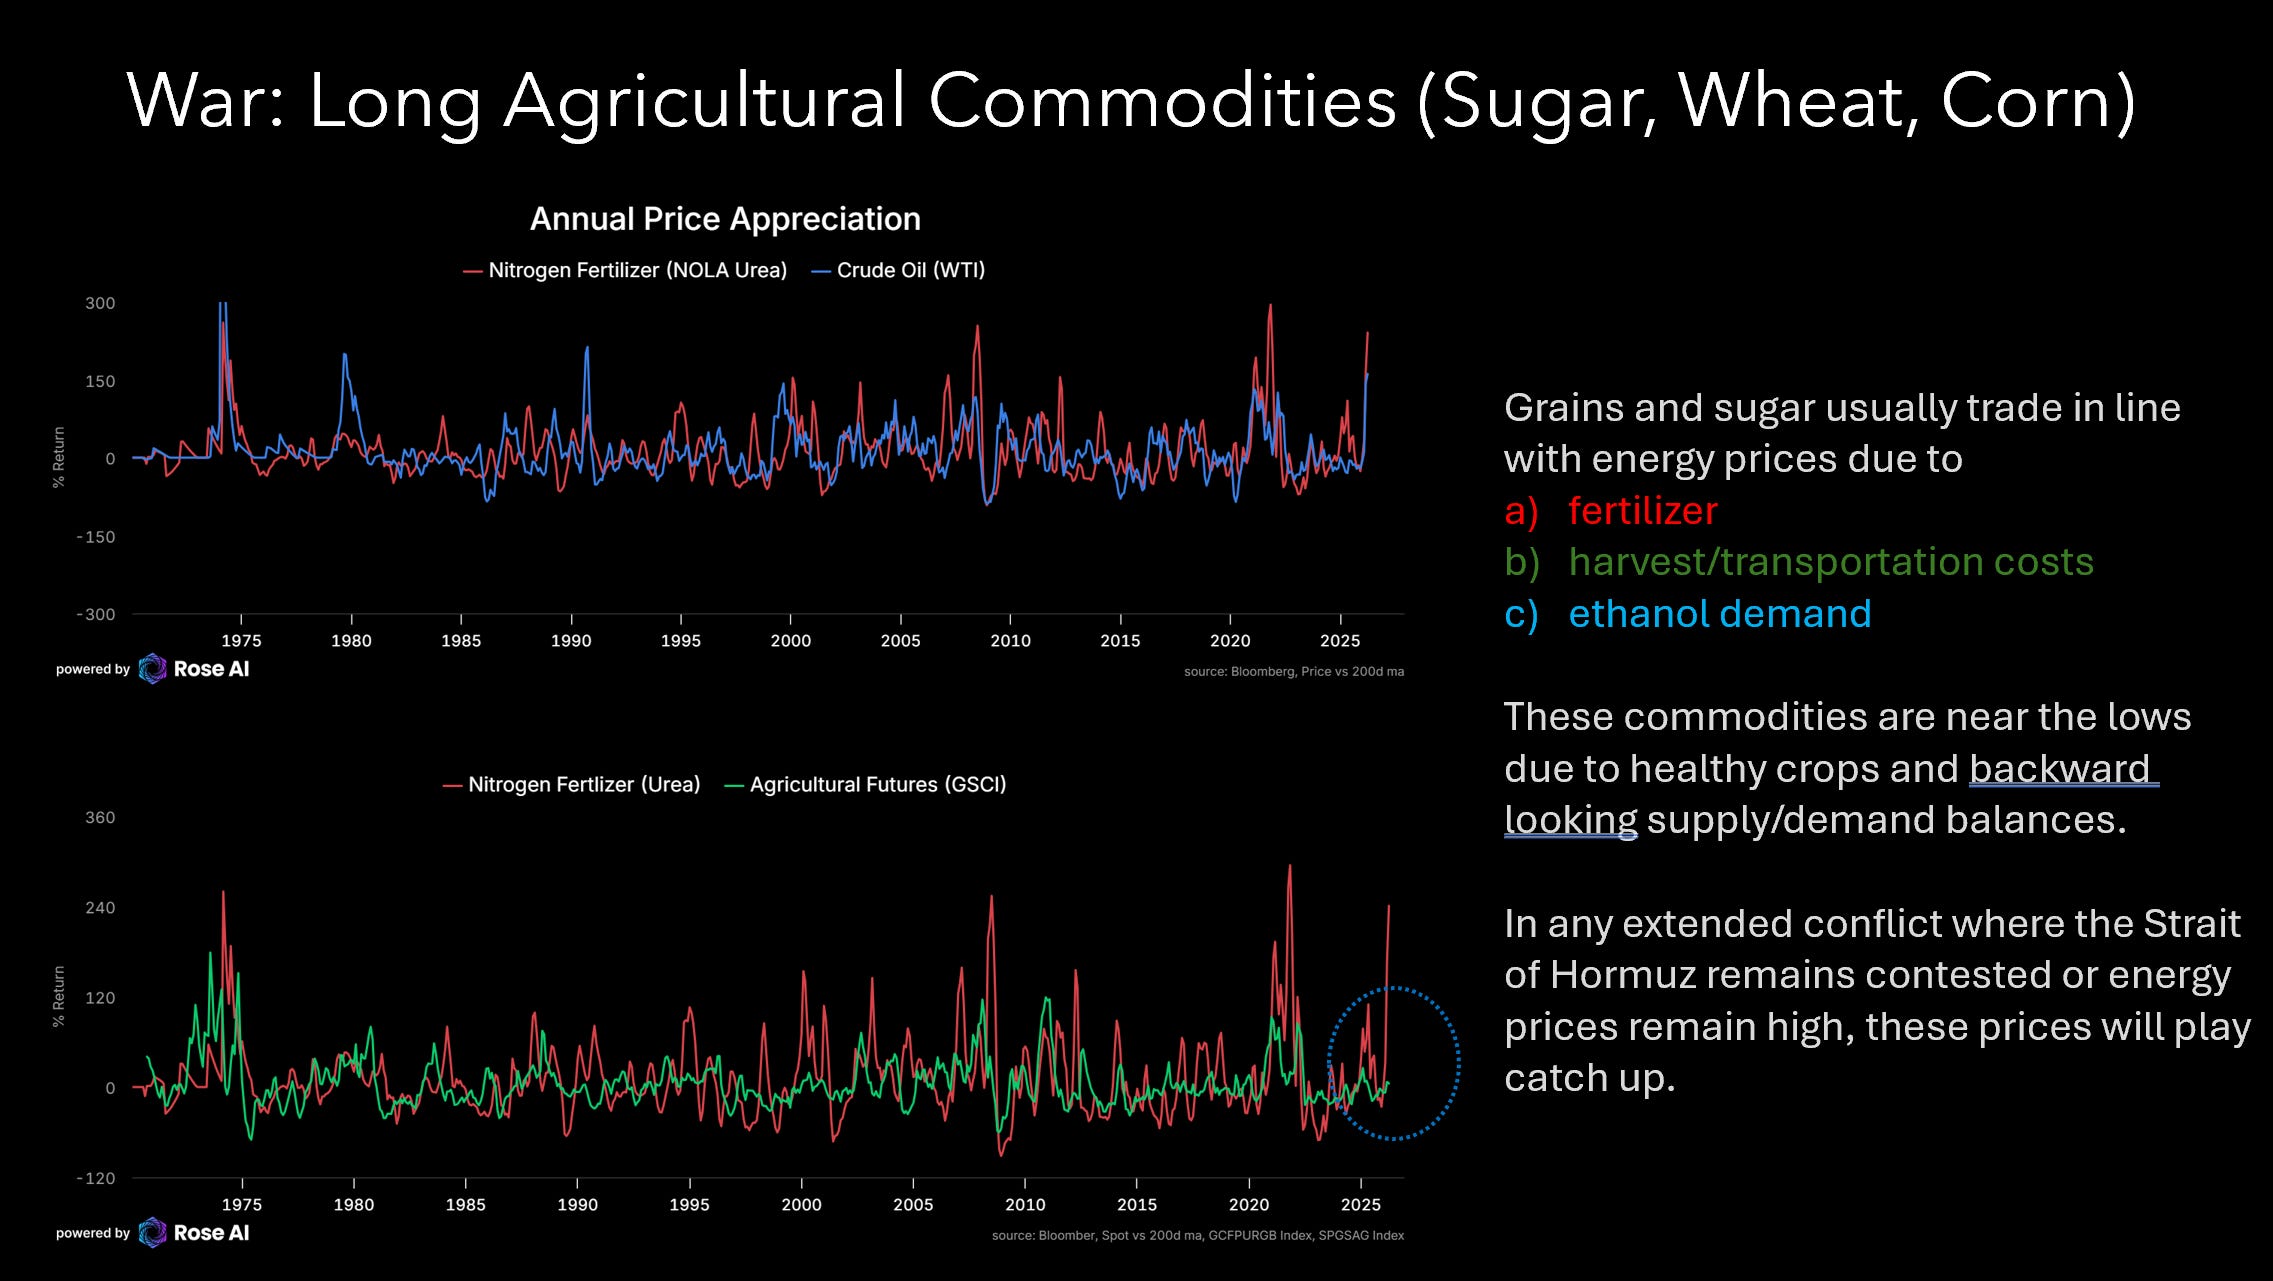
The cascade thesis doesn’t require the worst case. It requires the calendar to keep running while the market prices the first node and ignores the second. Even in the most optimistic scenario, Hormuz will take time to normalize. Energy prices will remain elevated for months, not weeks. The flow-through to fertilizer prices has already happened and won’t reverse on a handshake. High diesel at $5.98/gallon leads to abandoned marginal fields. Ethanol economics pull corn off the food market to supplement refined products. That’s the inherent convexity here, and why I probably want to continue to own these even if we do get peace in the next couple of weeks (after our gains in SONIA offset the likely losses in these positions).
The Three Commodities
Three crops, three mechanisms, one blockade. Each has a gate. A calendar window where the damage locks in permanently. Sugar's gate is the ‘crush allocation’ (choice between sugar for your car vs sugar for your tea), opening now. Wheat's gate is the middle east demand bid, already open and kicking in earnest in the next month. Corn's gates are stacked: acreage, pre-plant, sidedress, each closing in sequence through June.
Sugar is the most direct link. Sugarcane is one crop that becomes two products: sugar crystals or ethanol. Brazilian mills decide at crush time. The Centre-South crush started April 1. At $110+ Brent, ethanol is more profitable than sugar at the mill gate. Allocation shifts. The 11.2 million metric tonne global surplus starts shrinking in real time. UNICA fortnightly crush data starting reporting in late April and gives us near-real-time confirmation. Swap dealers are net long 157,000 contracts, near the highest since 2008. Managed money is pressing short at 56,000 contracts against them. The physical end users see something the specs don’t. The self-correcting feedback (mills shift back if sugar rallies above 18-19 cents) caps the move, which means the trade is 14 to 20, not 14 to 30. We remain long sugar call spreads.
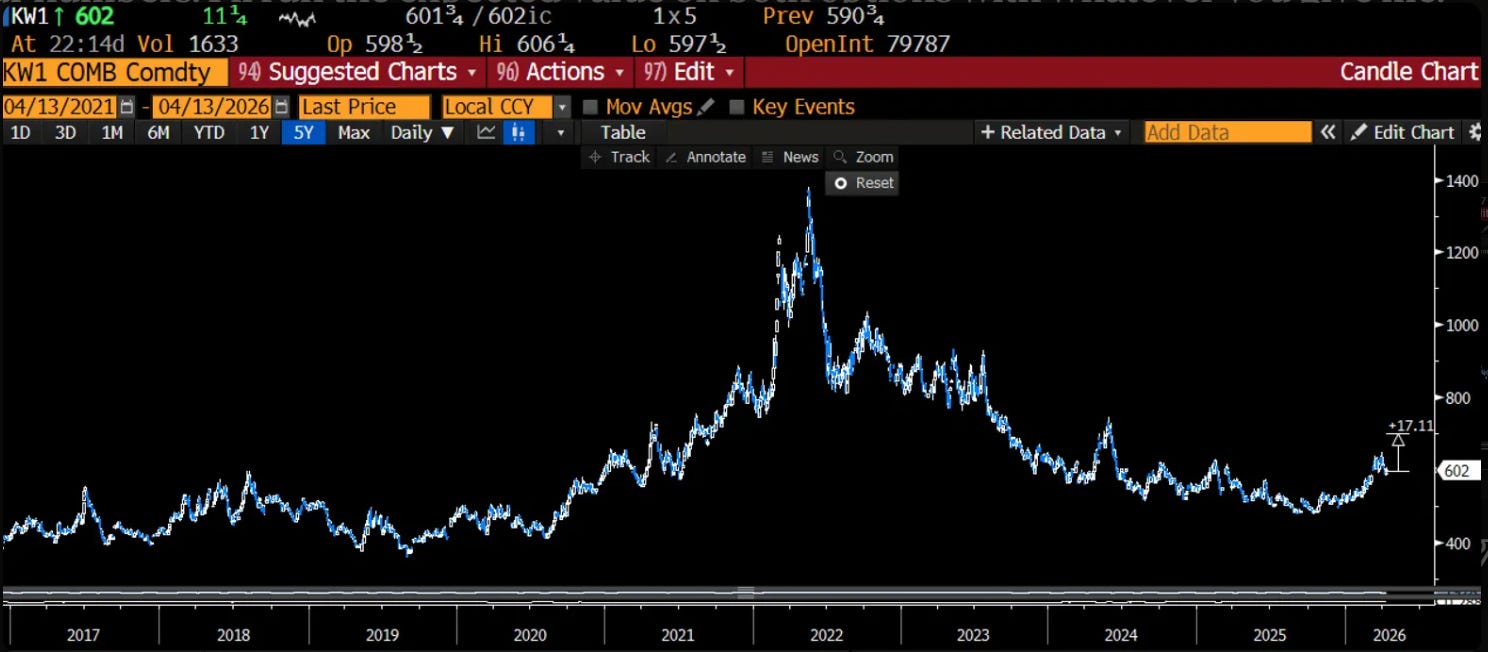
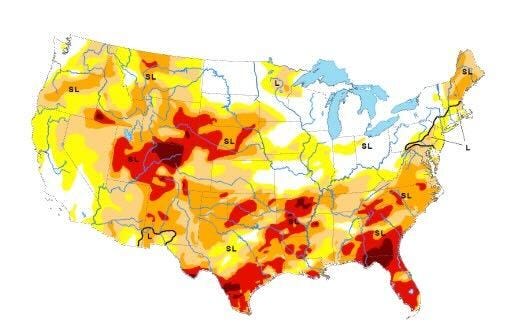
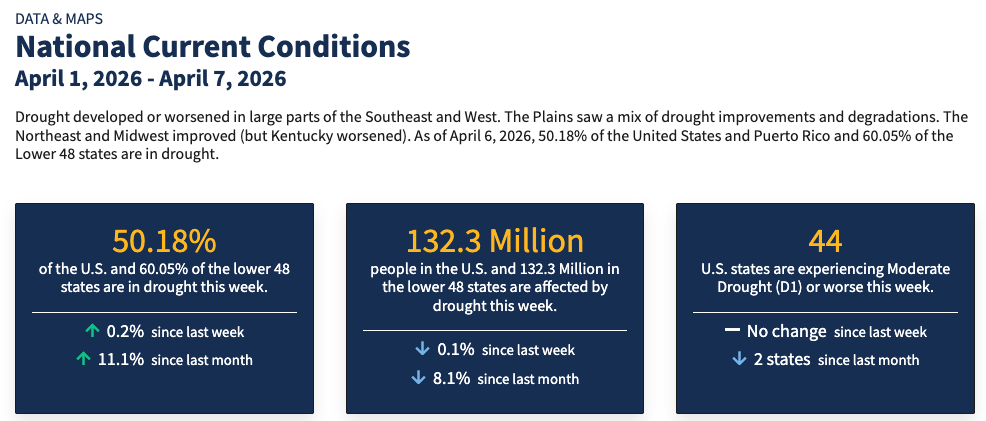
Wheat is the cleanest setup because it doesn’t need a perpetual blockade to work. Winter wheat opened the season at 35% good-to-excellent, worst since 2022. Oklahoma 54% poor-to-very-poor. Planted acres are the smallest since 1919. That’s a domestic supply problem that exists if the strait reopens tomorrow. Hormuz adds the demand side: MENA food security buying is a political imperative, not a discretionary purchase. Bread prices are regime risk. Egypt, Algeria, Iraq don’t cut wheat imports because prices rose 20%. They panic-buy. KC HRW implied vol at 25.6% against 24.7% realized is basically fair, though skew is intense. The market is not pricing a panic bid into the smallest US wheat crop in a century during a naval blockade. We added winter wheat futures (after rolling out of our calls last week, which I’ll walk through in the vol section below).
Corn has the biggest buffer and the longest fuse. Record production at 17 billion bushels, ending stocks at 2,127 million. The cascade changes the math through farmer decisions at specific calendar gates, each one permanent once the window shuts. Pre-plant nitrogen (happening now, 40% buying at $924 spot). Acreage allocation (June 30 reveal). Sidedress nitrogen (the binary gate in June, where 15-20 million acres either get their top-up or don’t, forever, after V8 around June 22). The corn trade needs the blockade to persist through sidedress AND the July WASDE reports to revise yields. Three gates, sequential, uncertain. We hold longer term (fall/winter) calls but the catalysts are closer and the mechanisms more direct in the other two.
Over 21 million tonnes per year of nitrogen capacity is now physically offline, destroyed, or export-blocked. QAFCO in Qatar, 5.6 million tonnes, hit by strikes, 3-5 year repair timeline. Yara Pilbara in Australia dark until late May. Nutrien Trinidad idle since October. India shuttering plants as Qatar’s LNG stops flowing. China blocking exports. And Nutrien’s Lima, Ohio plant about to go offline for a 72-day turnaround in August through October.
The supply isn’t delayed. It’s gone. The calendar keeps running.
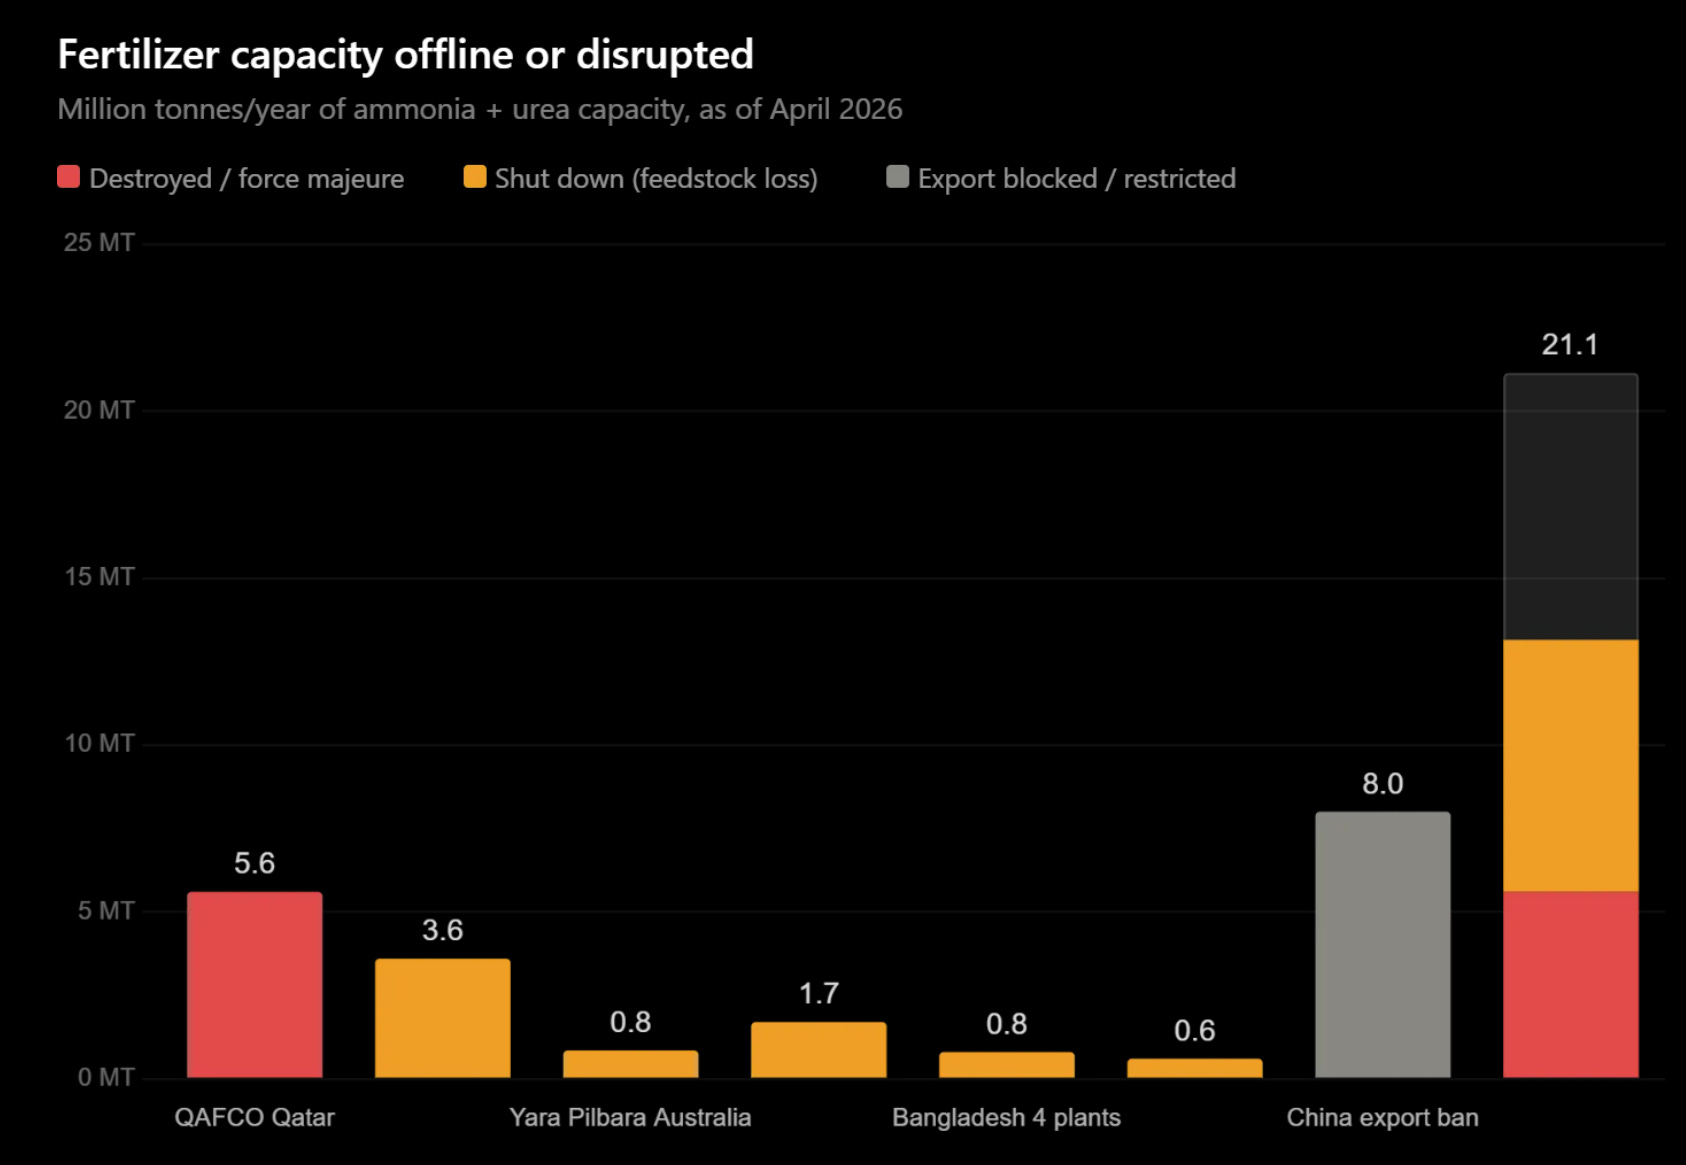
What follows is the deep dive. Commodity by commodity, the supply and demand picture, scenario models across three blockade durations (one month, three months, twelve months), the vol work, the positioning, and the specific trades.
We start with sugar because the crush is happening now. Then wheat because it’s harvesting now and the demand story is already live. Then corn because the gates are still closing and the biggest catalyst (sidedress) is two months away.
Sugar: The Ethanol Diversion
Sugar is the most direct link in the cascade because it skips the fertilizer node entirely. The transmission runs through oil price.
Sugarcane is one crop that becomes two products. Brazilian mills crush the cane, extract the juice, and decide at that moment whether to crystallize it into sugar or ferment it into ethanol. The Centre-South crush started April 1. At $110+ Brent, ethanol is more profitable than sugar at the mill gate. Every $10 move in crude shifts approximately 1.5% of Brazil’s sugar-to-ethanol allocation. That sounds small until you remember that Brazil produces 45 million metric tonnes of the world’s 189 million. A 4-point shift in allocation is 3.5 MMT of sugar that simply ceases to exist. The cane is still growing, still getting harvested, still getting crushed. The mill just pointed the juice at a different tank.
This mechanism became structural in 2003 when Brazil launched flex-fuel vehicles. Before that date, sugar squeezes were pure supply shocks: Soviet crop failures, Cuban embargoes, Indian monsoon collapses. After 2003, every major sugar rally has involved the ethanol channel as either the primary driver or a major accelerant.
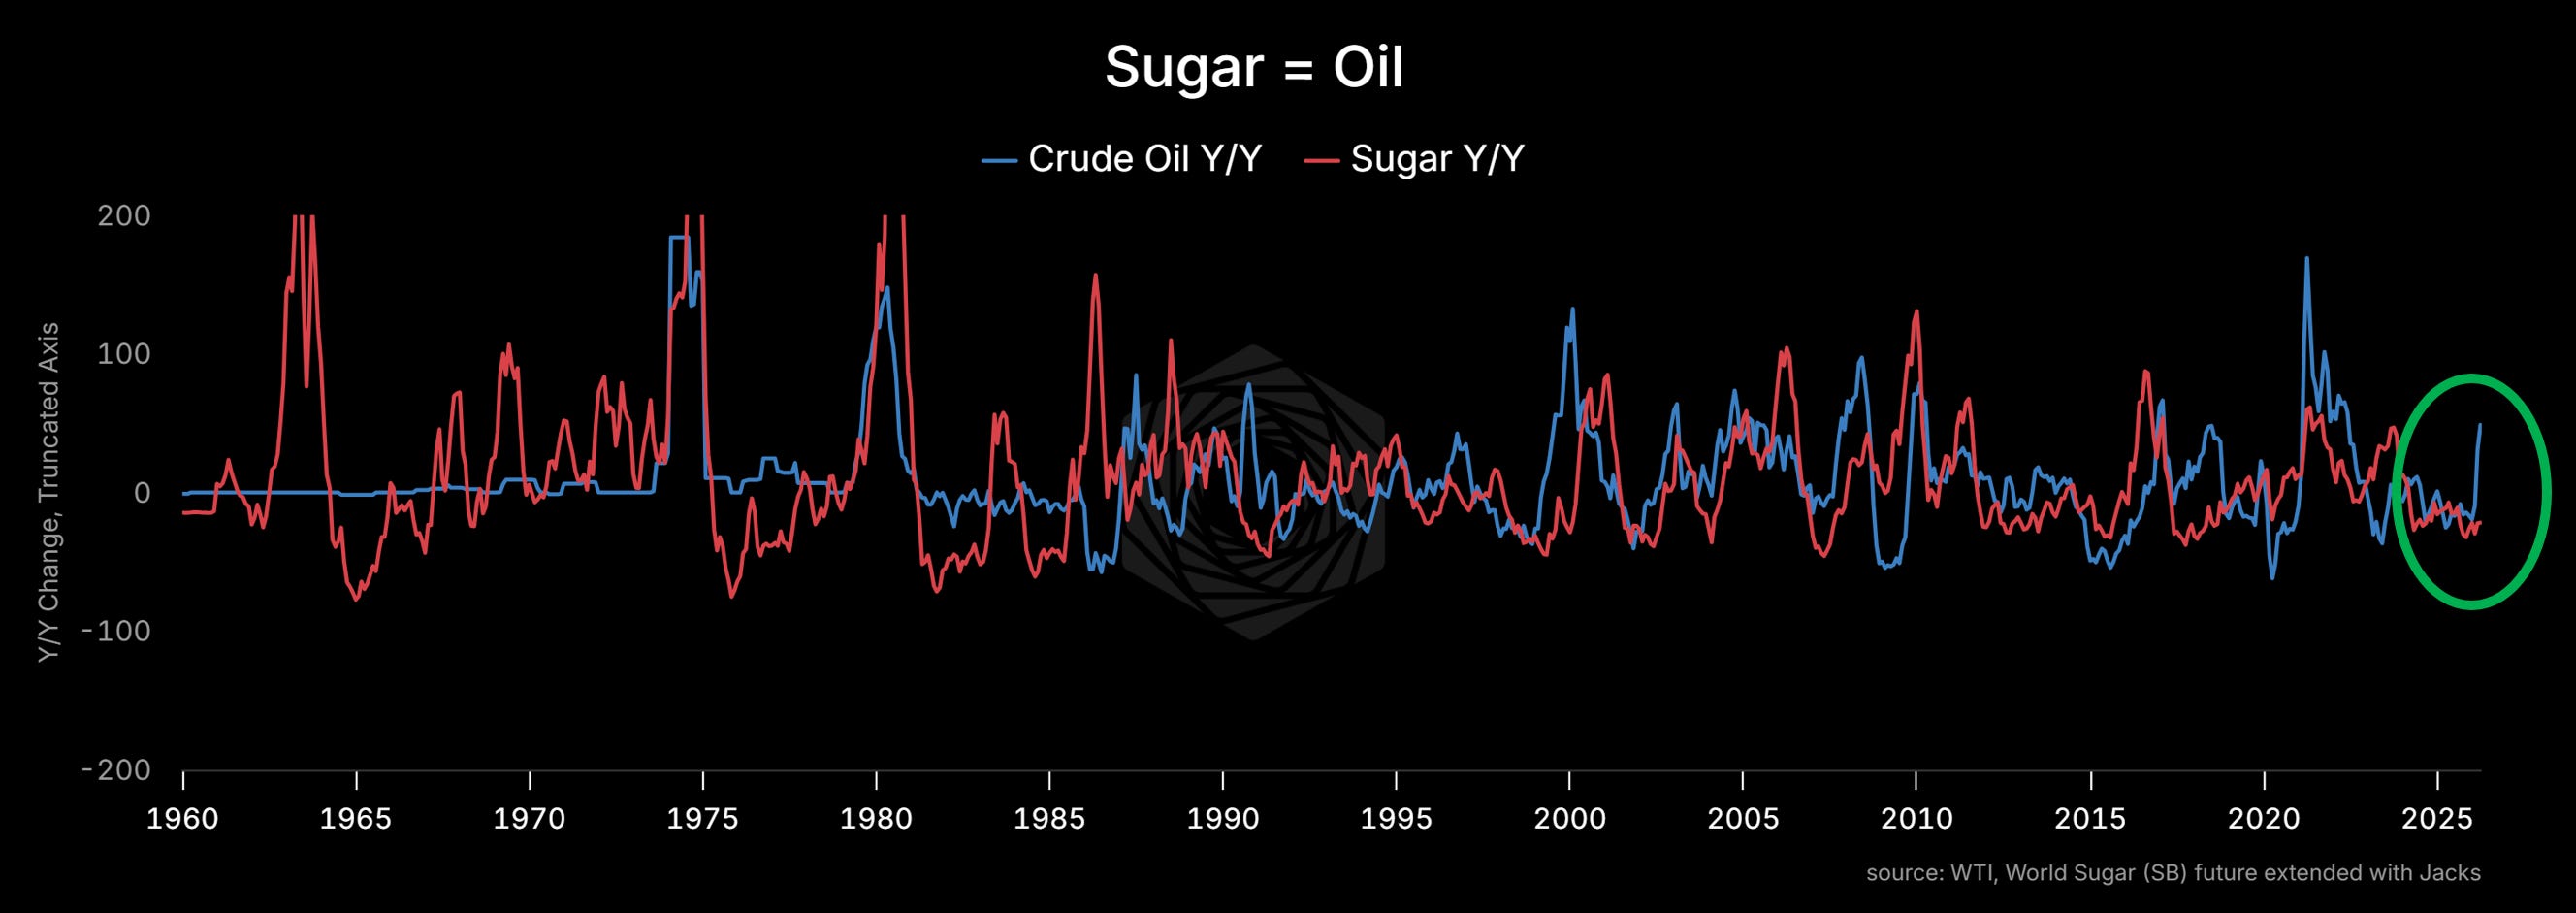
The lag between oil moving and sugar following has historically been 2-6 months. The lag is the crush calendar. Mills can’t reallocate until the new season begins. The 2026/27 season started twelve days ago. If the pattern holds, the red line should start moving by May/June.
The balance sheet
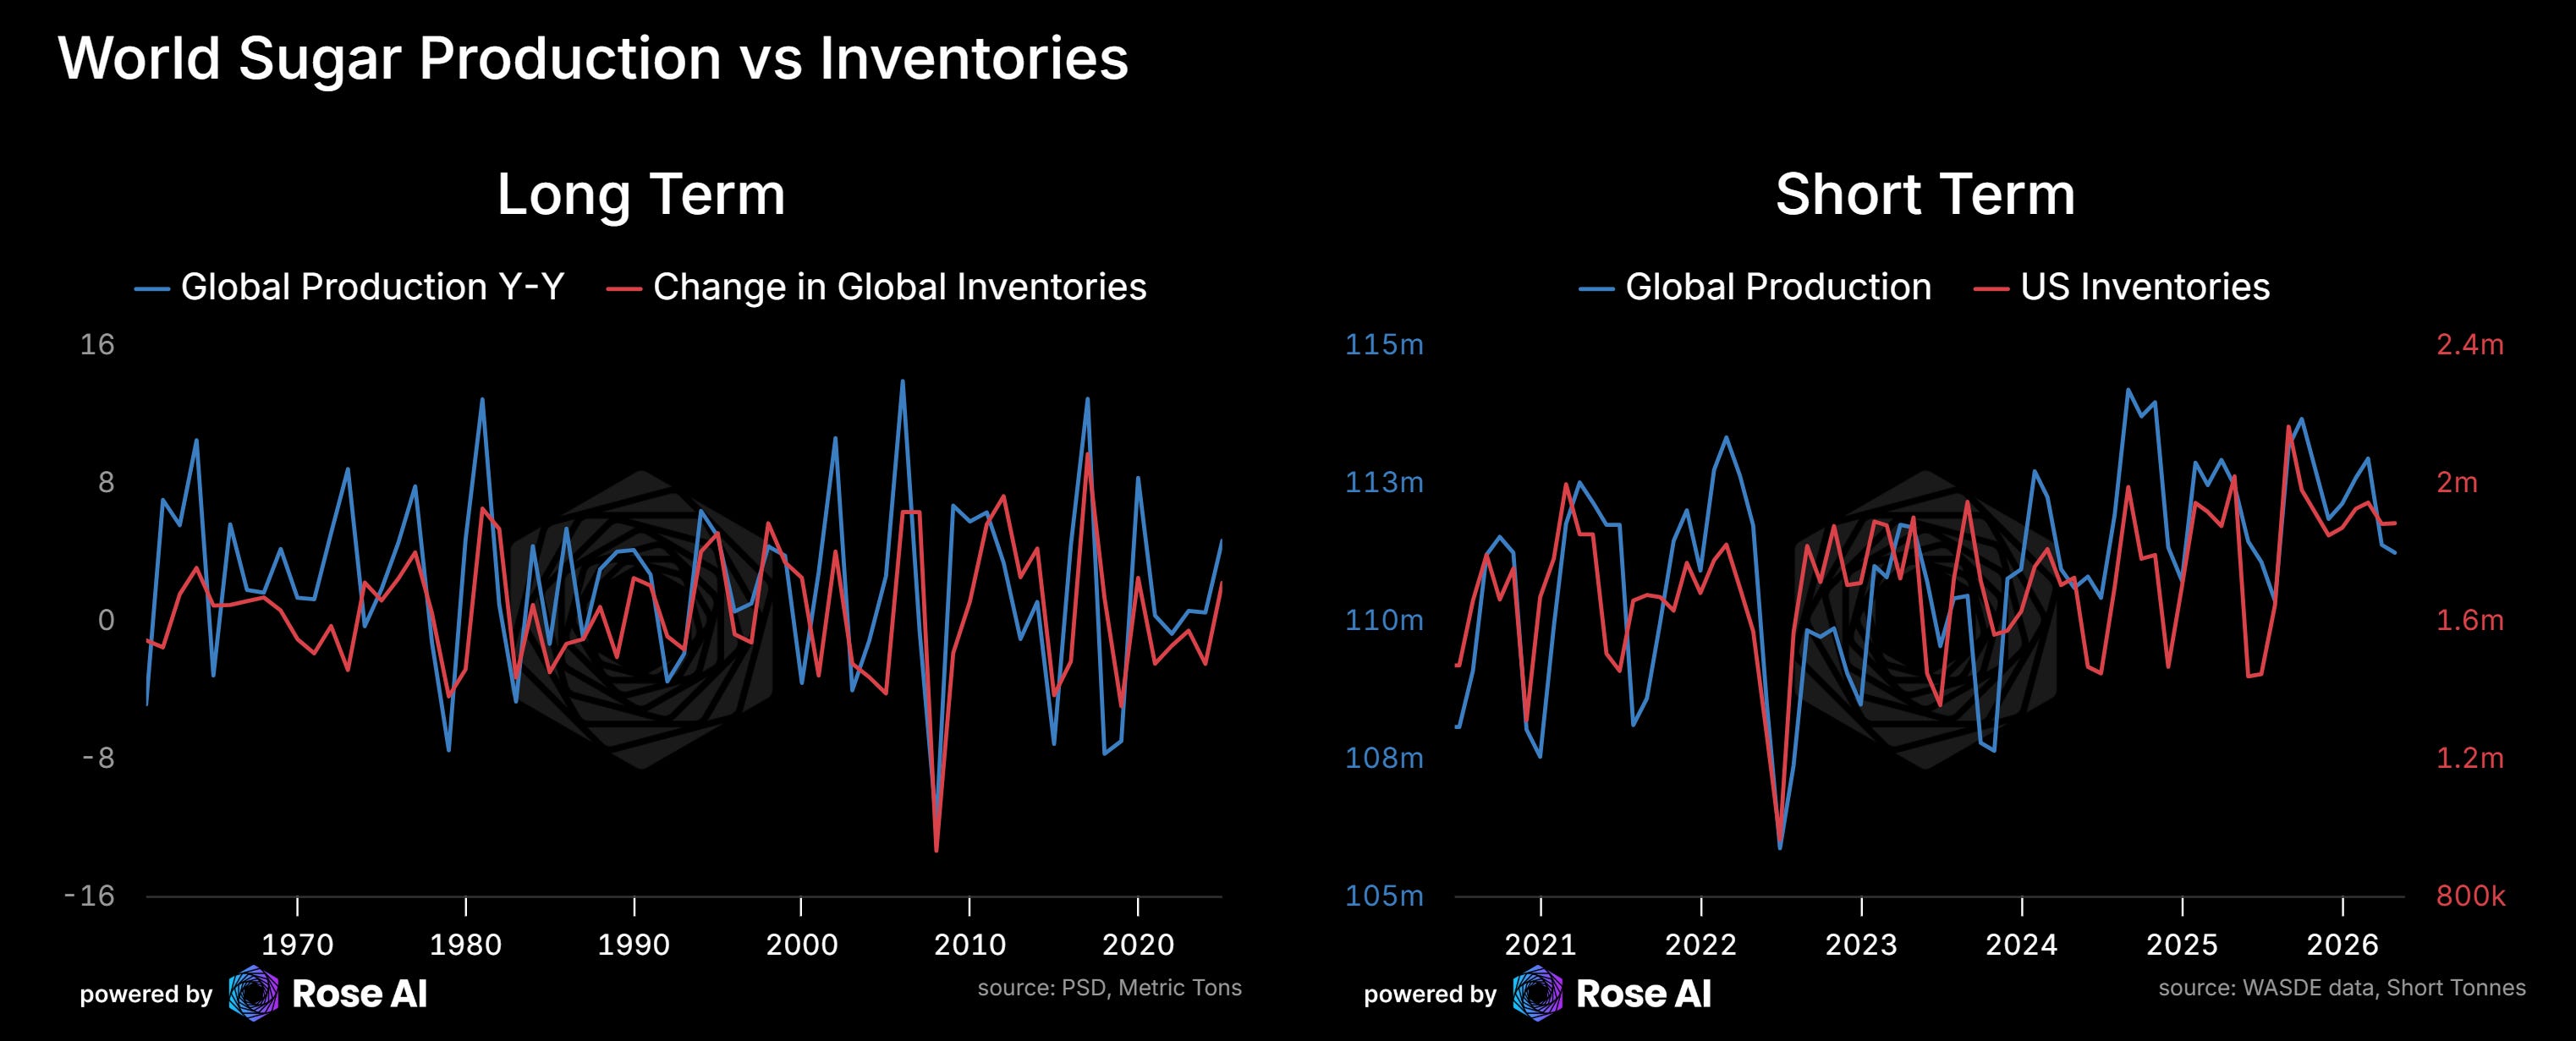
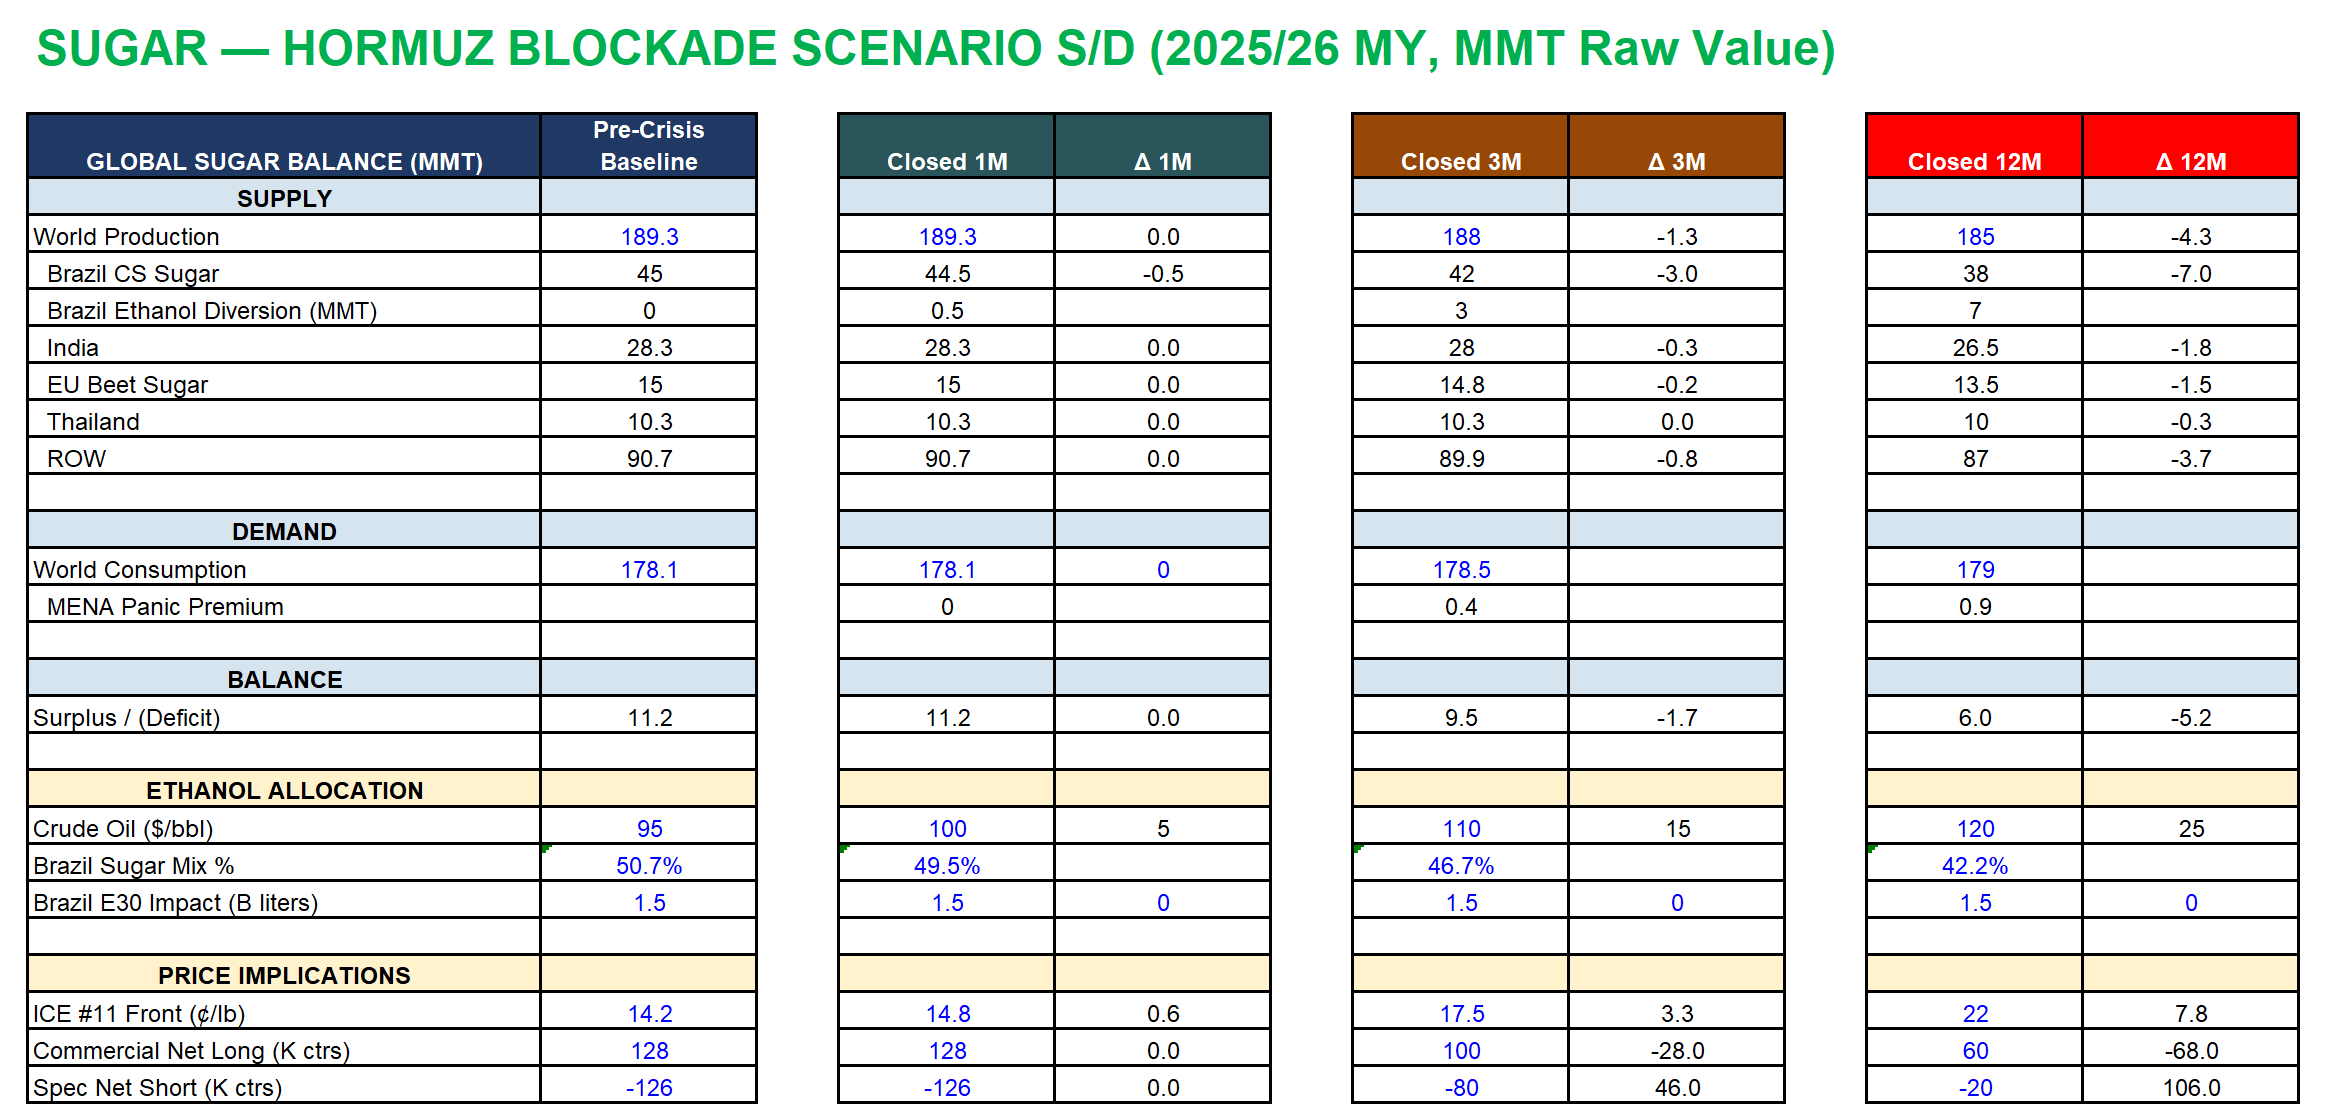
World sugar production sits at 189.3 MMT (million metric tons) against consumption of 178.1 MMT, a surplus of 11.2 MMT. That’s the most comfortable balance since 2017. ICE #11 at 13.75 cents reflects this reality accurately. The market is not mispriced for the world as it stands today.
Brazil’s Centre-South produced a record 45 MMT last season at a 50.7% sugar allocation. India came in at 28.3 MMT, below domestic consumption of 28.5 for the second consecutive year. The government approved a 2 MMT export quota but only 300,000 tonnes have shipped because Indian breakeven costs sit around 18.5 cents, well above the world price. Thailand is steady at 10.3 MMT. EU beet sugar contracted to 14.8-15.5 MMT as collapsed white sugar prices drove an 8-10% reduction in harvested area.
The surplus is real. The question is how much of it survives the crush.
Where the stocks actually sit
The headline number, 44.5 MMT of global ending stocks, is misleading for trade purposes. Most of it is locked up in countries that will never export it.
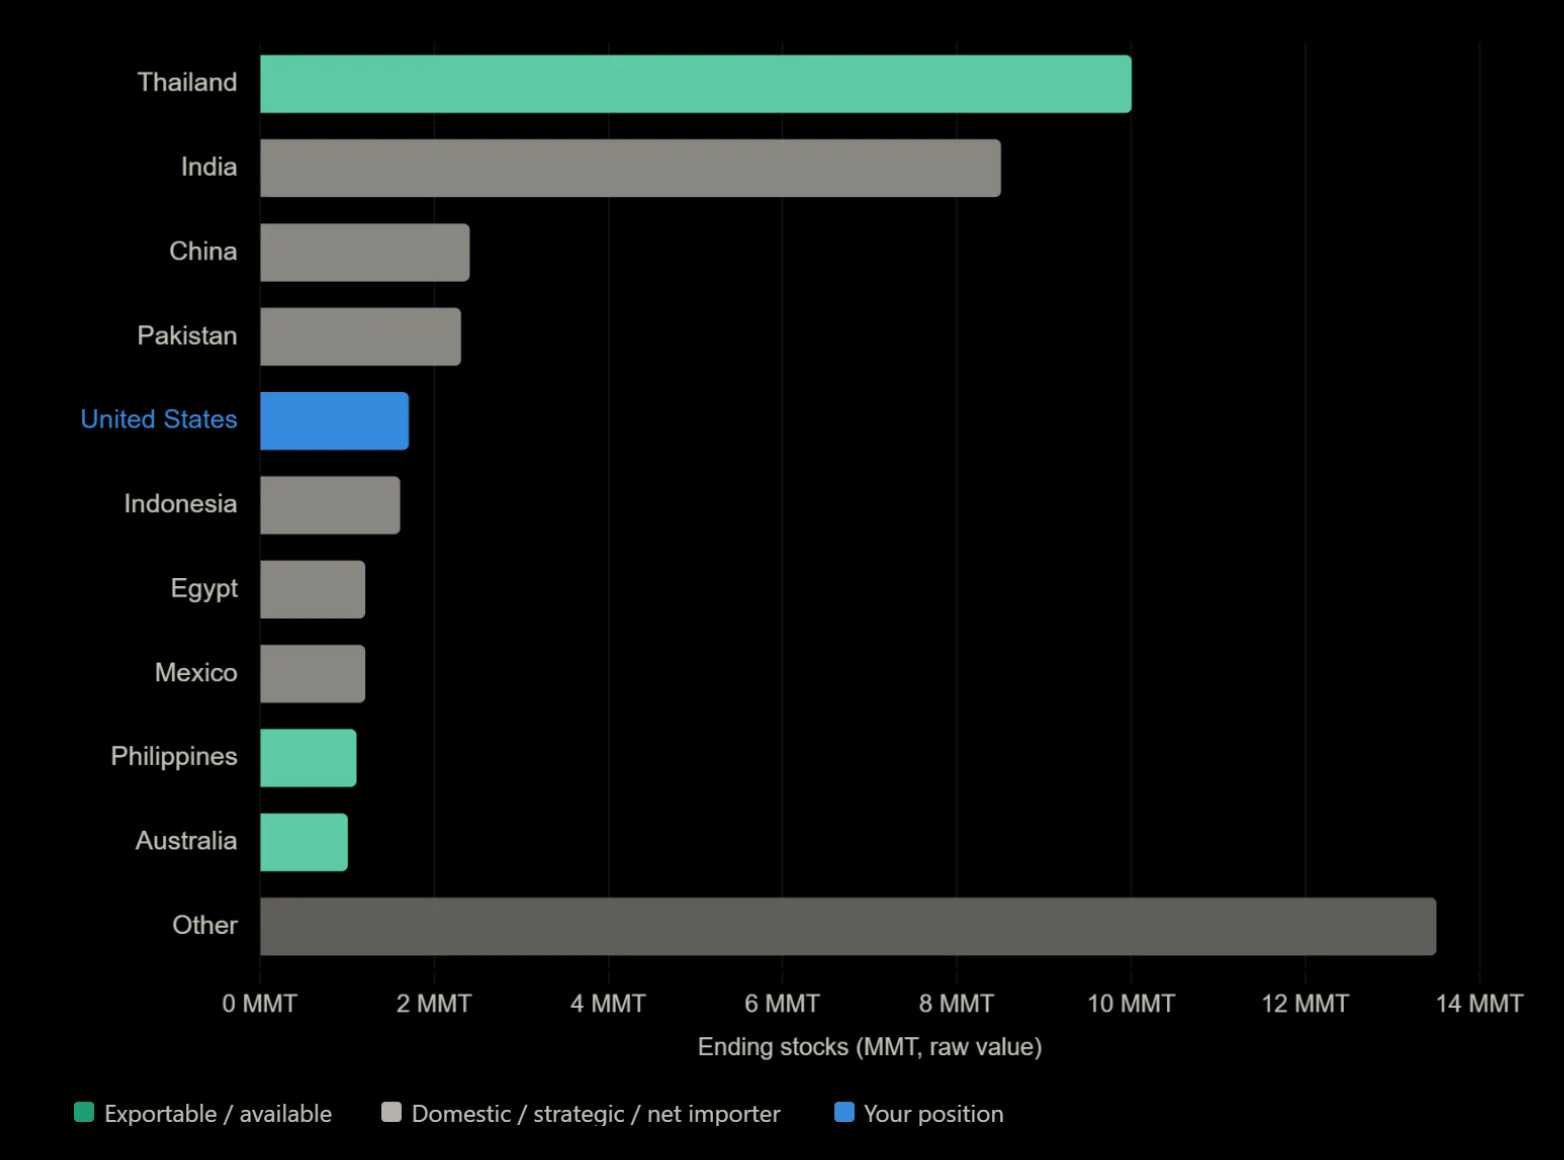
Thailand holds 10 MMT. That’s accumulated unsold inventory from exports running below expectations. It’s available to the world market but Thai mills need a price signal to release it. India holds 8.5 MMT, almost entirely domestic buffer against their own production shortfall. China’s 2.4 MMT is strategic reserve. Pakistan’s 2.3 MMT is domestic. US 1.7 MMT is managed by Commerce Department quota programs targeting a 13.5% stocks-to-use ratio. Out of 44.5 MMT of global stocks, the truly exportable, available supply is perhaps 12-15 MMT. If Brazil diverts 4-7 MMT from sugar to ethanol, it’s eating into the available surplus, not the headline number.
Three scenarios
Closed one month. The crush is only 6% complete by early May. Allocation slips to 49.5%. That’s 0.5 MMT diverted. The surplus is unchanged at rounding level. Sugar moves to maybe 14.80. This is noise.
Closed three months. If crude sustains above $110, this is where things start to really move. São Paulo hydrous ethanol parity sits above sugar at the mill gate. Allocation drops to 46.7%. Brazil CS sugar production falls to 42 MMT, down 3 from baseline. India produces 28 MMT, again below domestic consumption. EU beet sugar contracts further to 14.8 MMT. Total ethanol diversion: 3 MMT. The surplus shrinks from 11.2 to roughly 9.5 MMT. ICE #11 moves to 17.50. The 56,000 contracts of managed money net short starts covering.
Closed twelve months. Crude at $120. Allocation collapses to 42.2%. Brazil CS sugar falls to 38 MMT, down 7 from baseline. India slips to 26.5 MMT as the El Niño building at 62% probability disrupts the monsoon. EU contracts to 13.5 MMT. Thailand loses 300,000 tonnes. World production drops to 185 MMT. The surplus narrows to 6 MMT. Still positive, but the trajectory points toward a 2027/28 deficit. ICE #11 reaches 22 cents.
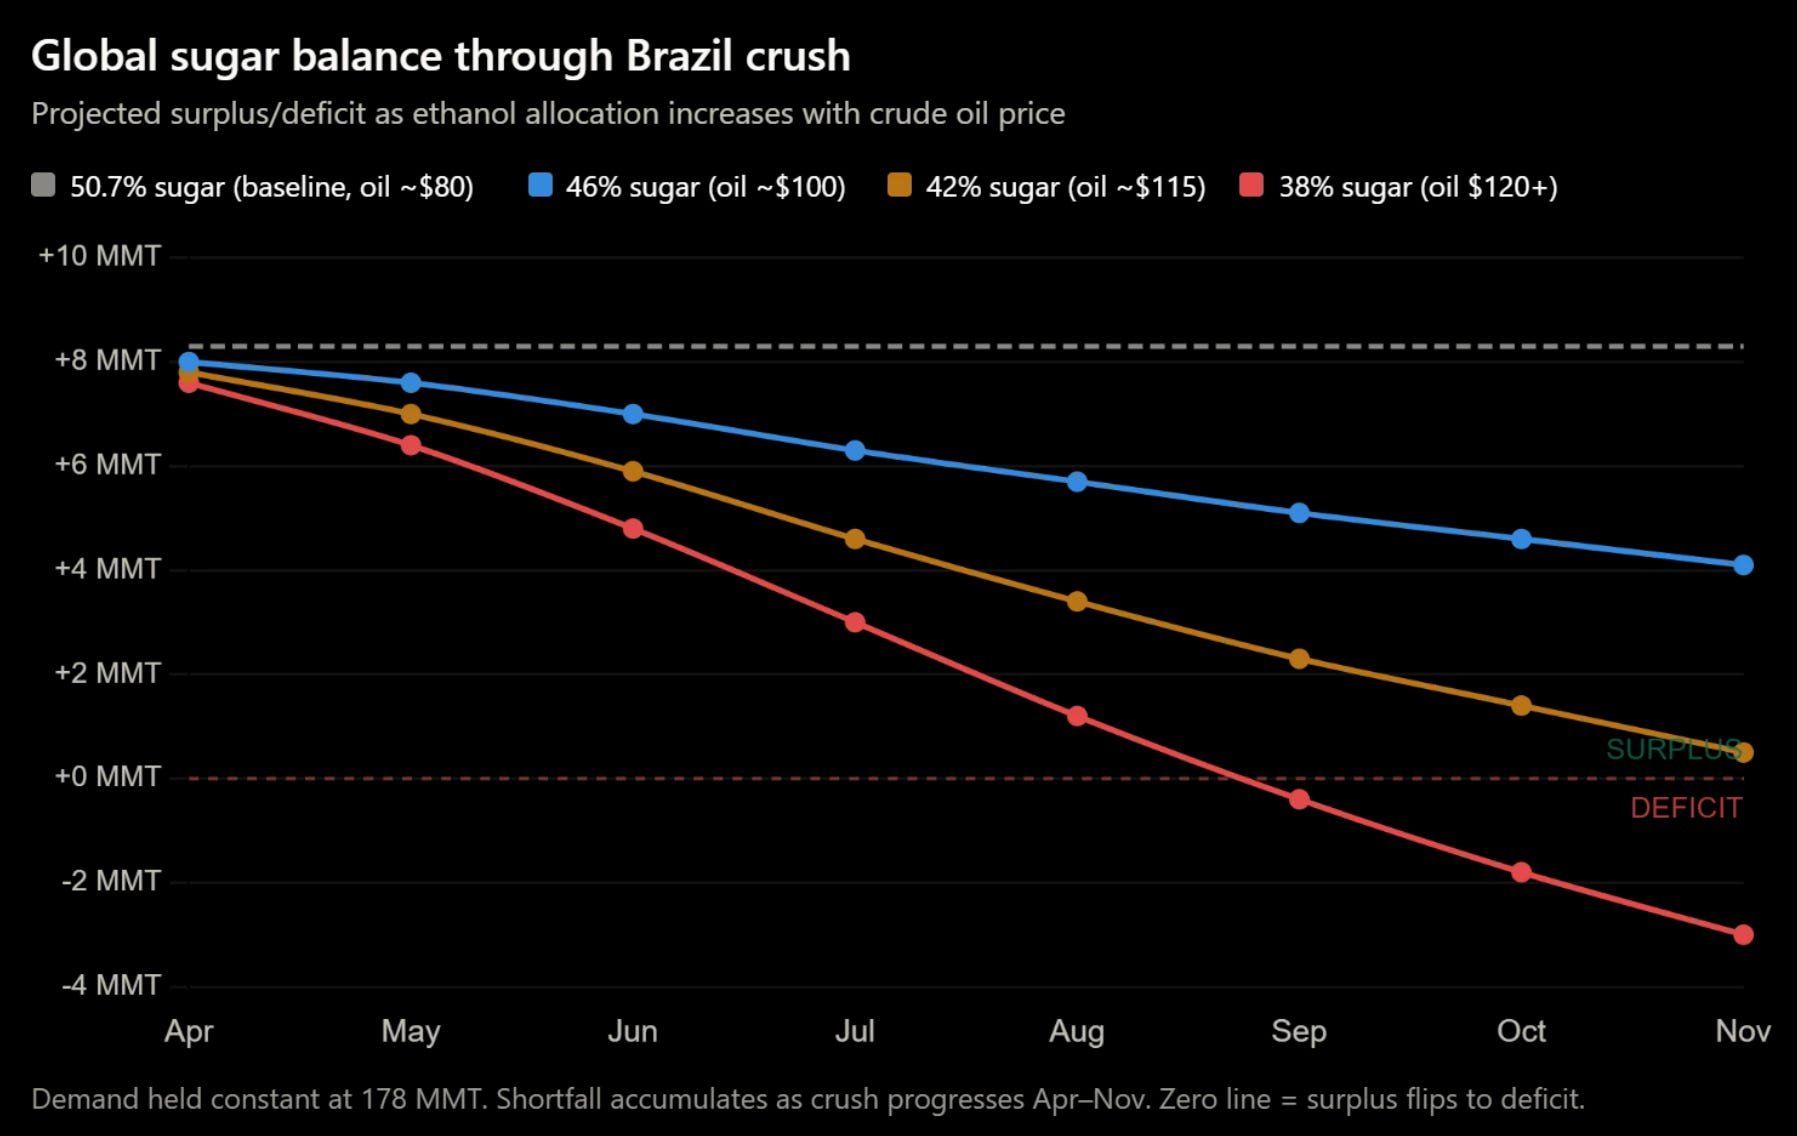
The self-correcting feedback caps the upside. If sugar rallies above ethanol parity at 18-19 cents, mills shift allocation back mid-crush. The supply response is measured in weeks, unlike cattle (years) or corn (one growing season). This means the trade is 14 to 20. Not 14 to 30. Every sugar squeeze since 2003 has had this governor. The ceiling is real. Size accordingly.
The cascade flow
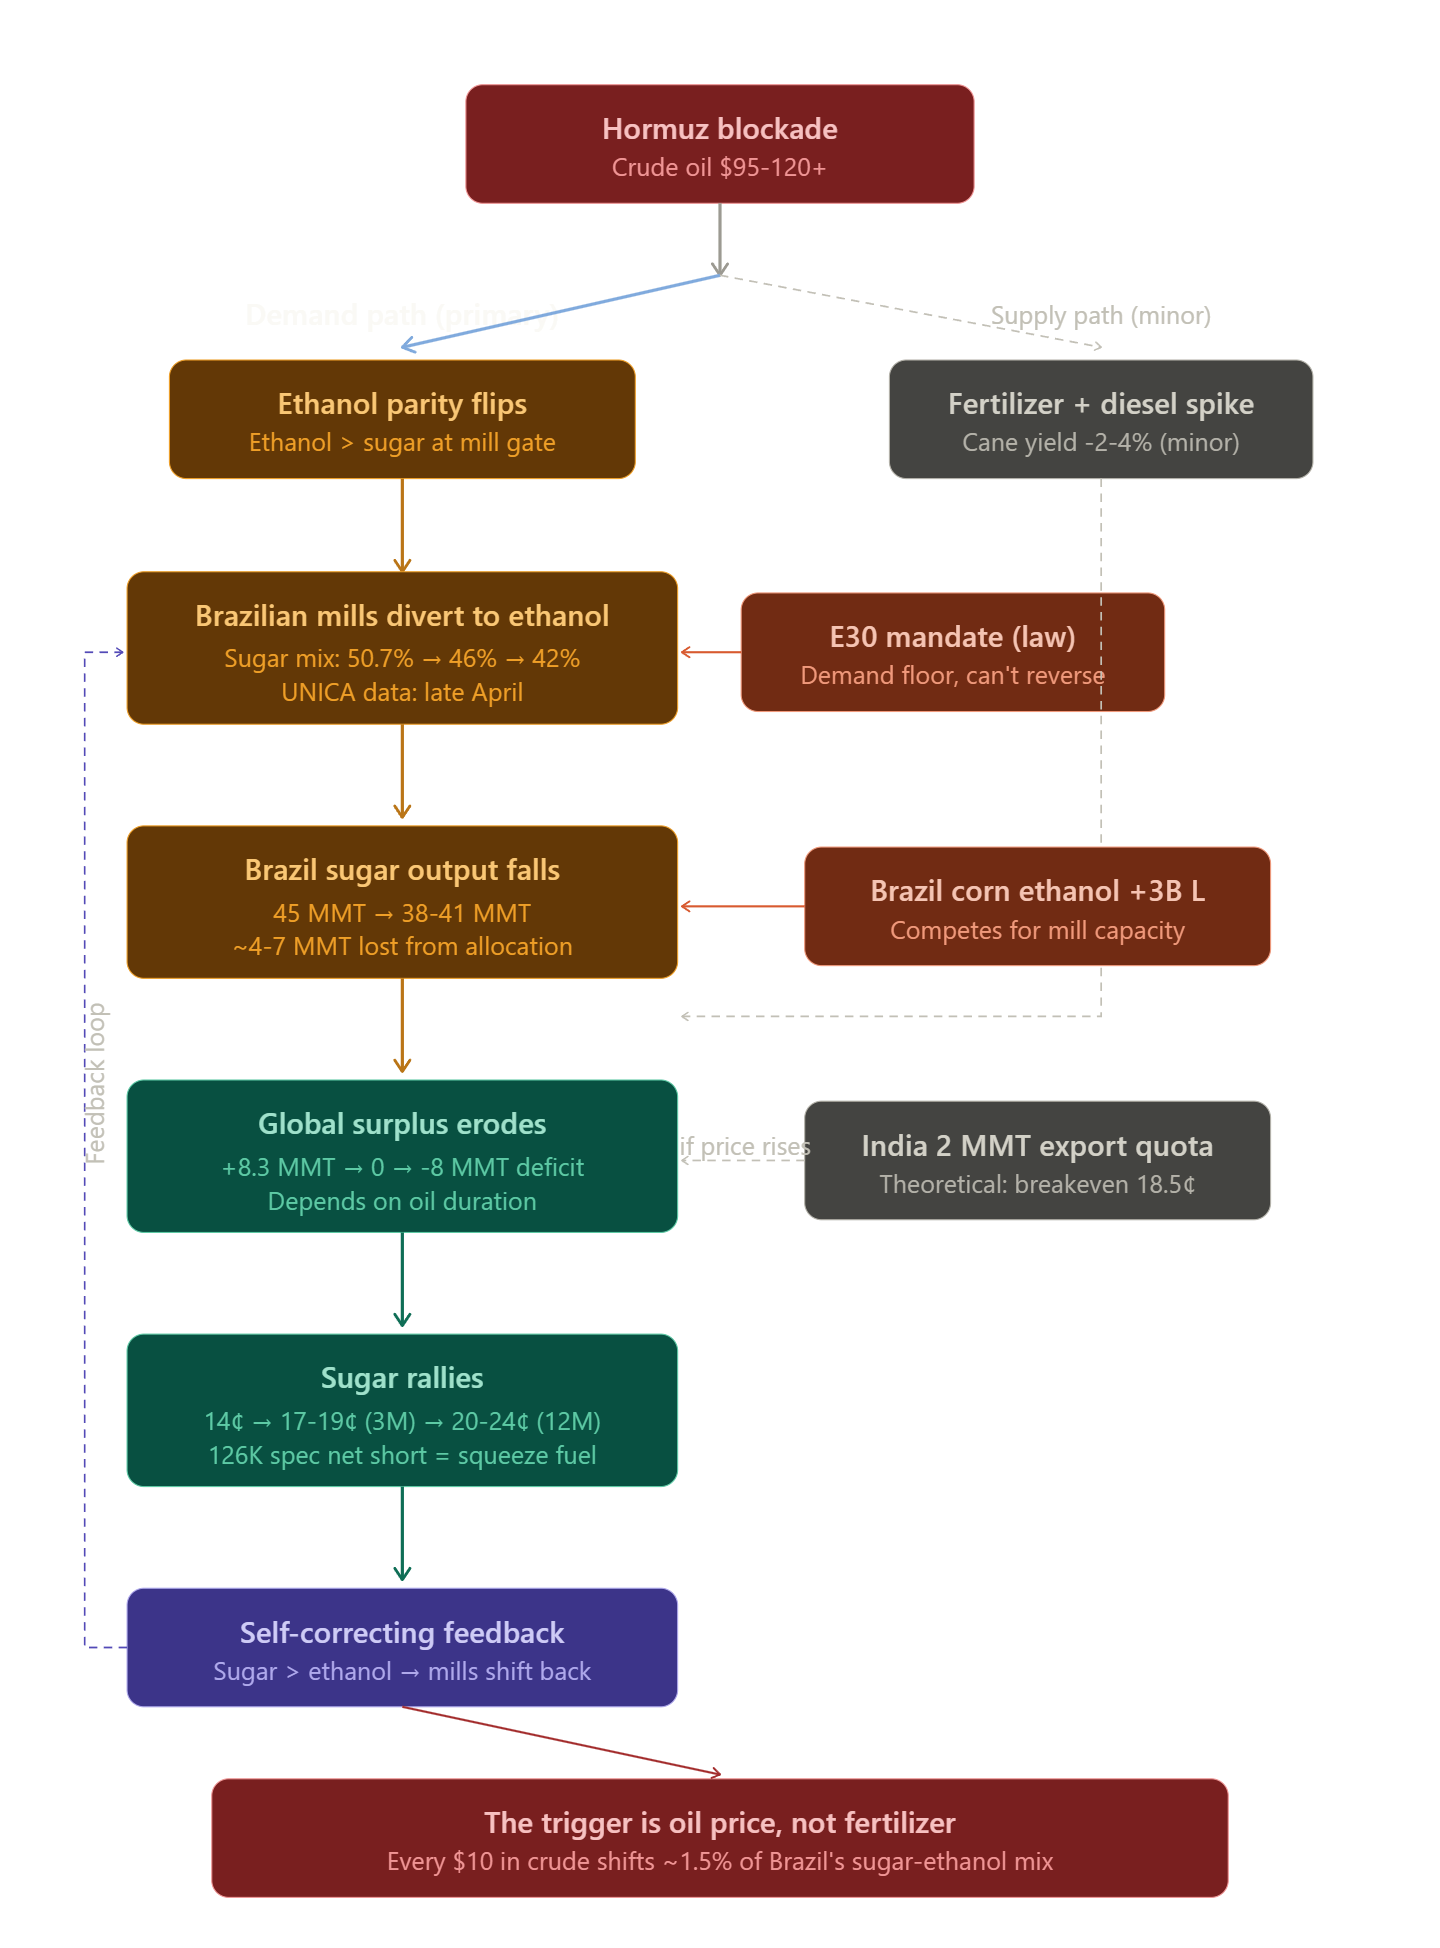
The supply path through fertilizer and diesel barely matters for sugar. Sugarcane is a perennial ratoon crop with lower nitrogen intensity than corn, and Brazilian costs are denominated in reais, which cushions dollar-denominated input spikes. The demand path through crude oil into ethanol economics is 85%+ of the story.
Positioning
This is where the trade got more complicated than I expected.
The legacy COT report shows commercials net long 67k contracts against non-commercials net short 71k. That’s the number everyone cites. The most extreme divergence in 18 years. And it’s real, but it hides the mechanical detail that matters.
Pull up the disaggregated report and the picture sharpens. Swap dealers are net long 157k contracts, near the highest reading since June 2008 (which preceded the 13-to-36-cent rally). They added 8k contracts this week. Still accumulating. Seventeen firms holding $3.5 billion notional of physical hedging demand. These are the intermediaries standing between Coca-Cola, Nestlé, and every food company on earth and the futures market. When a swap dealer is long 157k contracts on the exchange, it means their OTC clients have locked in supply at an unprecedented rate. Physical end users see something.
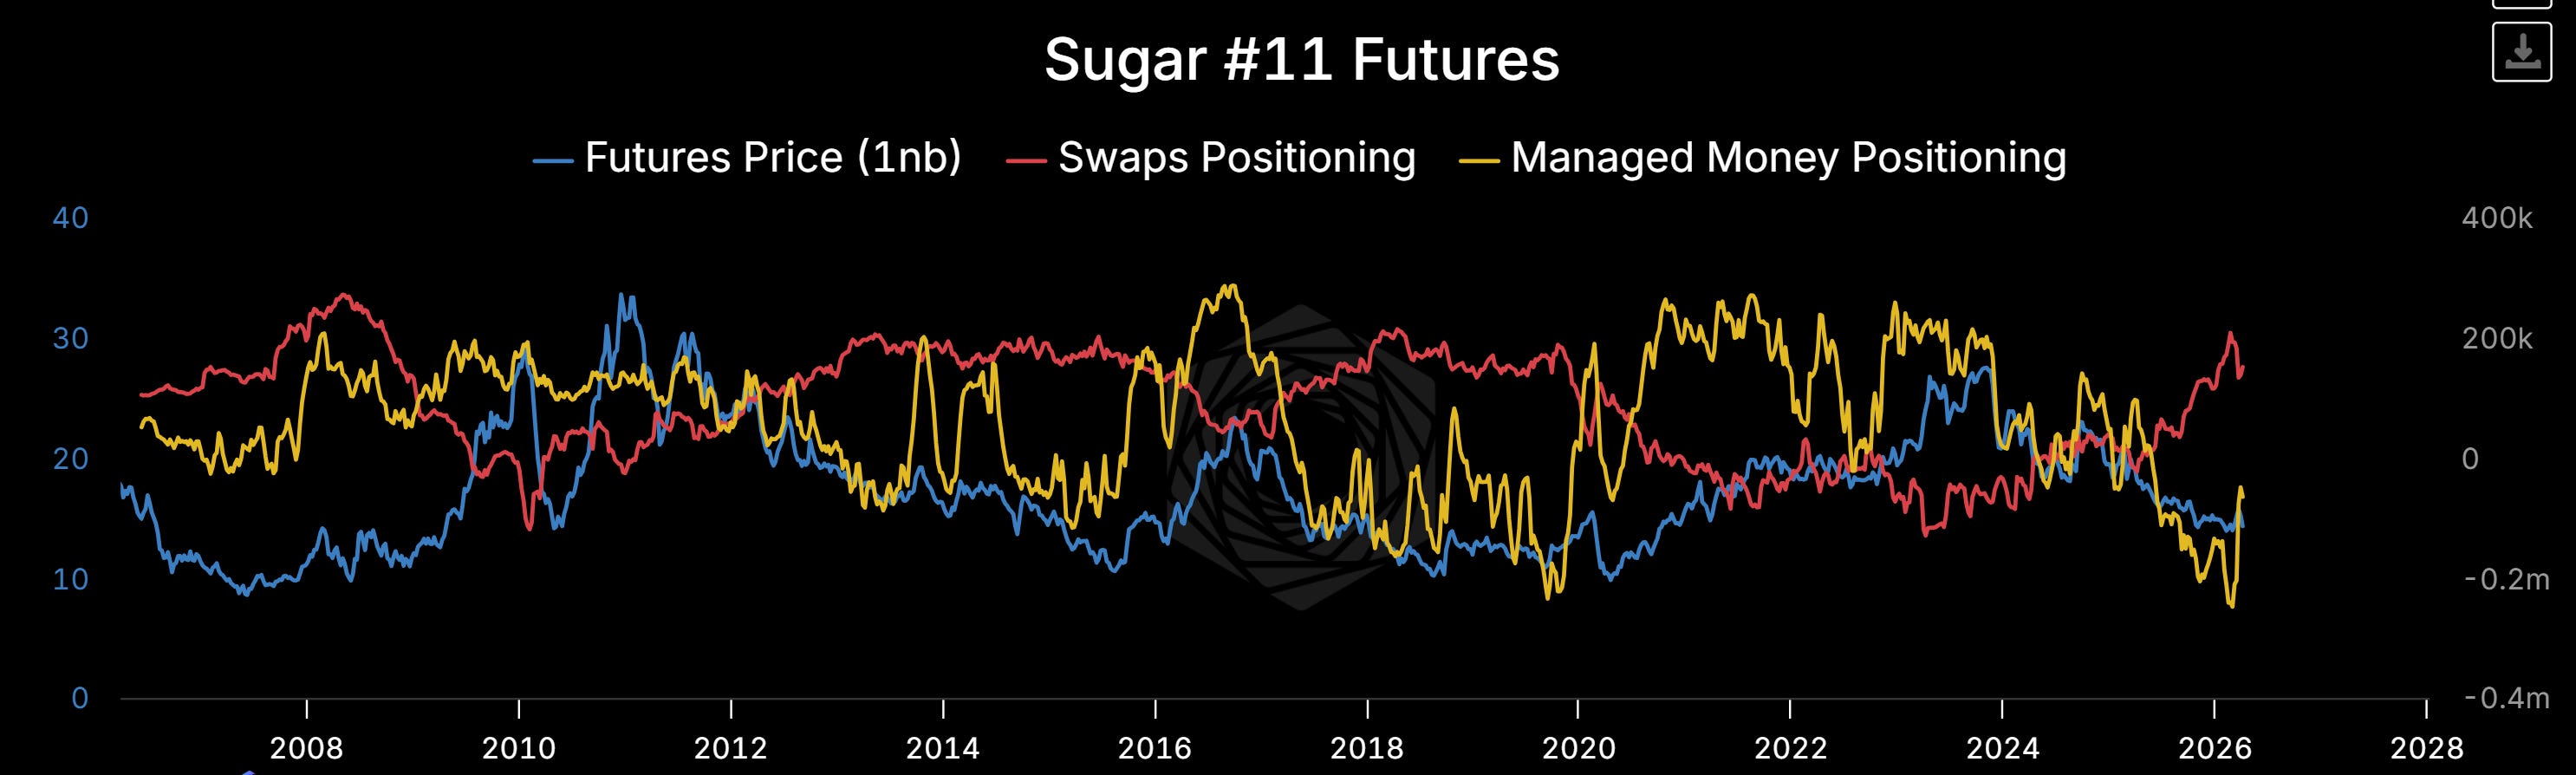
Managed money sits at -56k net short, and they pressed 15k contracts further short this week. They’re actively betting against the physical market. But here’s the update that changed my Bayesian prior on this trade: managed money has already covered a substantial amount of their short position over the past two months. They were likely -150k+ in mid-March based on the CFTC disaggregated data I cross-checked. The move from deep net short to -56k, and price barely twitched. Went from 13.30 to 14.50. The physical surplus absorbed the buying flow. Producers sold into the covering.
So the simple “specs cover and price rips” narrative is weakened. A lot of the covering already happened, and it moved the market one cent. What hasn’t happened is the physical catalyst that removes sugar from the world market. That’s the UNICA allocation data. When managed money’s remaining 56k shorts try to cover into a market where the physical side is bid and the sugar supply is literally becoming ethanol, the absorption capacity of producers disappears. That’s the difference between a one-cent grind and a three-cent snap.
Volatility
ATM implied vol on Jul ‘26 sugar sits at 30.5%. The call skew is steep. The vol surface is pricing the upside tail reasonably but not aggressively.
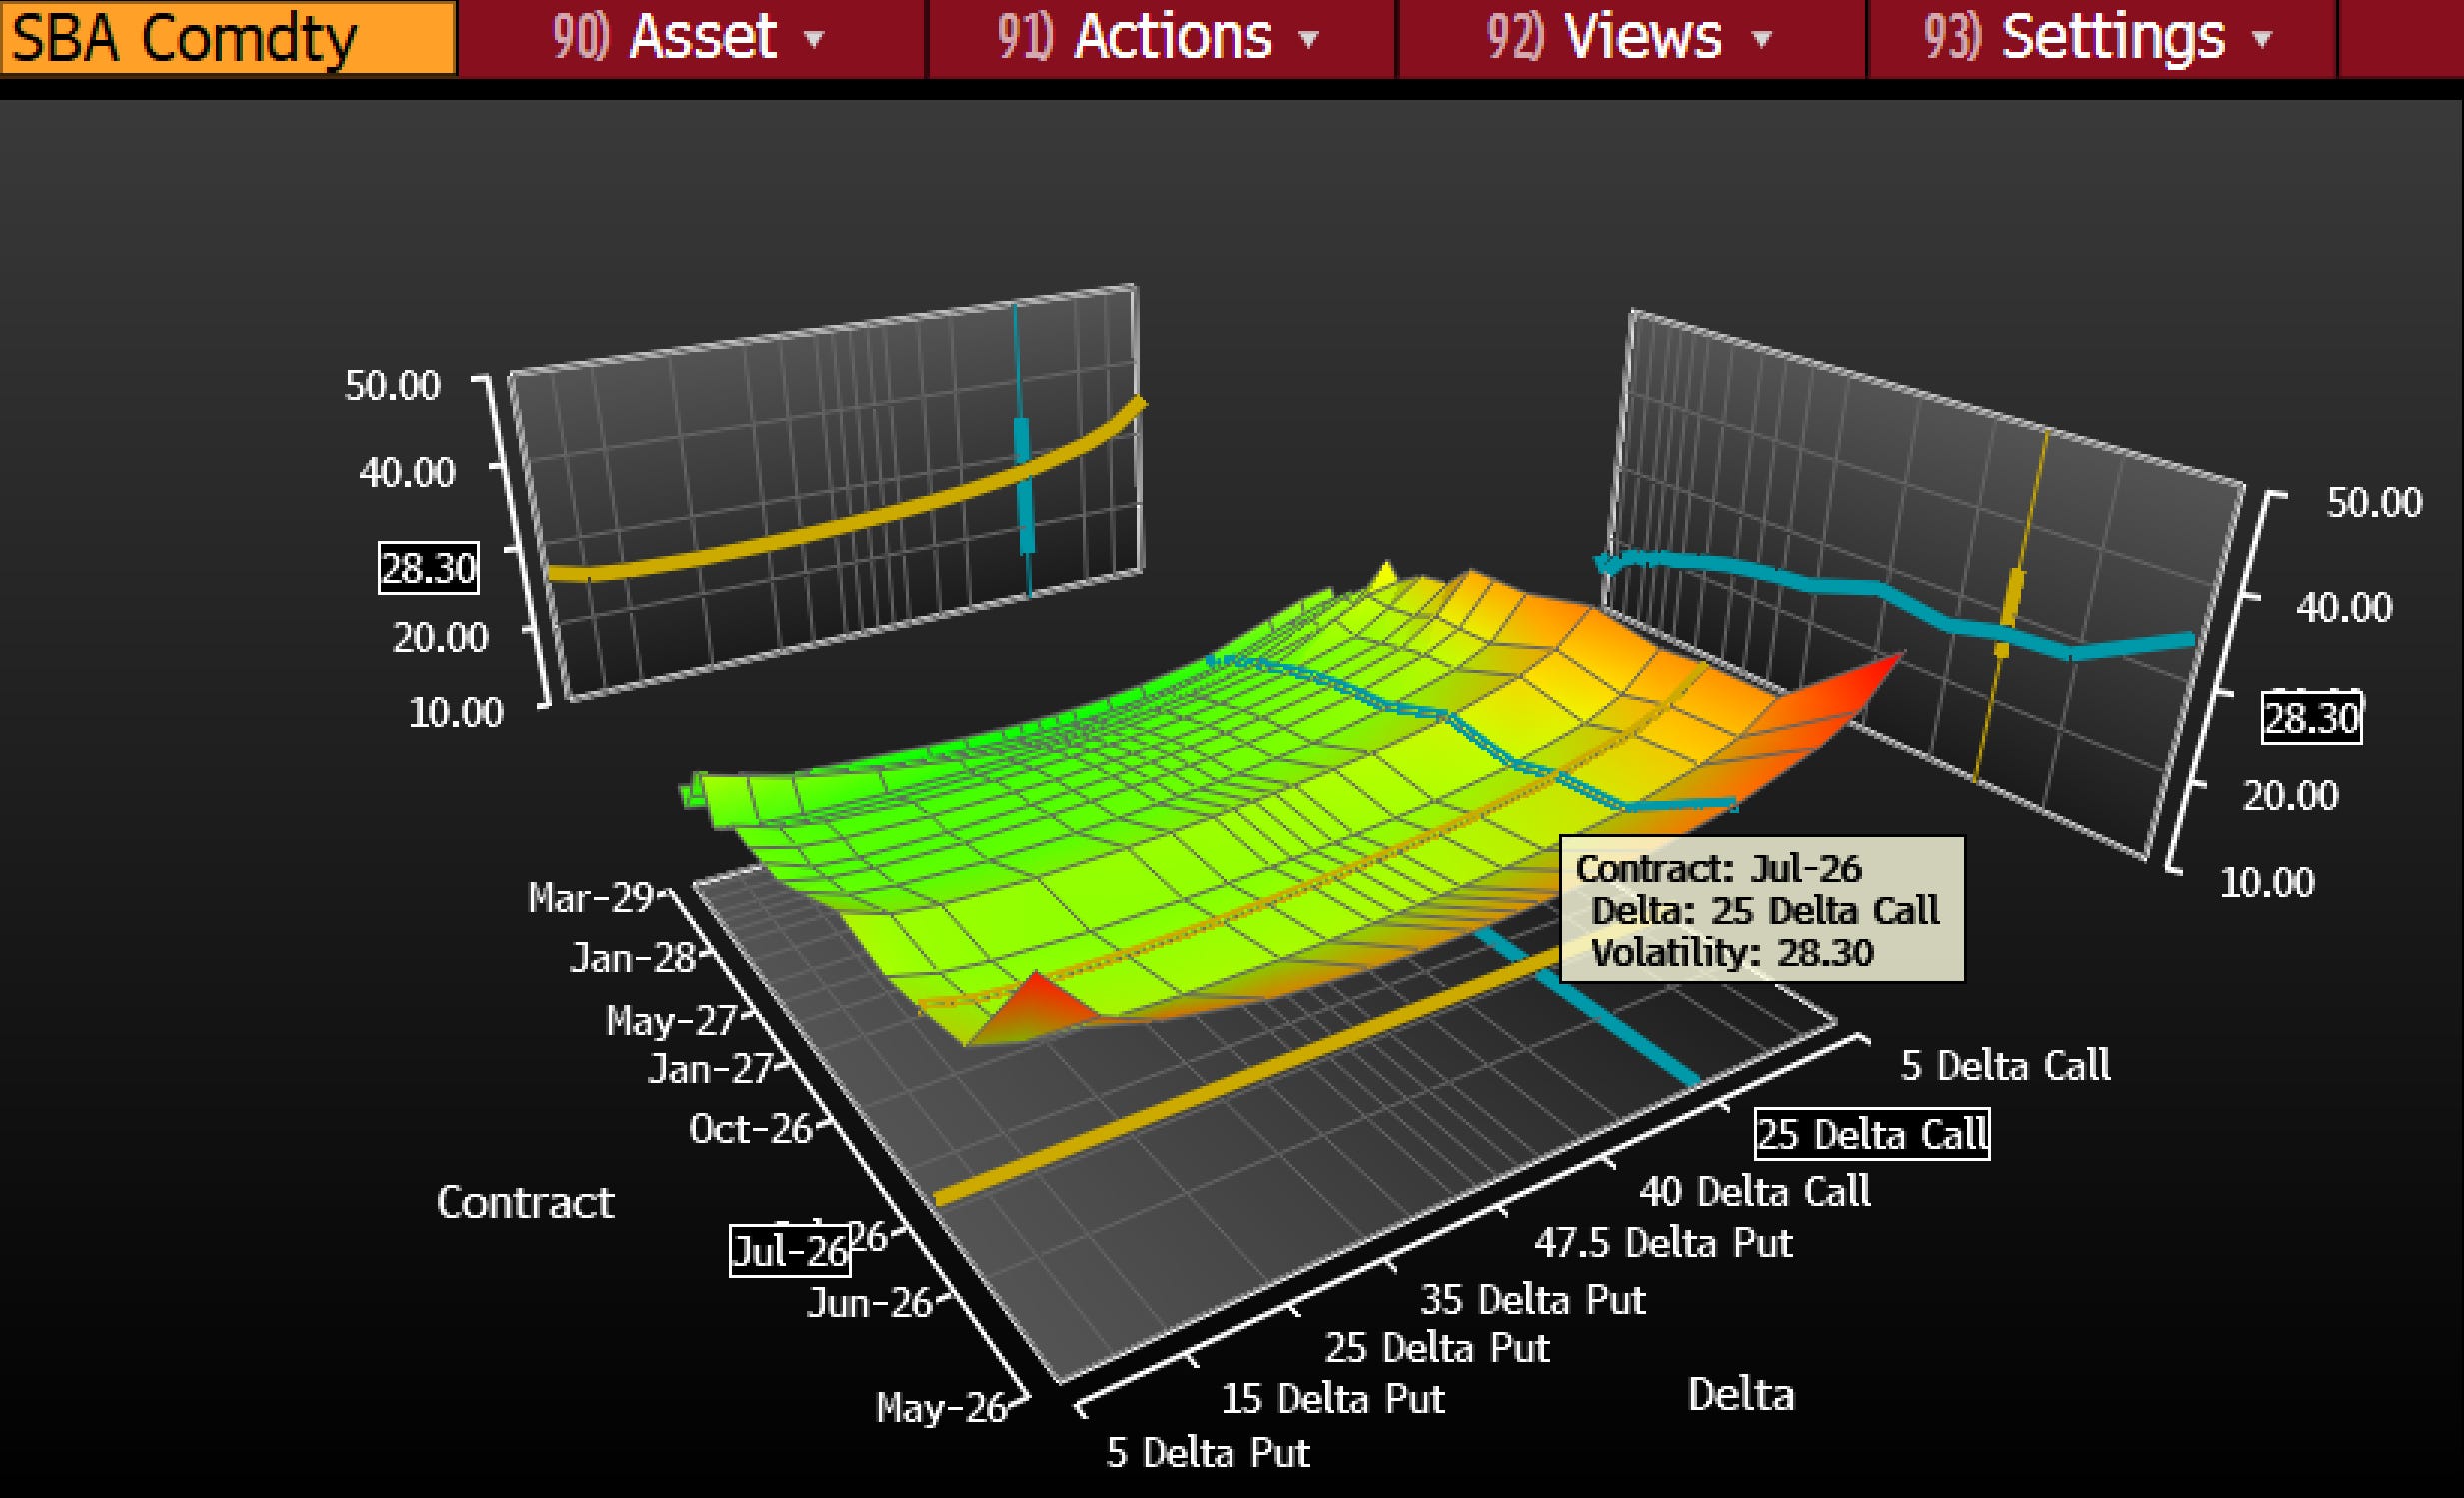
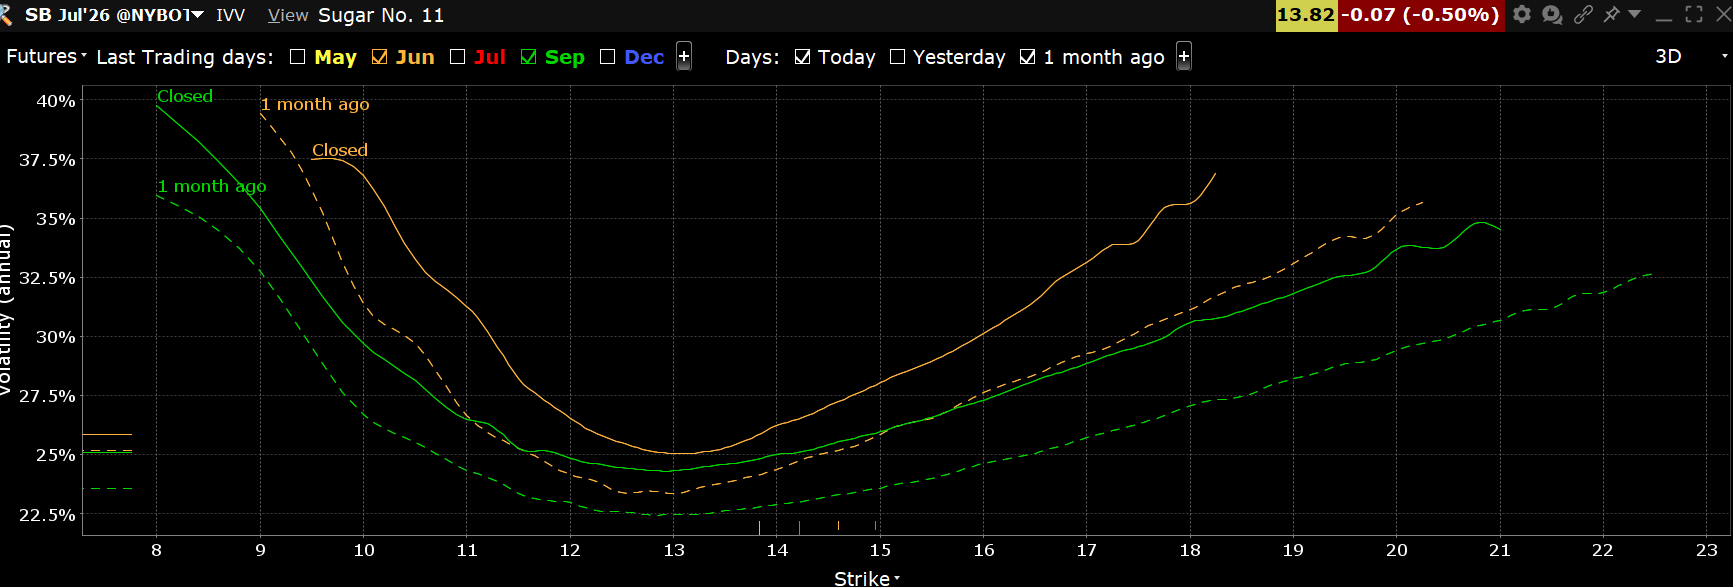
Since 2003, every oil spike has been followed by a sugar rally within 2-6 months. The lag equals the crush calendar. The vol surface doesn’t price this historical pattern because it’s pricing the current surplus, not the conditional path where oil stays elevated through the crush. If Brent holds above $100 through June, realized vol on sugar will exceed current implied.
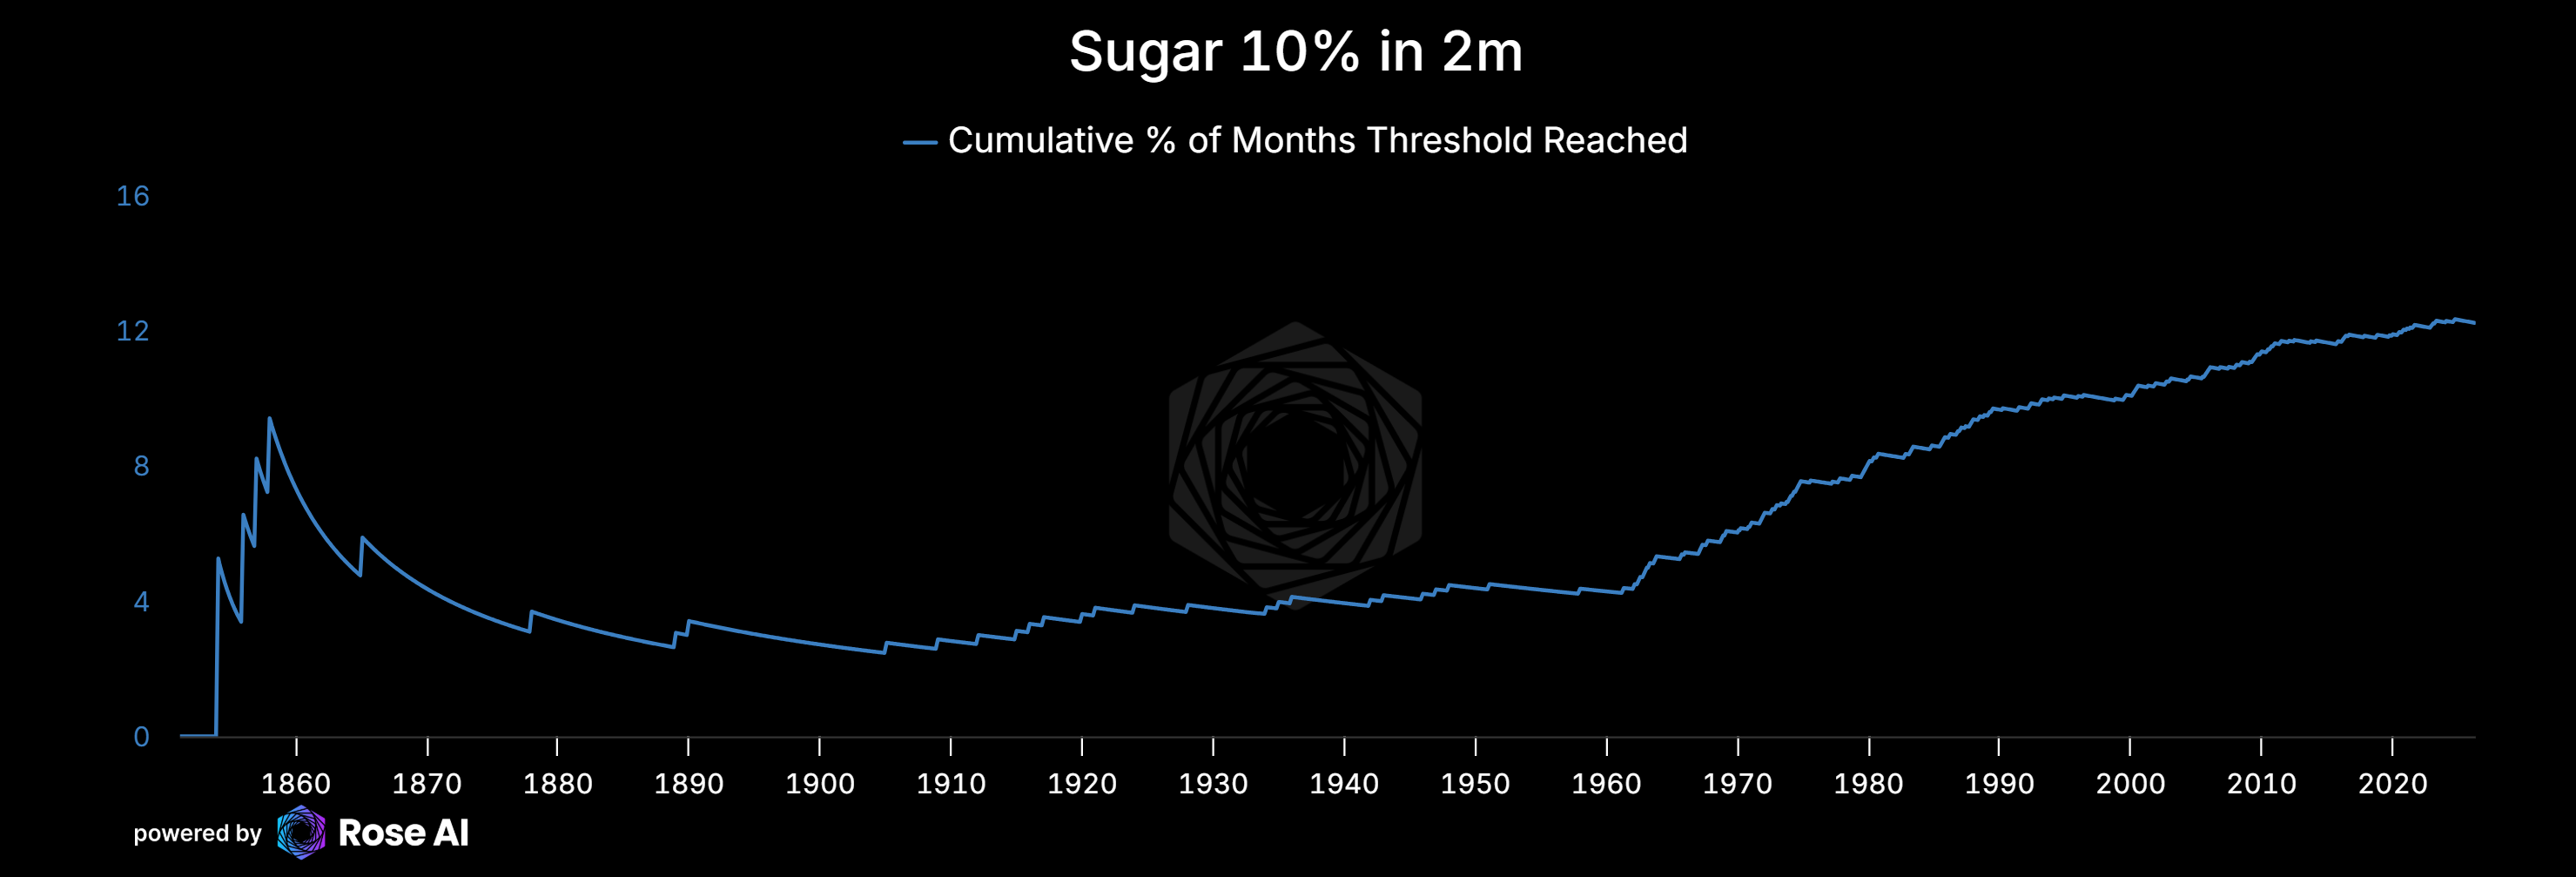
In order to pick our strikes, and size our confidence. We took the liberty of pulling out our secular timeseries of sugar prices to do a little math here. Over 160 years of sugar price data, a 10% rally within any two-month window has occurred roughly 12% of the time. That 12% is unconditional. It includes decades of quiet markets with no catalyst. Conditional on the current setup (oil above $100, crush underway, positioning at 18-year extremes), the historical analogs compress to a handful of episodes and the hit rate is closer to 80%. The vol surface at 30.5% ATM is pricing a 15-18% probability of that move. The conditional rate says much higher.
The trade
We remain long sugar call spreads, Jun ‘26 expiry. Max gain per contract/spread is approximately $1,454 per spread, max loss $213. That’s a 6.8:1 payoff ratio at expiry which becomes 3:1 pretty quickly. We will roll them once the price starts moving and we get to the middle of the spread, since this is a relatively short term option. Size to your preference.
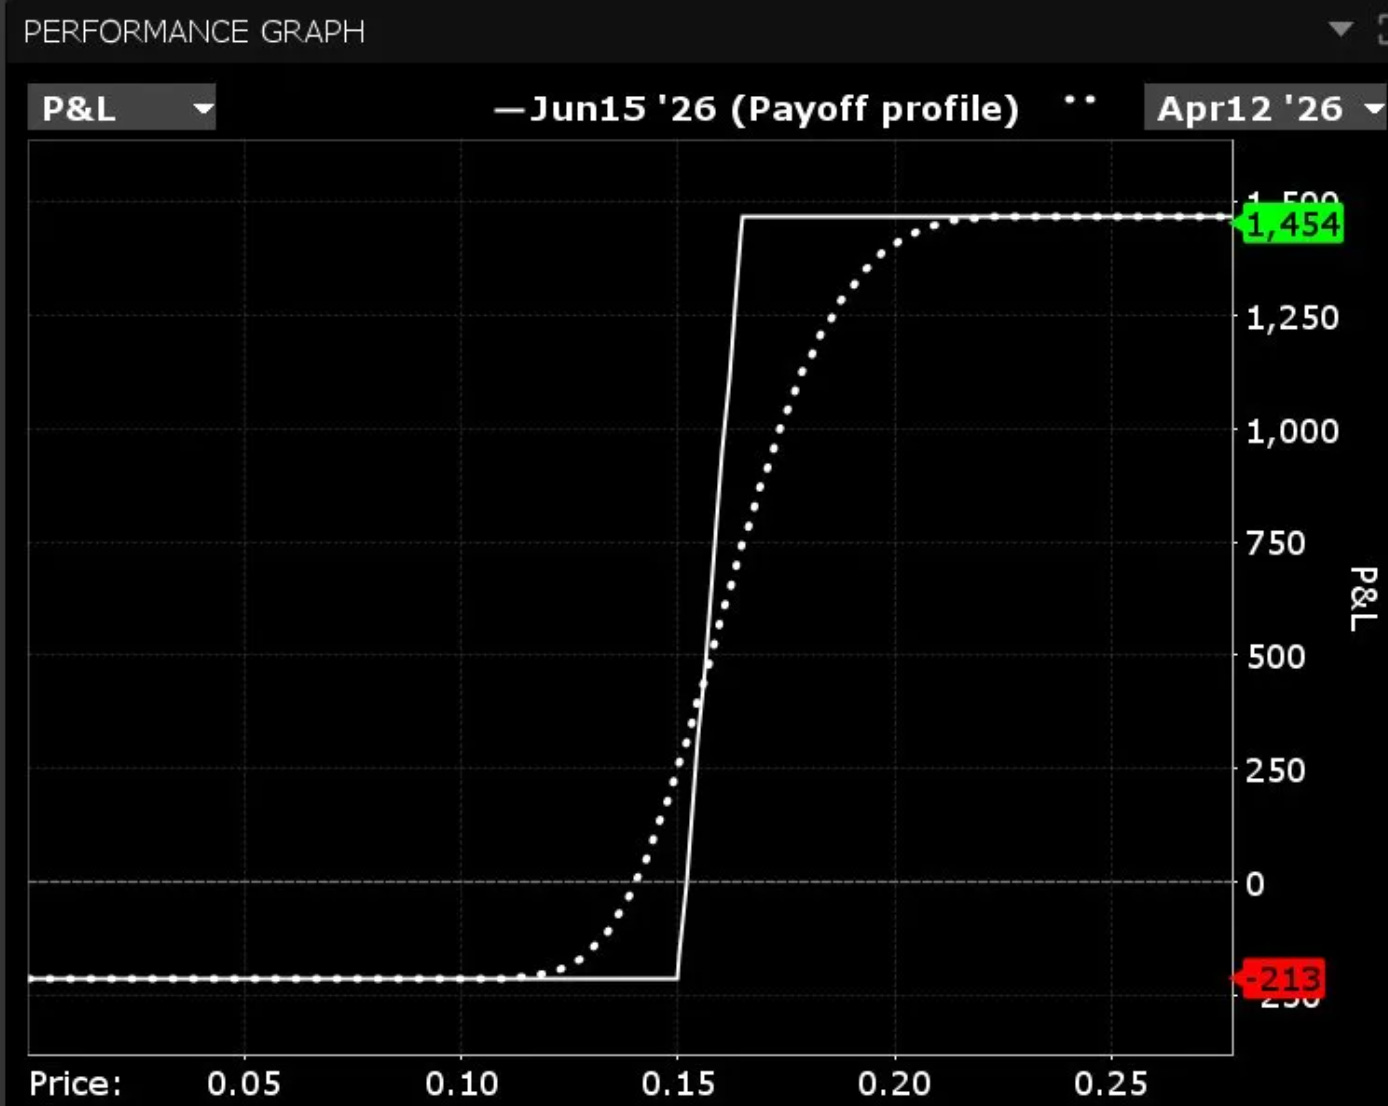
The defined-risk structure is deliberate. This trade needs the physical catalyst (UNICA allocation confirmation) to work, and we don’t know when or whether it arrives. If crude drops back to $80 on a ceasefire and UNICA shows 50%+ to sugar, these likely expire worthless. That’s the $213 per contract outcome. If the three-month scenario plays out, the spread captures the bulk of the move. The June expiry gives us the first two months of UNICA data plus the peak crush volume window.
Sizing: this is a 1-2% of book position. The conviction is high on the mechanism but uncertain on timing. The call spread structure means maximum loss is known and bounded. If the first UNICA reports confirm the allocation shift, I’ll add.
What to watch
Late April: First UNICA fortnightly crush data with real volume. This is Gate 1. If the opening allocation reads below 49% to sugar, the surplus narrative starts cracking. The data publishes on UNICA’s website, typically the second and fourth weeks of the month during crush season.
Crude oil price. This is the direct input. Not fertilizer, not weather, not acreage. If Brent falls below $90, the ethanol parity math flips back toward sugar and the thesis weakens. If Brent stays $100+, the allocation shift accelerates with every fortnightly report.
June-August UNICA reports. The crush peaks in these months. The cumulative allocation math becomes undeniable by the third or fourth report. This is where the surplus erosion chart (four scenario lines above) diverges meaningfully.
Managed money short covering pace. Track the weekly COT. The -56k is fuel. When it starts burning, price will move faster than the one-cent grind we saw from March covering. The difference is whether producers have physical sugar to sell into the bid. If UNICA confirms the ethanol diversion, they don’t.
Brazil corn ethanol capacity. The one structural risk to the thesis. Rabobank flagged 3+ billion liters of new corn ethanol capacity in 2026. If corn-based ethanol absorbs the E30 mandate increase without needing cane ethanol to flex, mills can keep 50%+ to sugar even with high oil. Check the Rabobank estimate against actual capacity additions.
Historical context
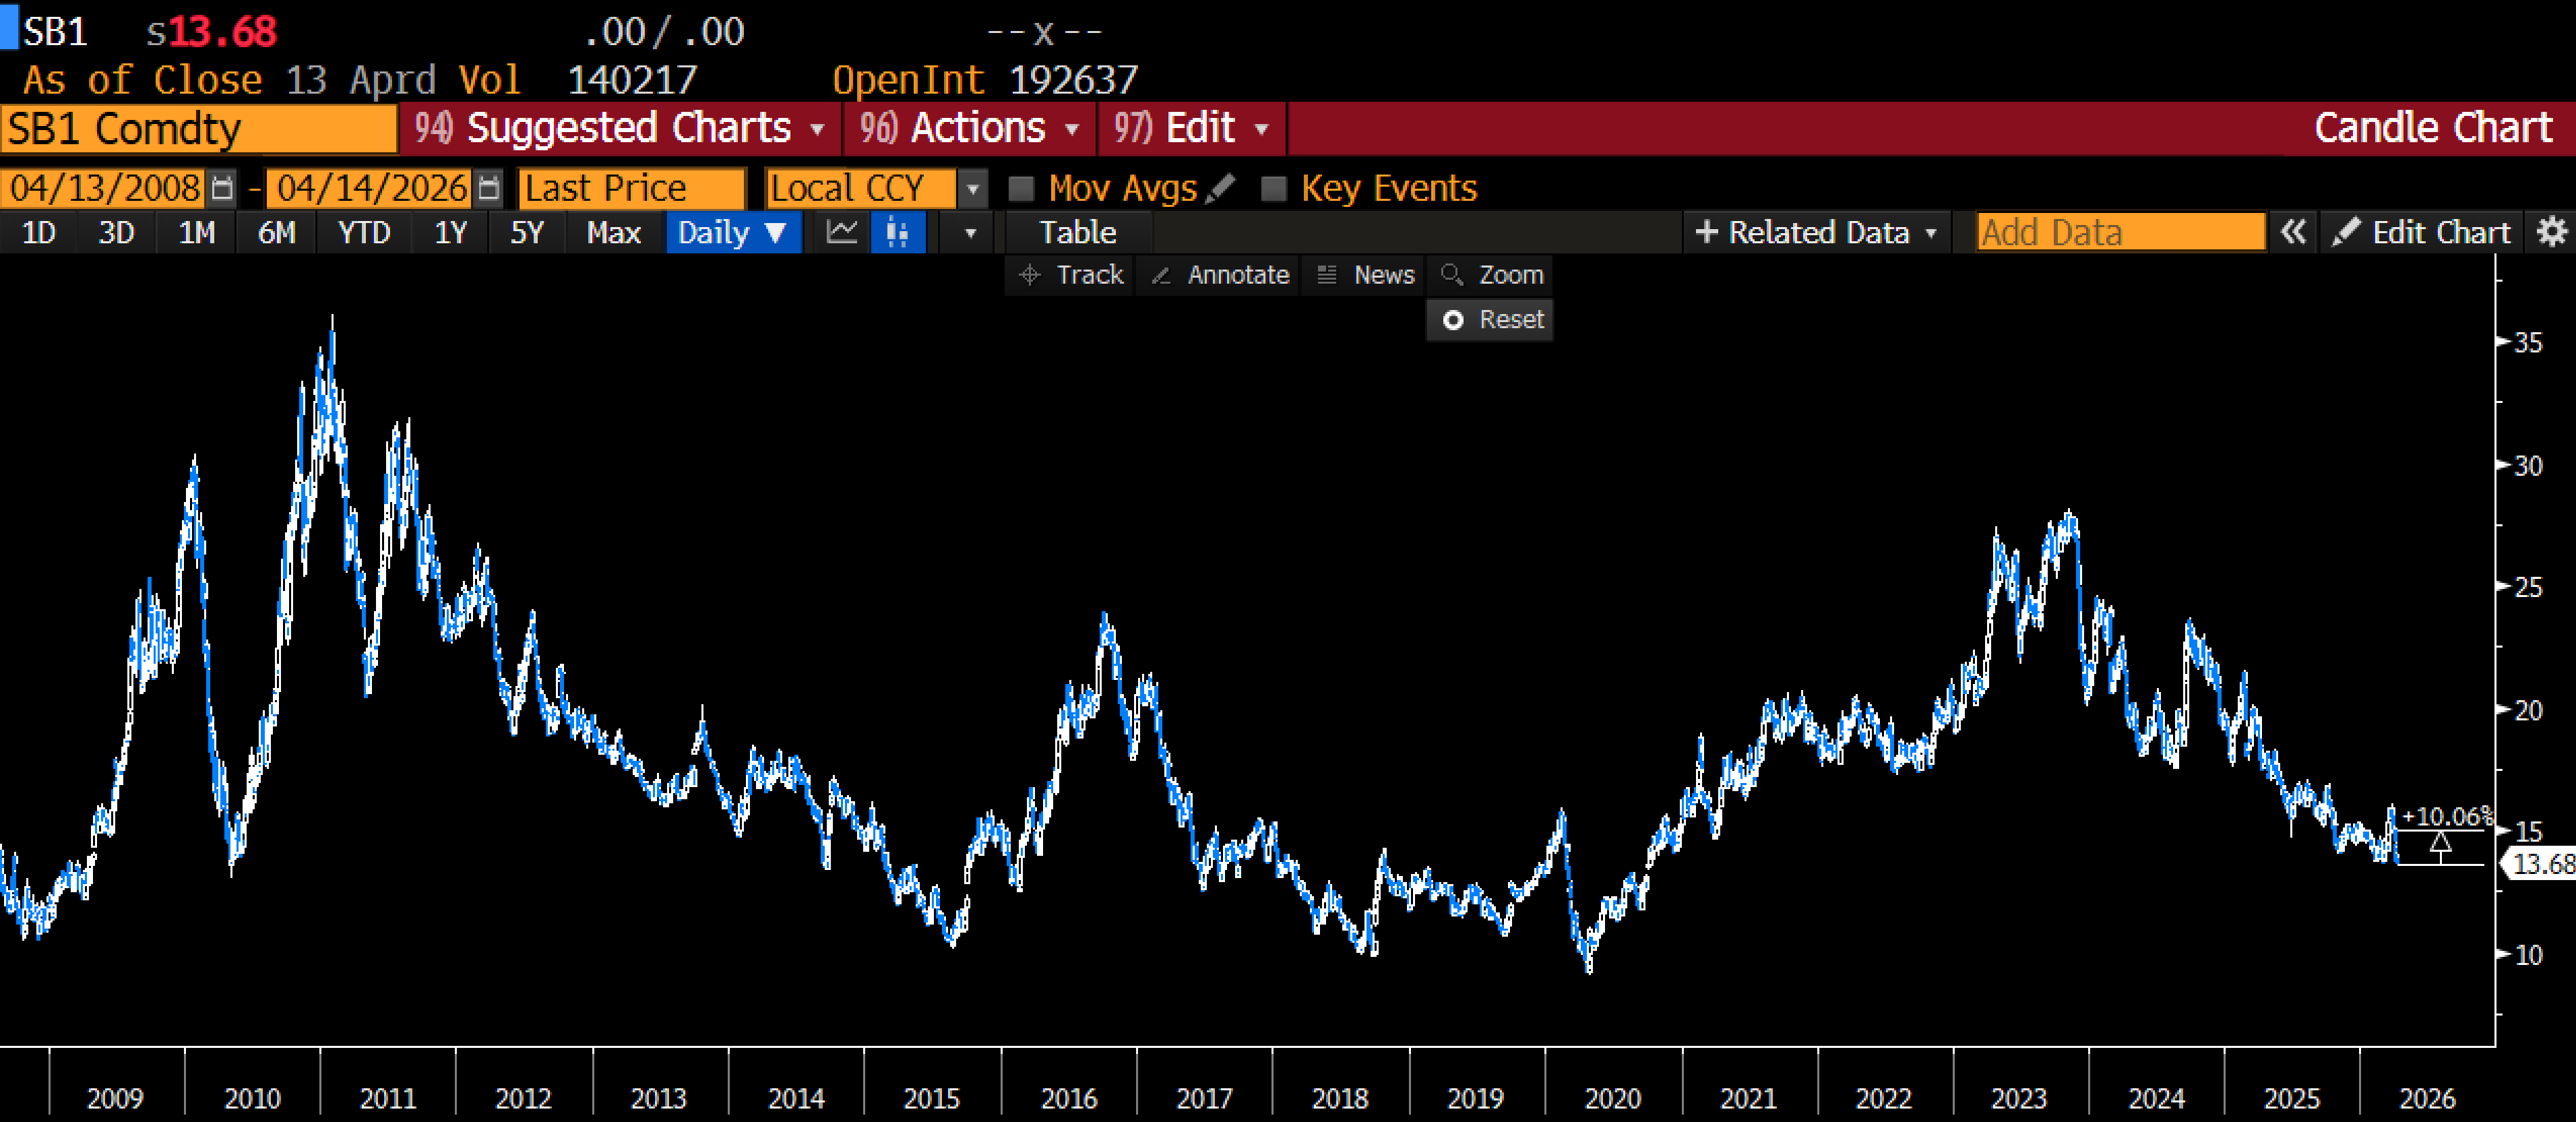
Six sugar squeezes since 1963. Every one shared three ingredients: a supply disruption or deficit, a positioning extreme, and a catalyst that forced shorts to cover before new supply could arrive. The current setup has two of three confirmed. The positioning is still extended. The catalyst (Hormuz into oil into ethanol) is live and observable. The confirmed deficit is what’s missing. UNICA data over the next eight weeks determines whether the third ingredient arrives.
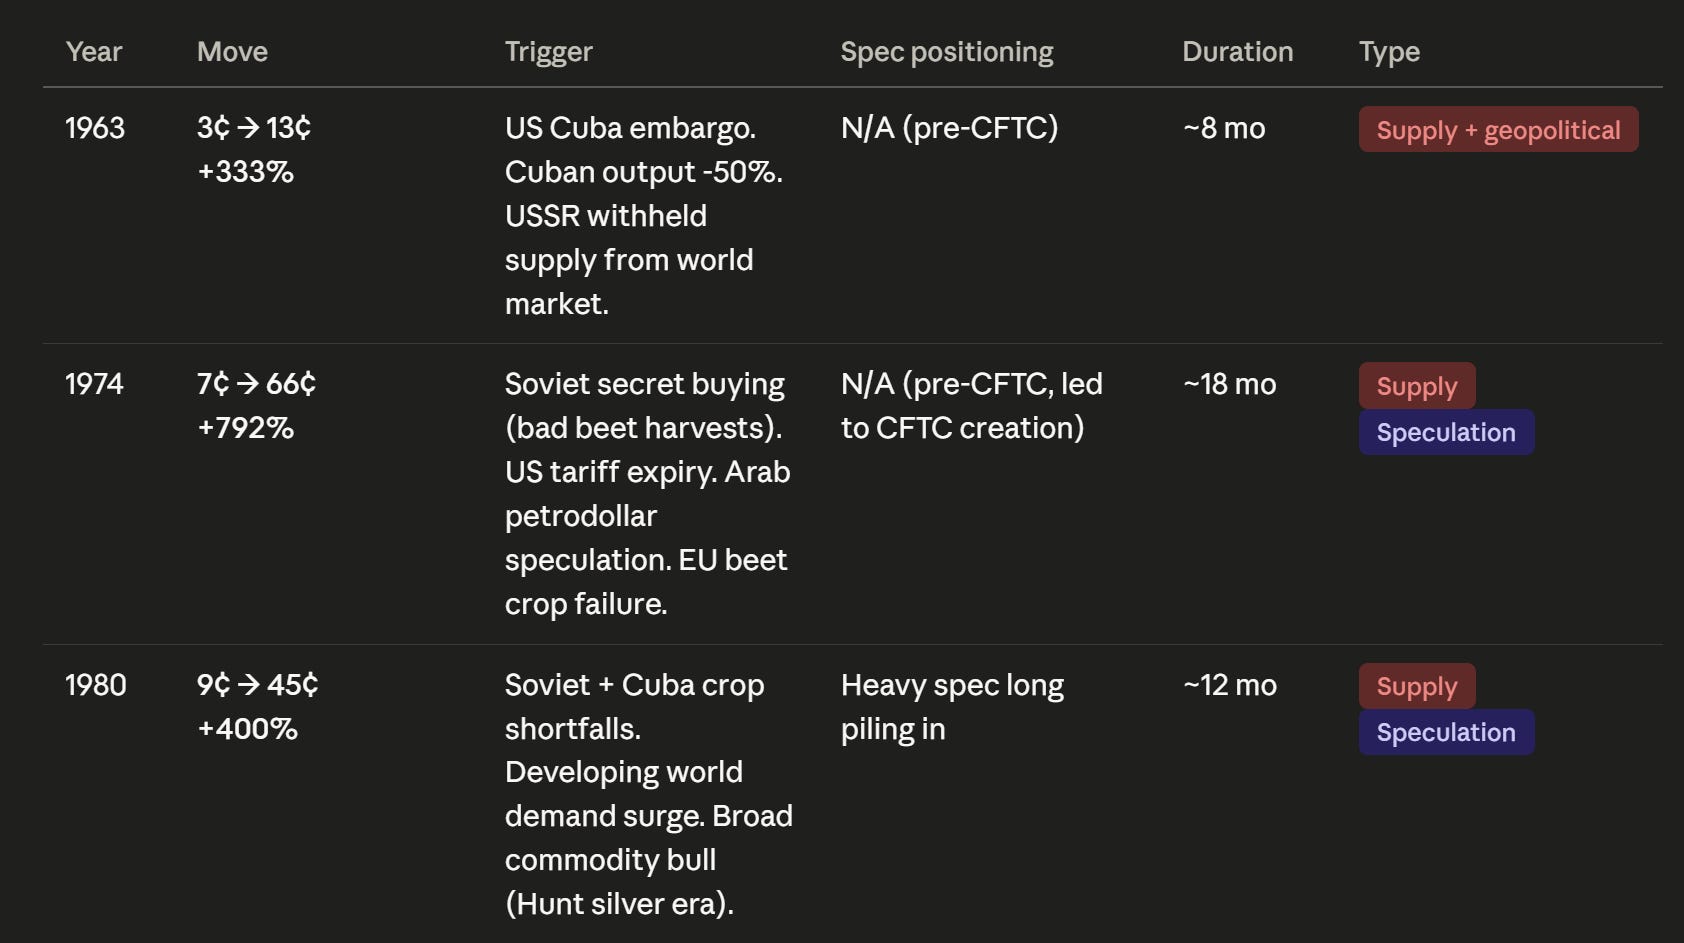
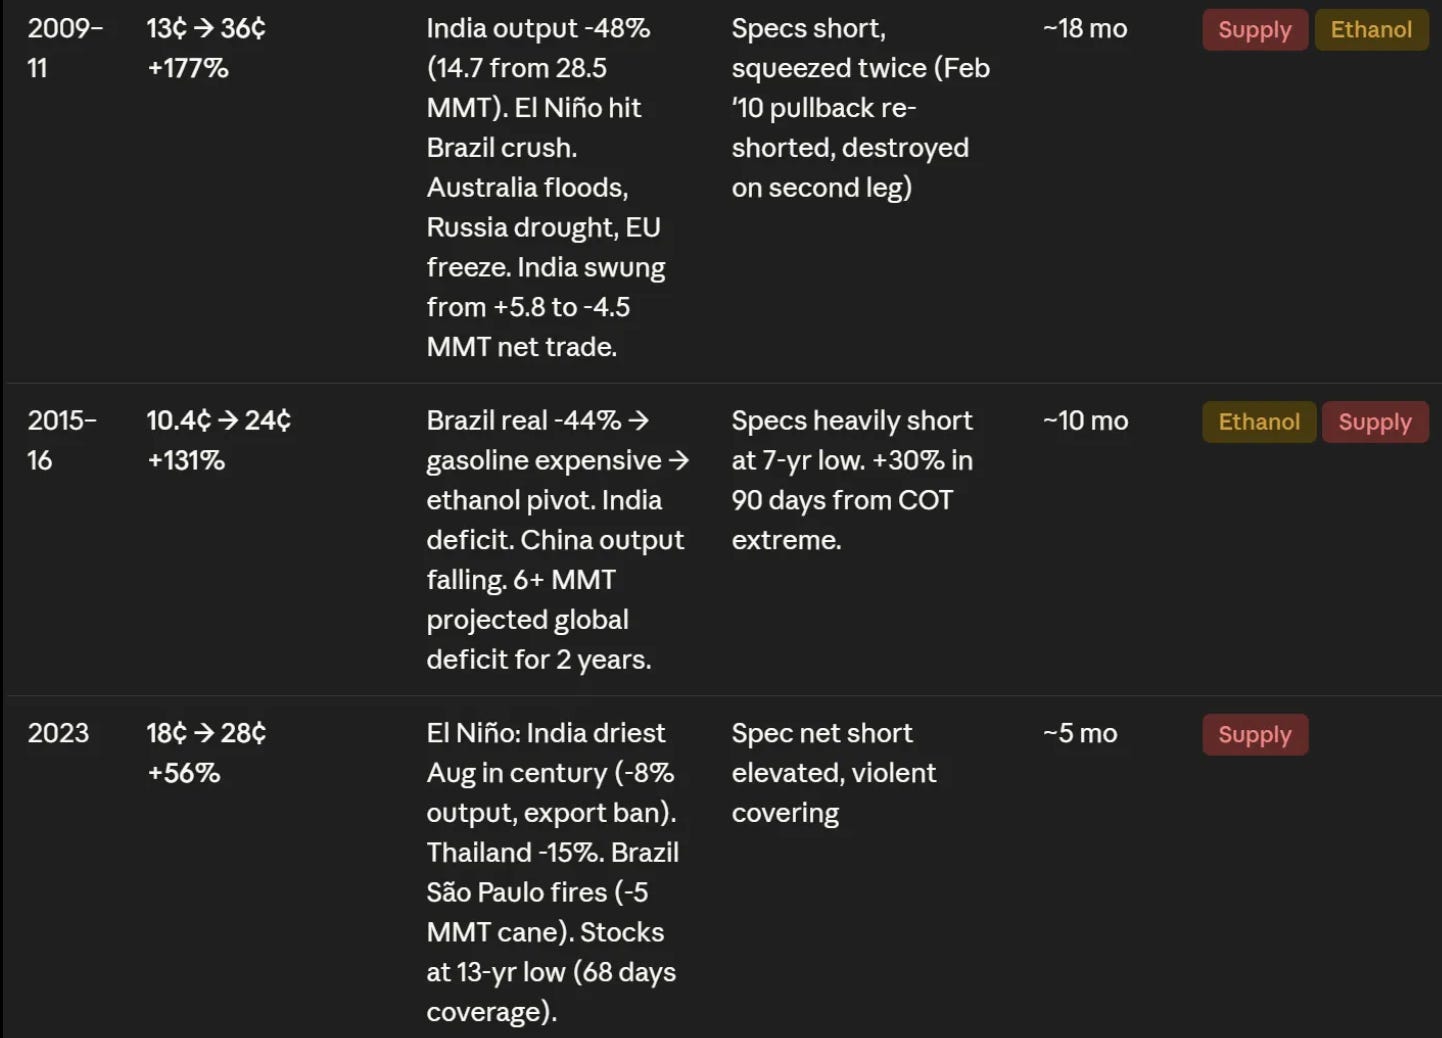
The base rate from COT extremes of this severity: +20-30% within 90 days, in every case. The risk is that this time the surplus really is large enough to absorb the ethanol diversion without flipping to deficit, which would make the move a positioning-driven 14-to-17 trade rather than a fundamental 14-to-22 trade. Both are profitable on our structure. The question is whether we add.
Wheat: The Demand Cascade
Wheat is the opposite setup from corn. As we’ll see, corn is supply destruction through the fertilizer gate. Wheat is demand explosion with supply already damaged.
The crop was broken before a single ship was blocked.
Winter wheat opened the season at 35% good-to-excellent. Worst since 2022. Oklahoma is 54% poor-to-very-poor. Texas 51%. Total planted acres are the smallest since 1919. That’s a lot. One hundred and seven years. The crop was stressed by drought through the Southern Plains growing season, and the acreage just isn’t there because wheat economics have been terrible for years. Farmers have been rotating out steadily.
Hormuz adds the demand side on top.
Mid East food security buying is a political imperative, not a discretionary purchase. Egypt, Algeria, Iraq don’t cut wheat imports because prices rose 20%. They panic-buy. Bread prices in Cairo and Algiers are a pillar that keeps the regime standing. The Arab Spring started with bread. Every MENA procurement officer knows this. When the strait closed, the first thing they did was to pull forward six months of tenders.
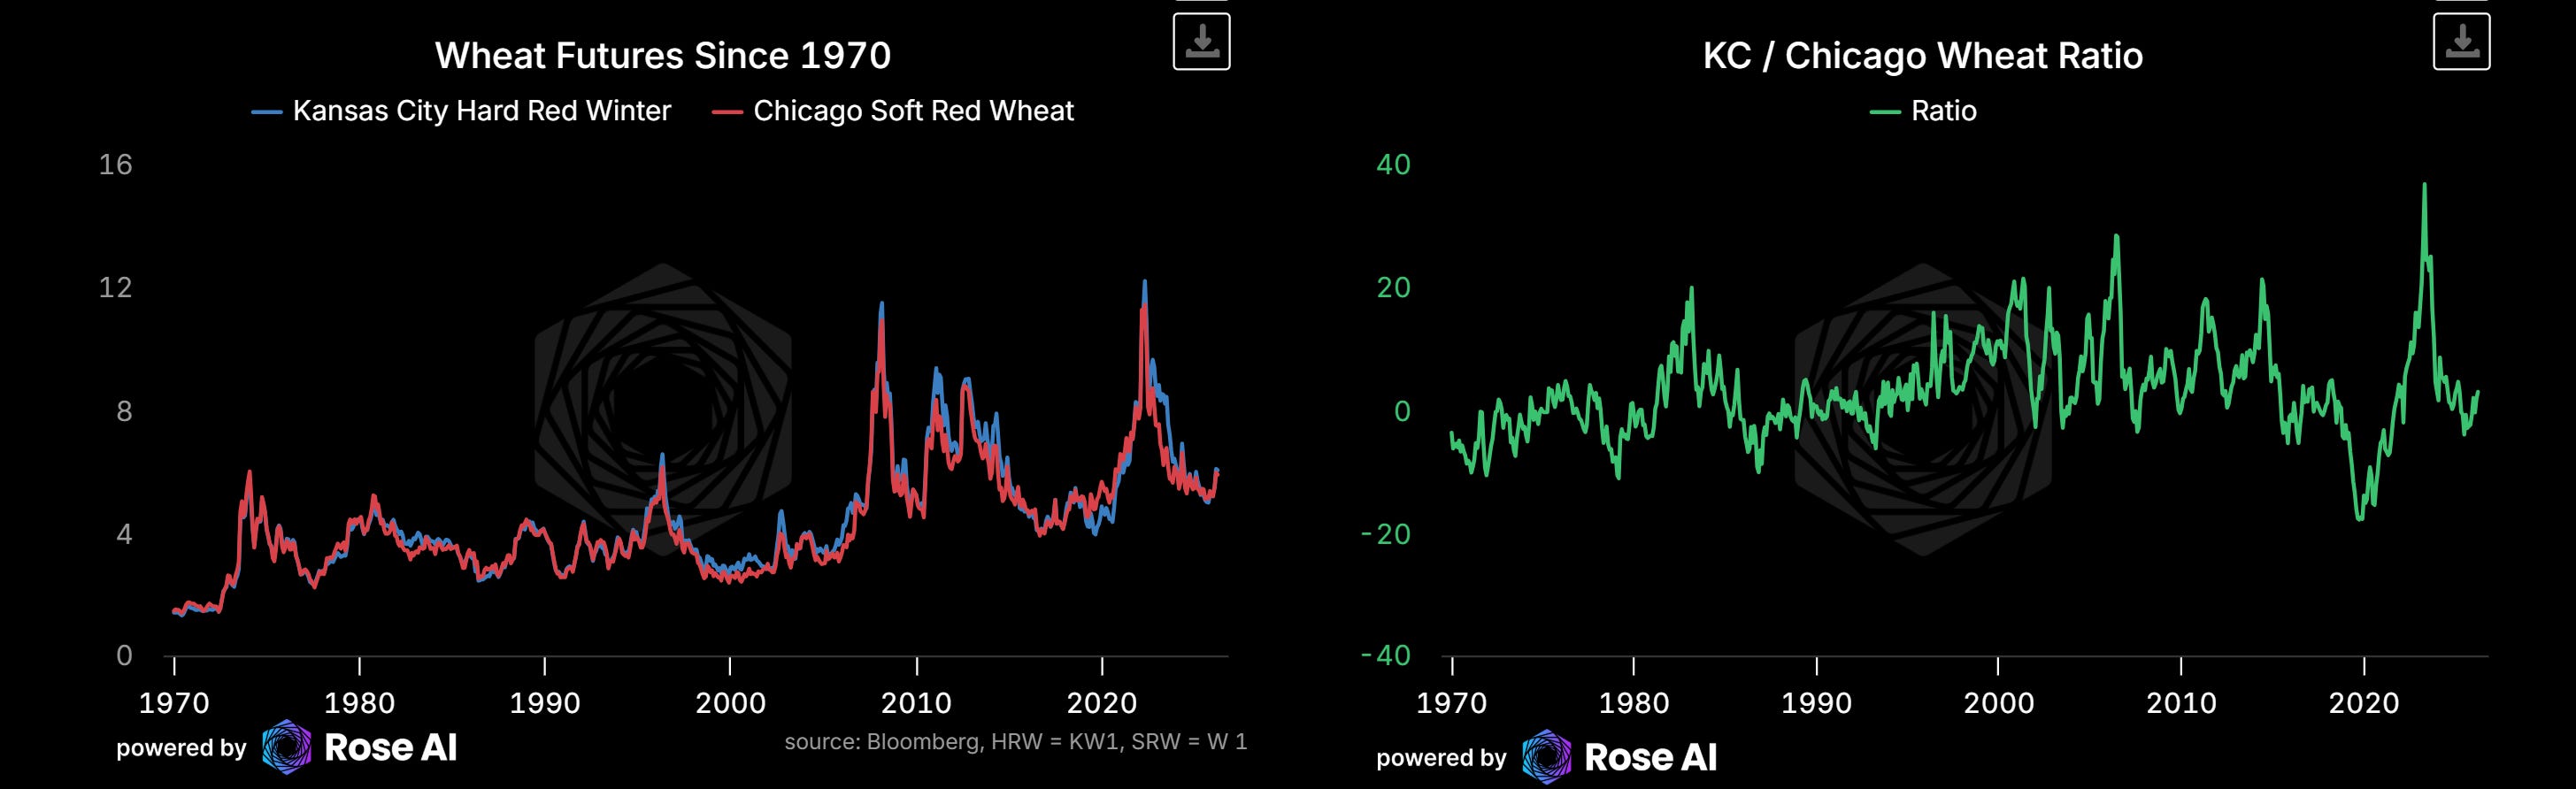
The KC-Chi spread is an interesting real-time monitor. KC is hard red winter — protein wheat, what you bake bread with. Chicago SRW is feed wheat. When MENA bids, they bid KC, not Chicago. The spread widens. Right now it’s about 35 cents, which is where it sits in quiet markets. In 2022 during the Ukraine spike, the ratio hit 35-40% premium. In 2007-08 it was 15-20%. We’re at 5-10% today. The MENA protein bid has barely started showing up.
As long as the spread is widening, the bid is accelerating. If it compresses, the panic is fading. One number to watch. Could be a nice way to play this, come to think of it.
The balance sheet
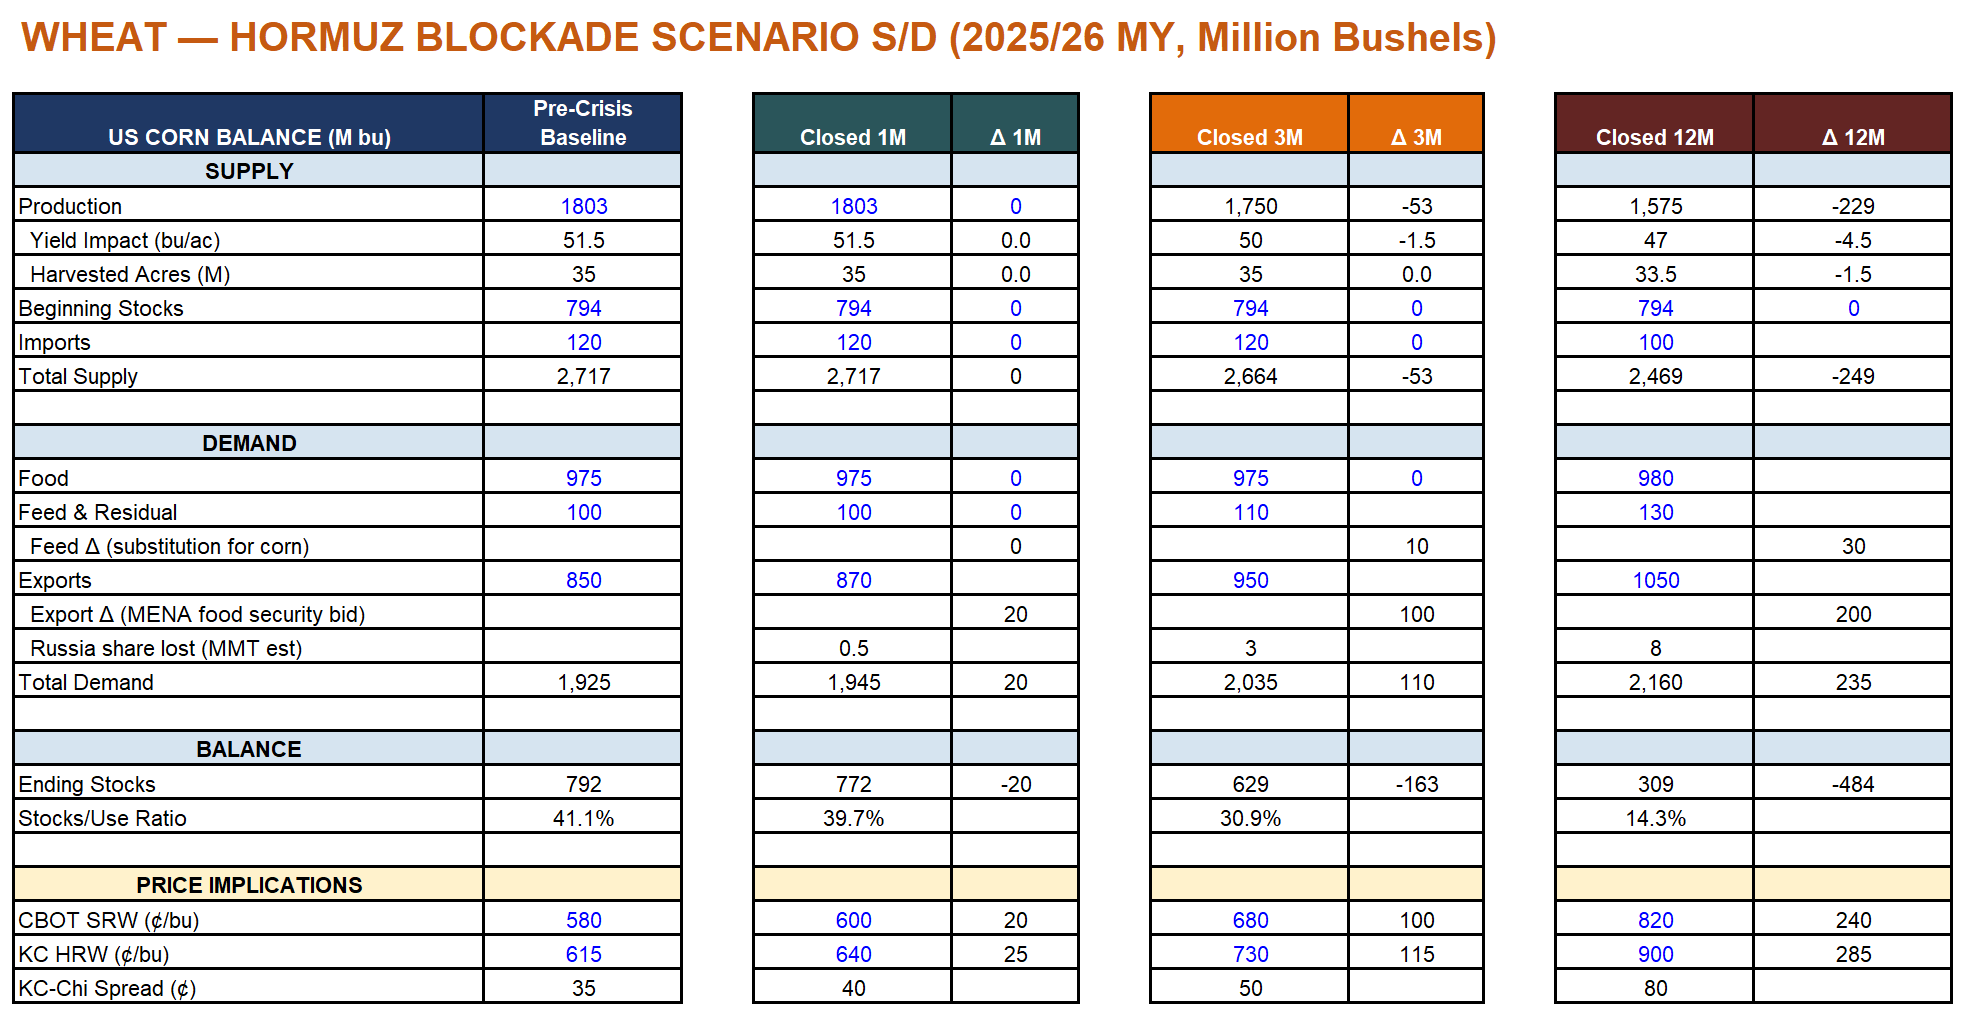
Baseline (pre-crisis). Production 1,803 million bushels at 51.5 bu/ac on 35 million harvested acres. Beginning stocks 794M. Ending stocks 792M at 41.1% stocks-to-use. Imports 120M. Exports 850M. Feed and residual 100M. The balance sheet looks comfortable at first glance. 41% stocks-to-use is a lot of wheat. But that comfort is deceptive because the demand side can move faster than the supply side can respond. Winter wheat is in the ground. Spring wheat is planted. You can’t grow more acres in July because Egypt is buying.
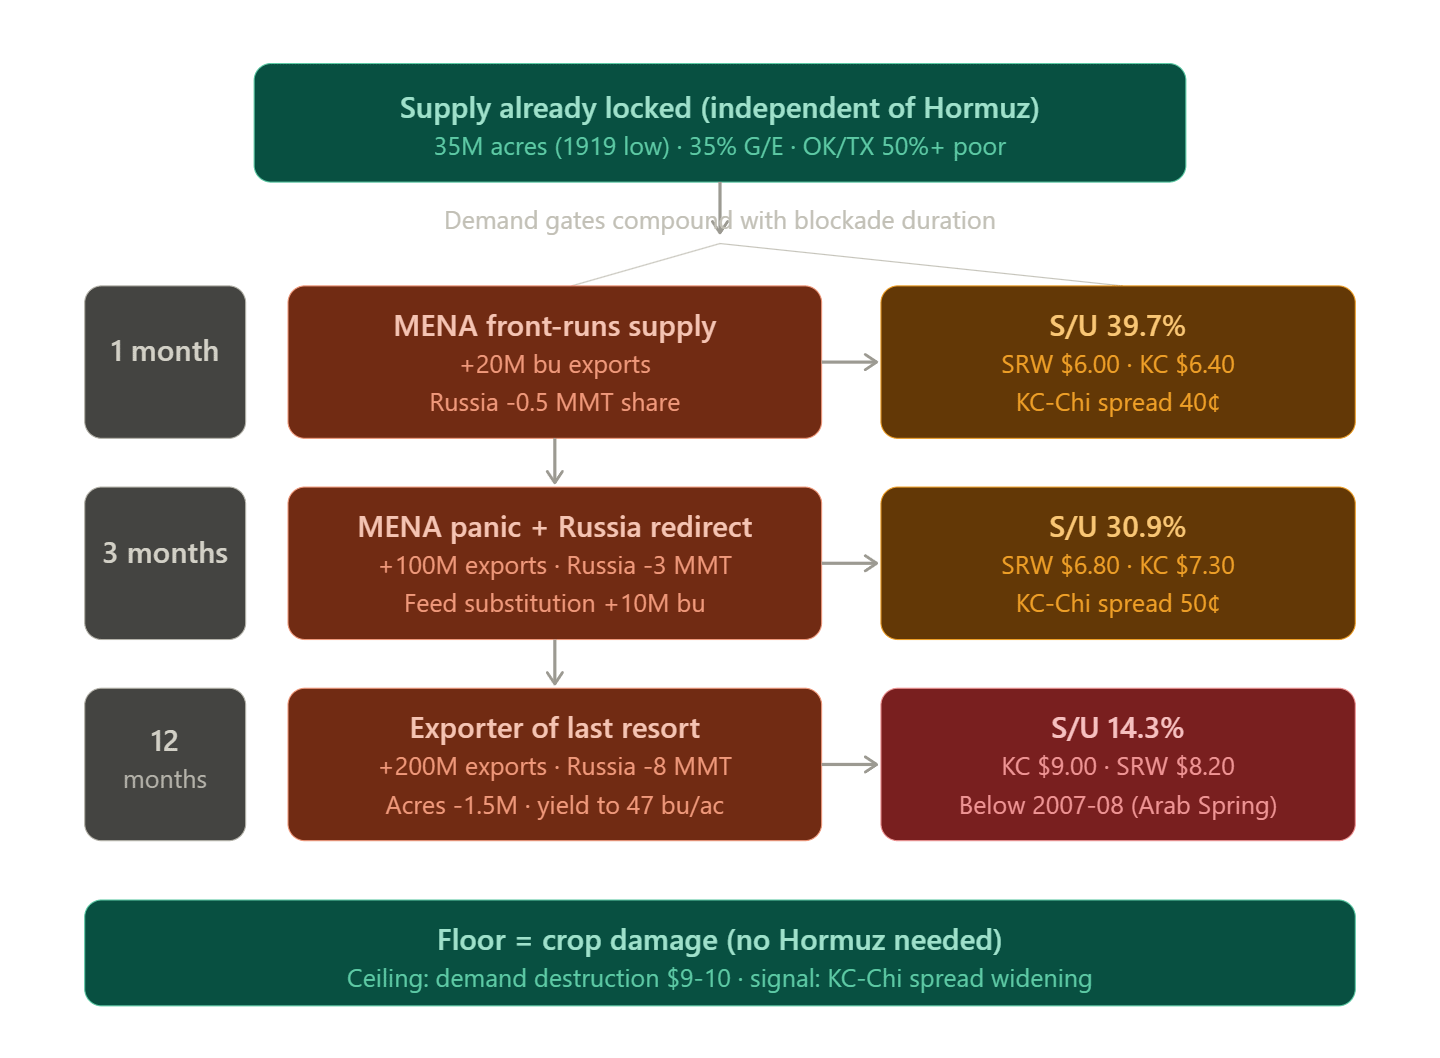
Closed 1 month. Supply unchanged. Winter wheat in the ground, spring wheat seeded, nothing moves on a 30-day timeline. Exports tick up 20M bushels as MENA buyers start front-running their tenders. Russia loses half a million metric tonnes of export share, not because Russian wheat is physically blocked (it ships through the Black Sea and Turkish Straits, not Hormuz) but because importers start diversifying sourcing for reliability. Insurance costs on Black Sea cargoes rise. Payment friction increases. Ending stocks: 772M. Stocks-to-use: 39.7%. SRW to $6.00, KC HRW to $6.40. KC-Chi spread widens from 35 to 40 cents. Noise.
Closed 3 months. Both sides break open simultaneously.
Supply: yield drops to 50 bu/ac as fertilizer costs hit spring wheat top-dress applications. Production falls 53M bushels. Not catastrophic. The yield hit is smaller than corn because winter wheat was already fertilized before the blockade. The damage here is concentrated in spring wheat regions.
Demand surges 110M bushels. MENA food security buying goes from front-running to panic. Russia loses 3 MMT of export share as insurance costs and payment friction compound. Feed substitution kicks in, as corn gets expensive, livestock operations blend more wheat into rations, adding 10M bushels of feed demand that wasn’t in anyone’s baseline.
Ending stocks: 629M. Stocks-to-use: 30.9%. SRW to $6.80, KC HRW to $7.30. KC-Chi spread widens to 50 cents. The spread widening is the signal that the market is differentiating between feed wheat and food wheat. The MENA bid concentrates in hard red winter because they need protein wheat for bread.
Closed 12 months. Yield drops to 47 bu/ac. Acres decline 1.5M as spring wheat farmers pivot to oilseeds (canola and soybeans fix their own nitrogen). Imports fall, Canada and Australia prioritize their own balance sheets. Production: 1,575M bushels, down 229M from baseline.
Demand: 2,160M bushels. Russia has lost 8 MMT of export share. MENA pulls an additional 200M bushels. Feed substitution at 30M bushels. Ending stocks: 309M. Stocks-to-use: 14.3%.
That number matters. 14.3% is below the 2007-08 level that preceded the Arab Spring.
KC HRW to $9.00. KC-Chi spread at 80 cents. Protein wheat rationed by price.
Positioning
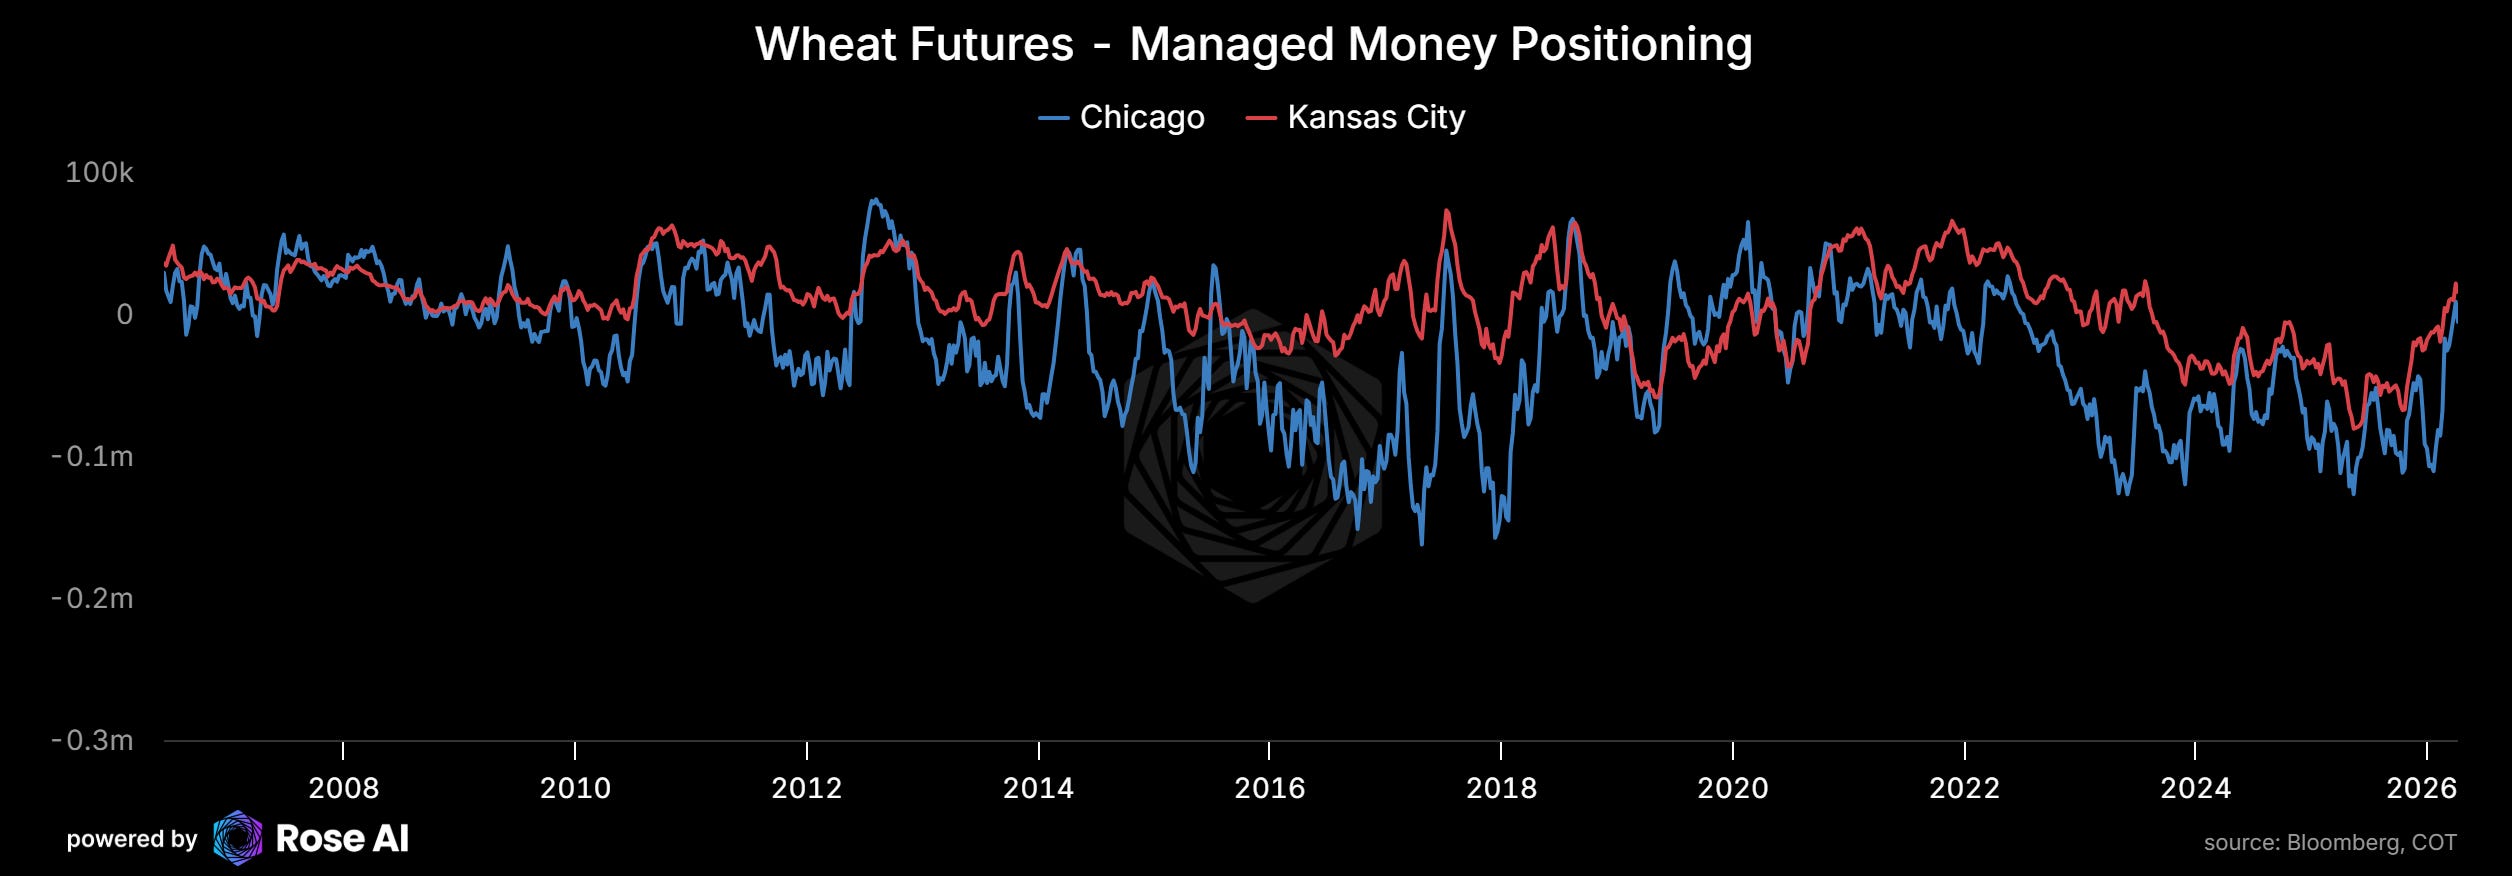
Managed money is net long 19k contracts and declining, they reduced by 5k this week. Other reportables are pressing short at -15k, also adding. Swap dealers are steady at +71k.
This is not a squeeze setup. Managed money isn’t extreme long, specs aren’t piling in but have bought recently. The trade hasn’t been front-run. That’s the kind of setup where a fundamental repricing catches people on the wrong side gradually rather than in a spectacular short squeeze.
The vol work
This is where we spent the most time, and it changed the trade.
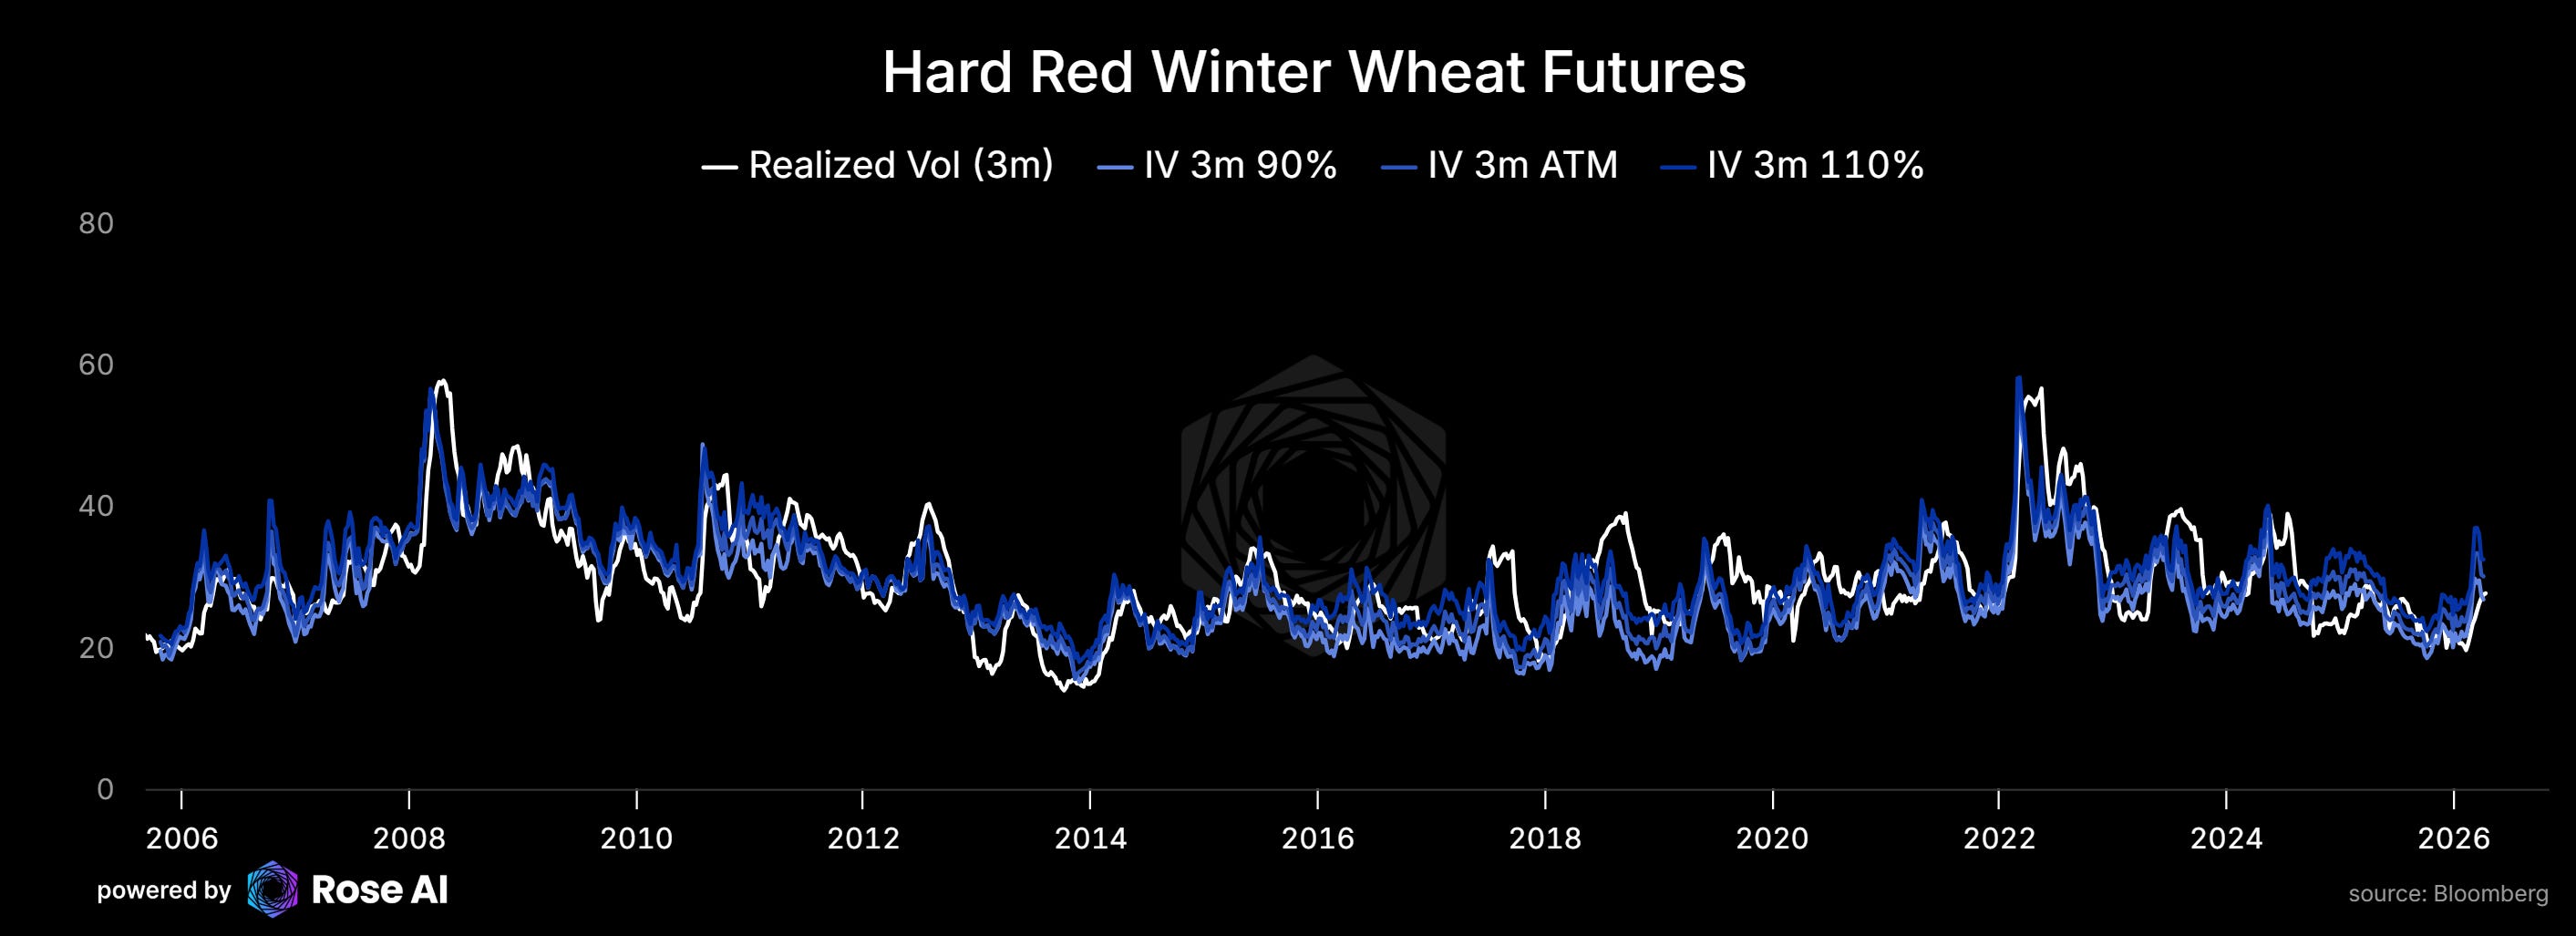
KC HRW Dec-26 ATM implied vol is 26.9%. Three-month realized is 27.3%. The premium is 31 basis points. Basically nothing. ATM options are fairly priced.
But the call skew is steep. 25-delta calls at 28%. 10-delta at 34%. 5-delta at 40%+. The further out of the money you go, the more the market charges. By the time you’re buying the kind of OTM call that gives you 5:1 or 10:1 payoff, you’re paying 6-12 vol points above ATM. That premium eats the convexity you’re buying.
We pulled the Rose AI 220-year wheat return history to check the base rate. A 17% rally in 4 months (what the Aug/Sep 700 calls need) happens about 14% of the time unconditionally across two centuries of data. The Aug/Sep vol surface at the 700 strike is pricing that probability at 32%. That’s 2.3 times the historical base rate. Over 7 months (the Nov/Dec timeframe), the historical base rate for a 17% move rises to 21%. The Nov/Dec surface prices it at 28%. Still 1.3 times above history, but less extreme.
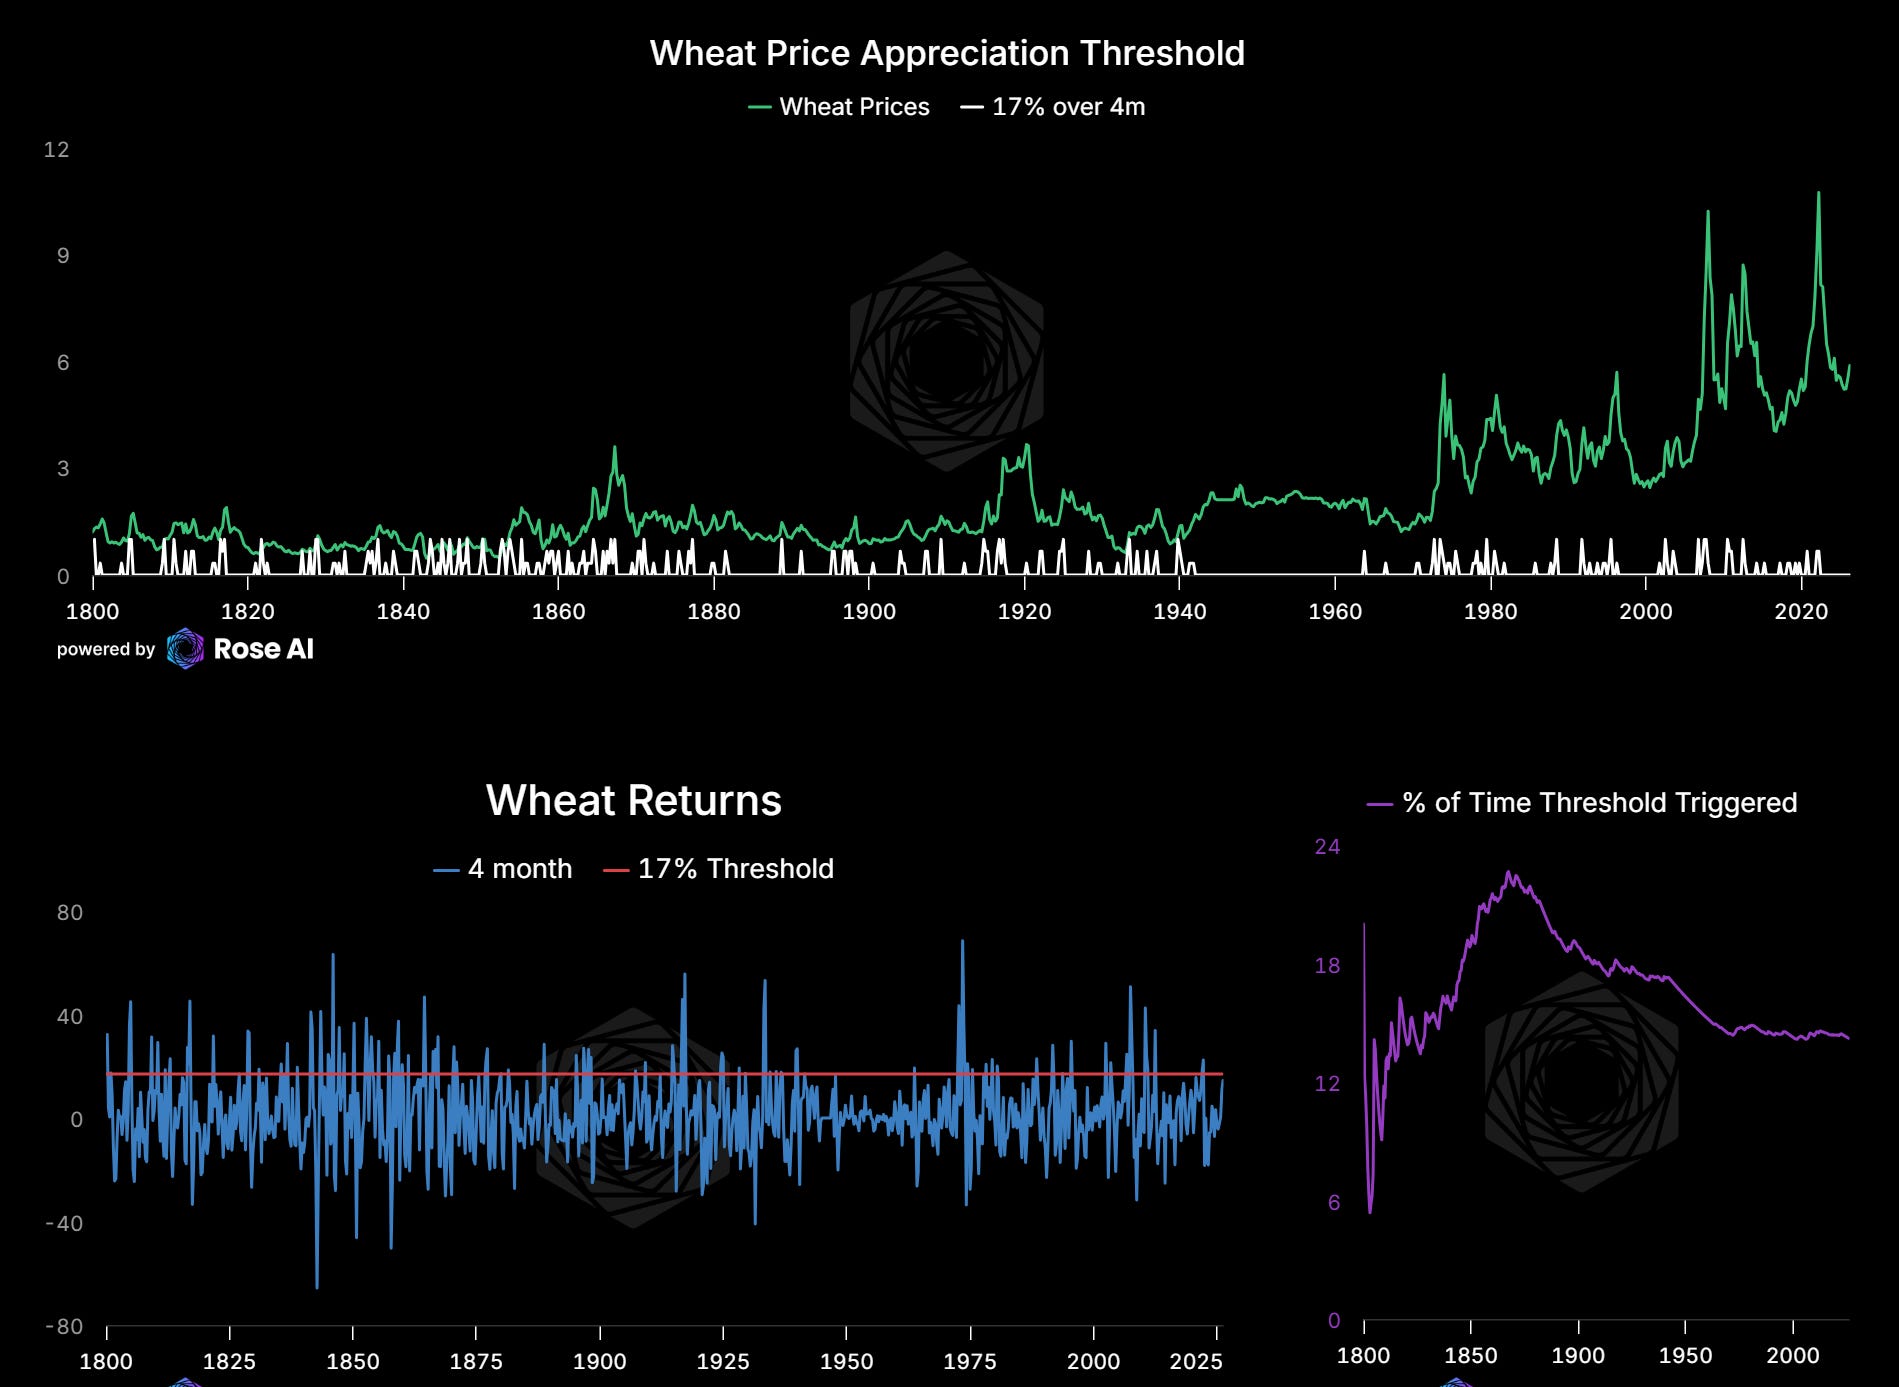
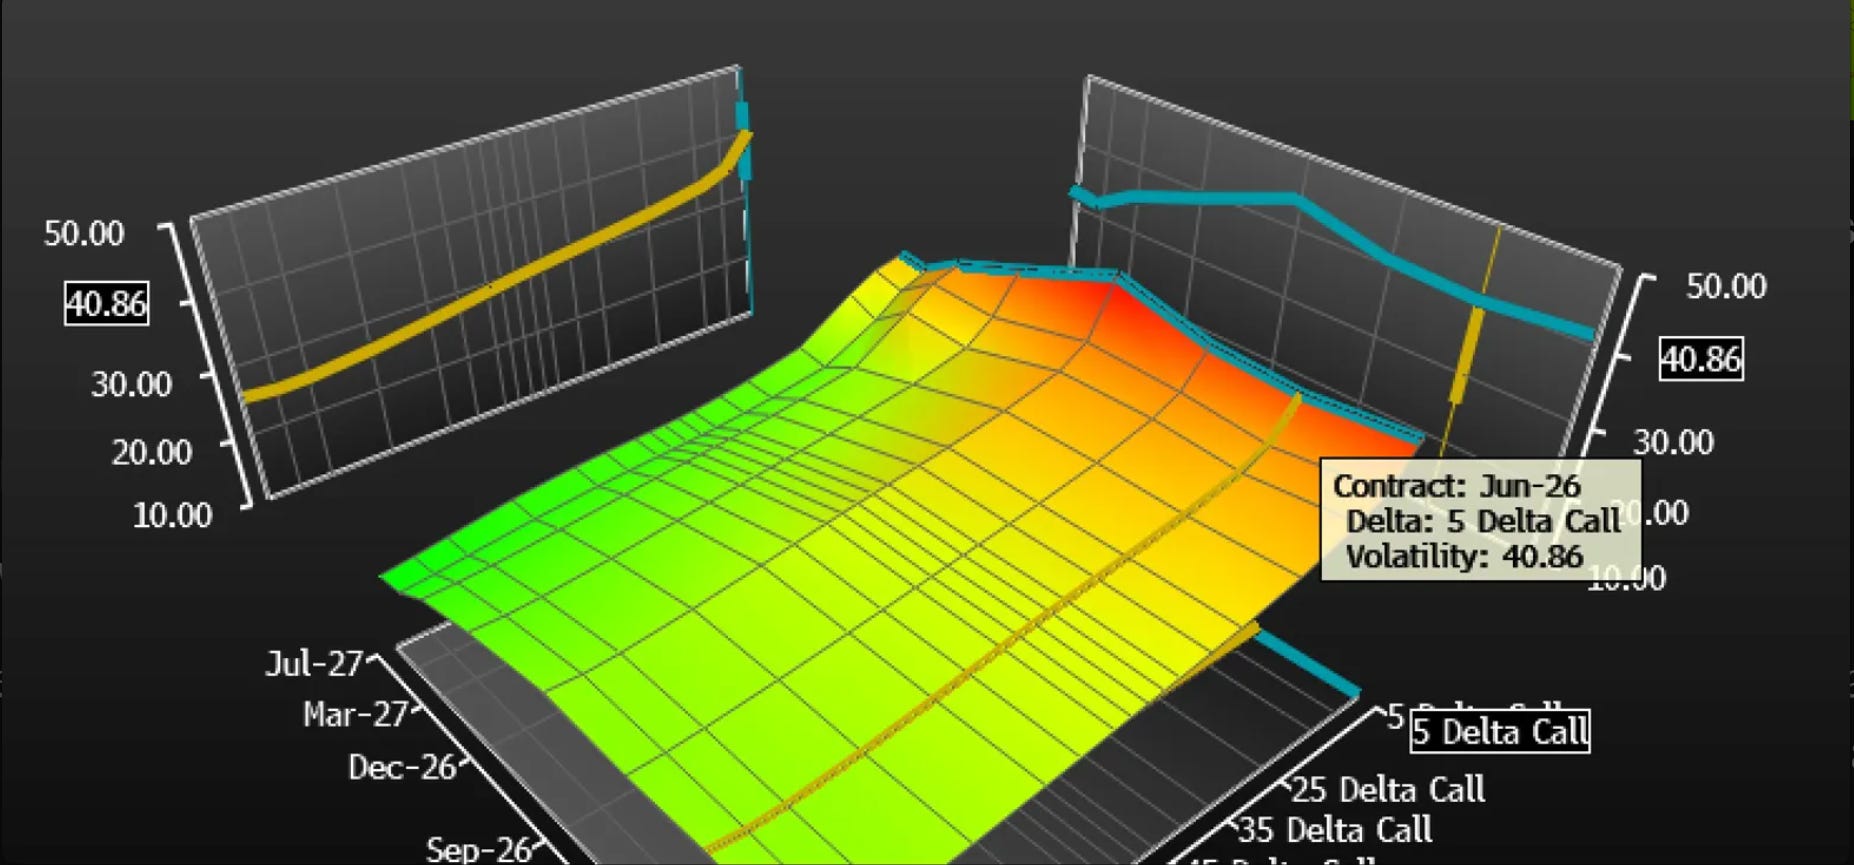
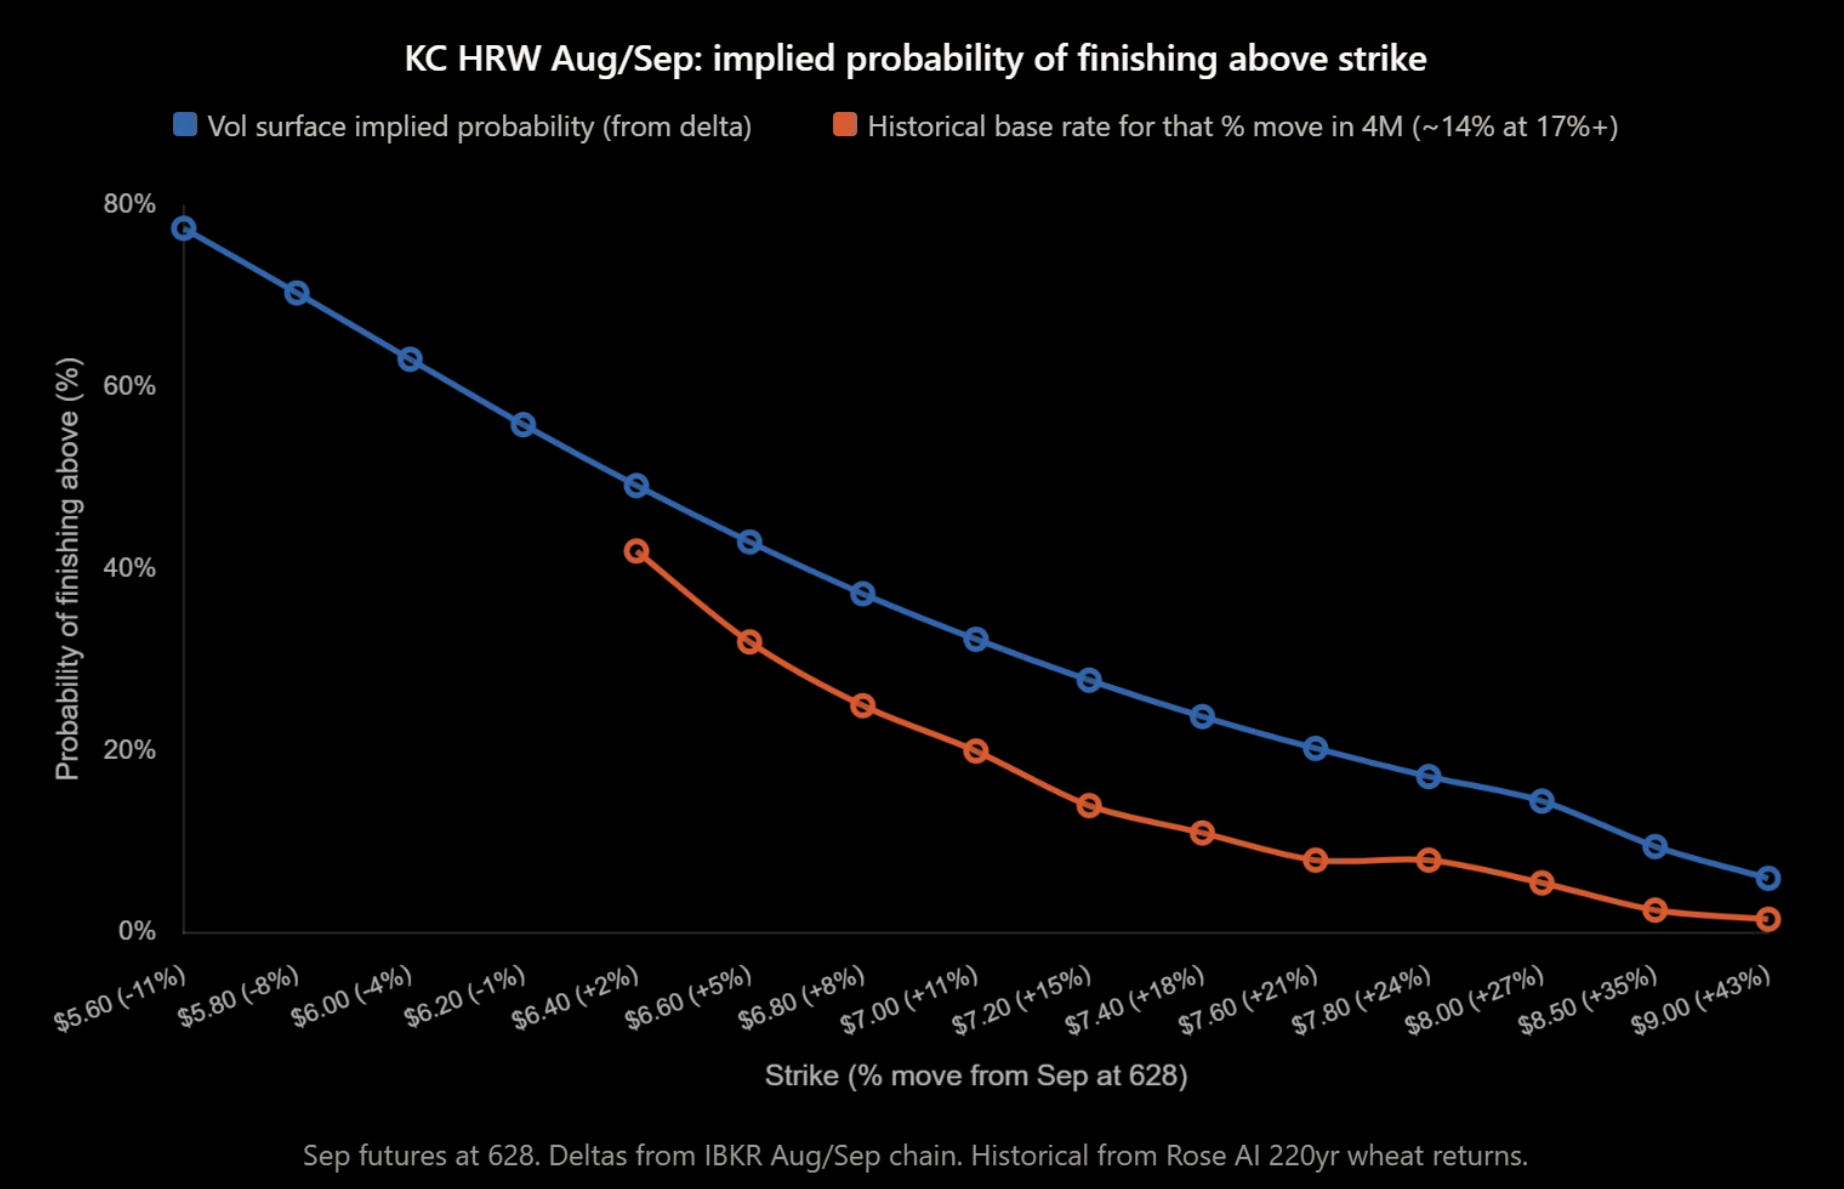
The pattern across all three expiries:
Jun/Jul (75 days): 3.2x historical markup at the 17% move threshold. Aug/Sep (131 days): 1.8x. Nov/Dec (222 days): 1.3x.
The market is frontloading the event premium into the near-dated options. Which makes sense, the catalysts are front-loaded, so near-term vol should be bid. But it means every OTM call on the board is expensive relative to where the historical distribution says it should be priced. The market already sees the blockade, the crop stress, the MENA bid. There’s no free lunch here.
The contango adds another layer. Dec futures at 647 vs front month at 601. That’s 7.7% of carry already baked in. A Dec 660 call that looks 2% out of the money from December futures is really 10% above spot. If the blockade resolves, Dec doesn’t just drop the crisis premium, the contango collapses too. You’d be paying for peace risk embedded in the forward curve on top of the skew premium embedded in the vol surface.
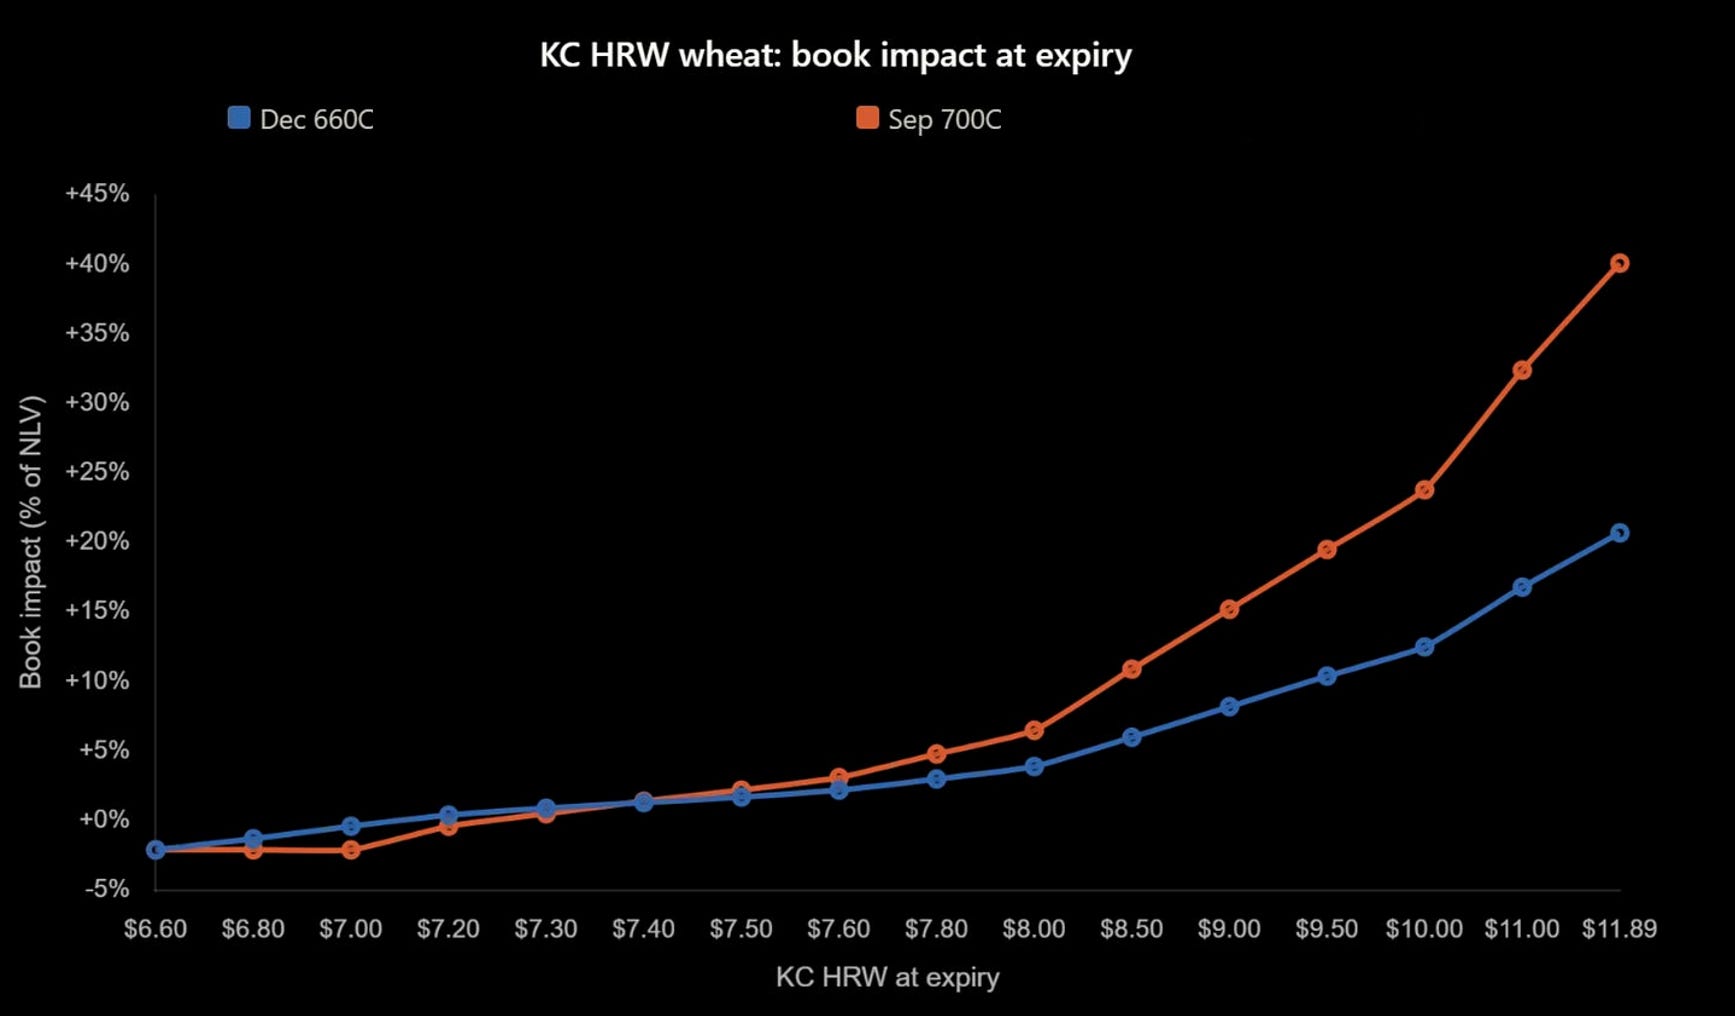
So we looked at it from every angle. Outrights at each expiry, call spreads across the skew, the capital efficiency trade-off of cheap OTM versus expensive vol. In every case the vol surface was pricing the tail we wanted to own at or above fair value. ATM was the only part of the surface where implied was at or below realized, and an ATM call at these levels doesn't give the risk/reward ratio we look for on the book.
We sold our wheat options.
The decision is simple once you frame it correctly. There’s enough convexity in the underlying itself. Wheat at $6.00 going to $7.30-9.00 in the scenarios is 20-50% upside. You don’t need option convexity to capture that. Futures give you full delta participation without bleeding theta or overpaying for skew.
The trade
Winter wheat futures. KC HRW front month.
No calls. The vol surface was telling us not to pay, and we listened.
The honest trade-off: we gave up defined risk and gained full delta at zero vol premium. If the thesis is wrong, futures hurt more than expired options. If it’s right, we capture the full move without paying the market’s inflated fear premium. Size accordingly. Risk management on futures is about stop discipline, not defined payoff.
What to watch
April 14: Crop Progress. First condition ratings since the blockade. Already bad, but watch whether the Southern Plains deteriorated further during March. Any drop below 30% G/E is a trigger for MENA acceleration.
May 9: WASDE publishes the first 2026/27 new-crop balance sheet. USDA will likely use 95.3M acres and trend yield. The balance sheet will look comfortable. If they print 51.5 bu/ac yield on a 35% G/E crop while the strait is closed, the gap between their projection and reality is the trade. WASDE creates the disconnect. The market corrects it.
June 30: Acreage Report. Actual planted acres versus March intentions. In 2022, actual came in 4M acres below March intentions. If something similar happens here, the supply story cracks open.
July WASDE: First yield revision from actual crop condition data. This is the big one. The market discovers what was locked in biologically during April and May. Every week of poor conditions between now and July compounds, irreversibly.
KC-Chi spread: The confirmation signal. Widening = MENA bid accelerating. Compression = panic fading. Watch this number more than the outright price.
Vol surface: 28% implied today, 50%+ is where vol goes during actual supply shocks. If the thesis transmits and you want to add option convexity on top of the delta position, wait for the confirmation and pay the elevated vol then, when the move is underway. Buying vol before the catalyst fires is what the market wants you to do. Don’t.
Corn: Five Gates, One Calendar
Corn has the biggest buffer and the longest fuse. Record production at 17 billion bushels, ending stocks at 2,127 million, quarterly grain stocks at a record 9 billion. The market looks at this and sees comfort. The market is correct, for now.
The cascade changes the math through farmer decisions at specific calendar gates, each irreversible once closed. Pre-plant nitrogen is happening now. Acreage allocation closes this month. Sidedress nitrogen, the binary gate, arrives in June. The corn trade needs the blockade to persist through sidedress AND the July WASDE to revise yields down. Three gates, sequential, uncertain. We hold the calls but conviction has migrated to wheat and sugar, where the catalysts are closer and the mechanisms more direct.
That said, corn is where the deepest analytical work lives, and where the optionality is cheapest relative to what the S/D model produces if you walk the gates forward honestly.
The transmission mechanism
Corn is the most nitrogen-intensive major crop on earth. A bushel of corn requires roughly 1.0 lb of applied nitrogen. At 186 bu/acre trend yield across 95 million acres, that is approximately 17.7 billion pounds of nitrogen, or about 4.4 million tons of anhydrous ammonia equivalent, purchased and applied every spring.
The blockade transmits to corn through a chain of five farmer decisions, not through a single price shock. This matters because each decision has a different sensitivity to nitrogen price, a different calendar window, and a different reversibility profile. The market prices corn as if fertilizer cost is a smooth input. In practice, the transmission is lumpy, sequential, and path-dependent.
The critical variable is the nitrogen-to-corn price ratio, not the absolute price of ammonia. In 2022, ammonia hit $1,600/ton but corn was at $7.50, so the ratio peaked around 0.14-0.16. Farmers adapted. Yields came in 3.5% below trend, mostly attributable to drought. Today ammonia is only $924 but corn is $4.50. The ratio has hit 0.20 for UAN, the highest in five years. The denominator is what makes this crisis worse than 2022 on a farm-economics basis. Farmdoc at Illinois published updated MRTN guidance on March 31 specifically referencing the Iran conflict and recommending rate reductions of 6-8 lbs/acre from fall levels.
What is “MRTN”? Maximum Return to Nitrogen. It’s a calculator built by Midwest land-grant universities that finds the economically optimal nitrogen application rate given two inputs: the price of nitrogen and the price of corn. The yield response to nitrogen follows a diminishing-returns curve. The first 100 lbs of N per acre produces most of the yield gains. The last 30 lbs near maximum yield adds maybe 2-3 bu/acre. The MRTN finds the point where the marginal cost of the next pound of nitrogen exactly equals the marginal revenue from the additional corn it produces.
At today’s ratio of 0.20, the MRTN recommends 172 lbs/acre for corn-after-soybeans (down from 178 last fall) and 186 for continuous corn (down from 194). Those 6-8 lb/acre reductions sound trivial. Across 90+ million acres they compound into hundreds of millions of bushels of yield risk.
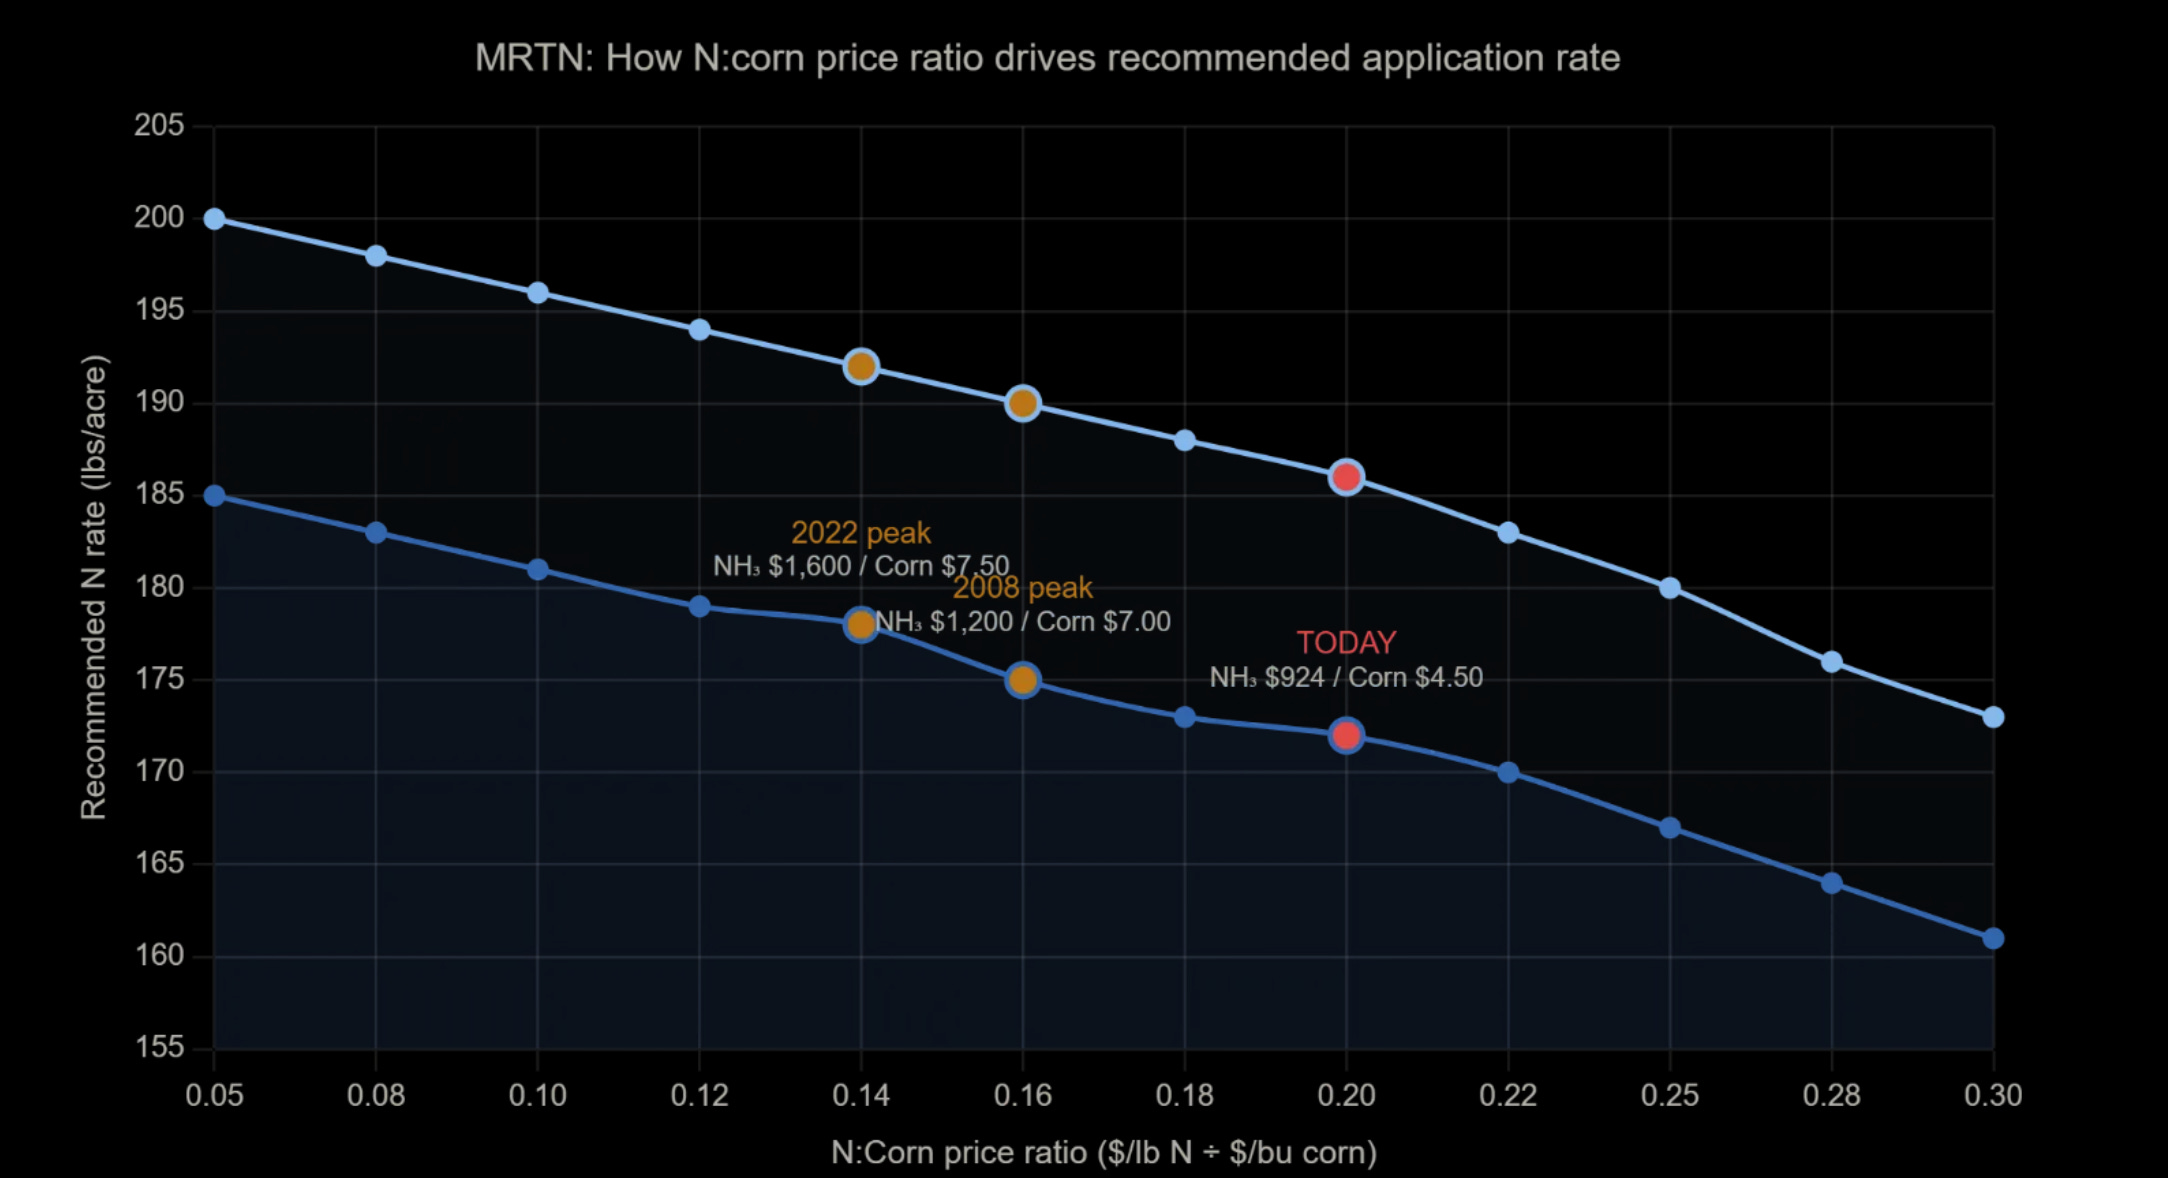
If ammonia goes to $1,200-1,500 in the 3-12 month scenarios, the ratio pushes past 0.25-0.30 and recommended rates drop 15-25 lbs/acre. That is where yield losses compound from a rounding error into a balance sheet event.
The baseline
US corn production set a record at 17.02 billion bushels on 98.8 million planted acres at 186.5 bu/acre. Ending stocks at 2,127 million bushels are up 37% year-over-year from 1,551 million. The stocks-to-use ratio is approximately 12.9%. Exports are running at a record pace of 3.3 billion bushels with inspections 42% ahead of last year. Feed and residual use is projected at 6.2 billion, ethanol at 5.5 billion. The season-average farm price sits at $4.10.
The global picture is less comfortable. World ending stocks declined to 293 MMT from 296 MMT. Excluding US and Chinese reserves, global stocks hover near 11-year lows at roughly 82 MMT. The IGC’s initial 2026/27 outlook projects world maize production declining from this year’s record, with cumulative grain stocks falling 23 MMT. The US surplus is real but it masks a tightening rest-of-world picture that leaves less margin for error if production disappoints.
The forward curve confirms the surplus. May at 454 (as of writing), July 465, December 481, March ‘27 at 492. Classic contango reflecting ample nearby supply with carry charges and new-crop uncertainty in deferred months. The contango costs us to hold long positions, which is one reason conviction has migrated to wheat (where we went delta, not calls) and sugar (where the contango is shallower).
Prospective Plantings on March 31 showed corn area intentions at 95.3 million acres, already down 3.5 million from 2025. This was surveyed in early-to-mid March, roughly two weeks into the blockade but before the worst of the fertilizer spike hit retail. Ammonia was maybe $750-800 at survey time. The actual number will be reported June 30. In 2022, actual corn planted came in 4 million acres below March intentions.
The five gates
The cascade doesn’t hit corn production all at once. It passes through five sequential decision points, each with its own price sensitivity and calendar window. Understanding which gates are locked, which are closing, and which remain open is the entire analytical challenge.
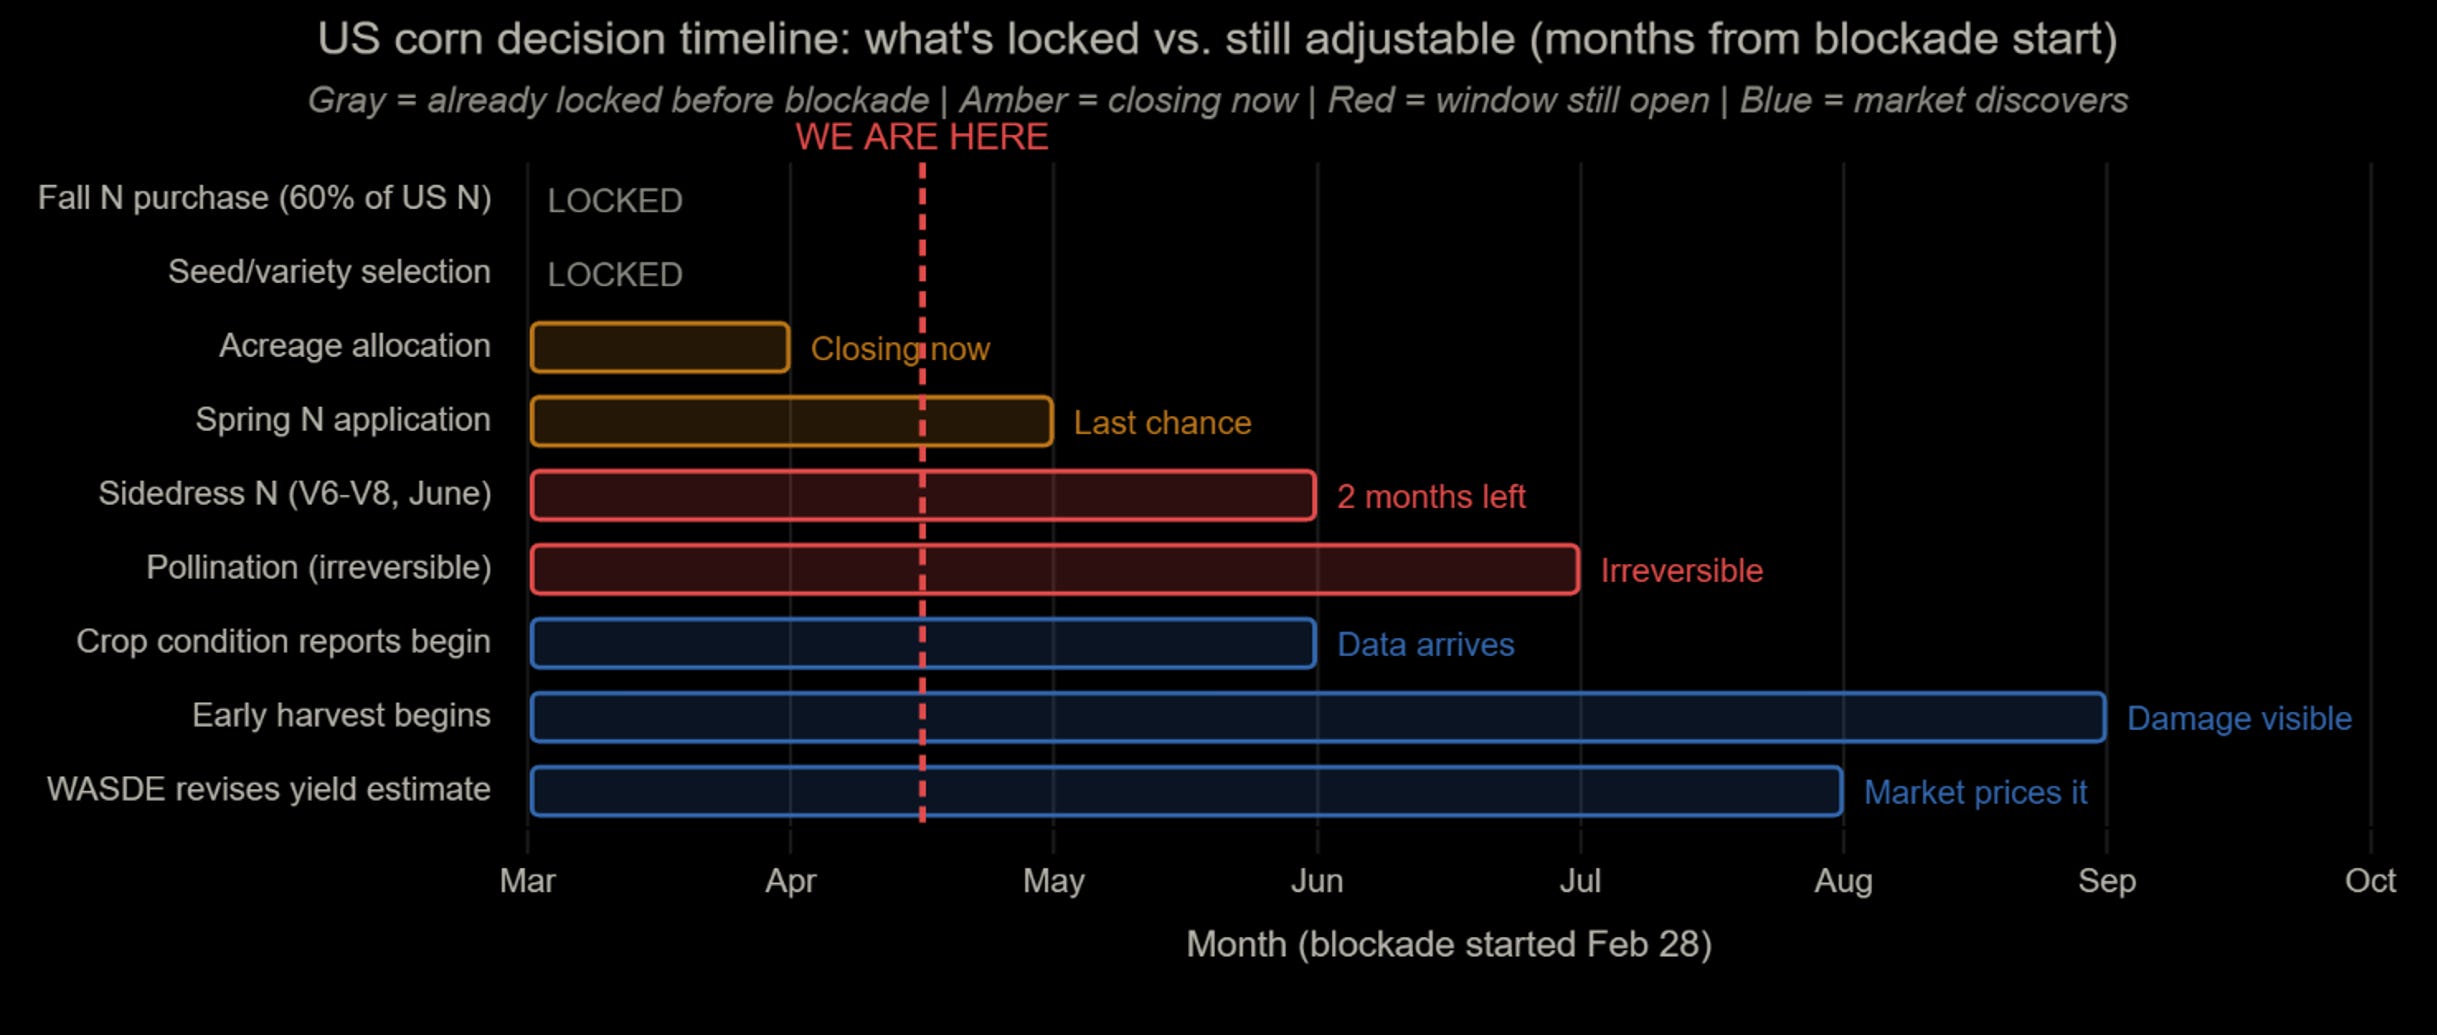
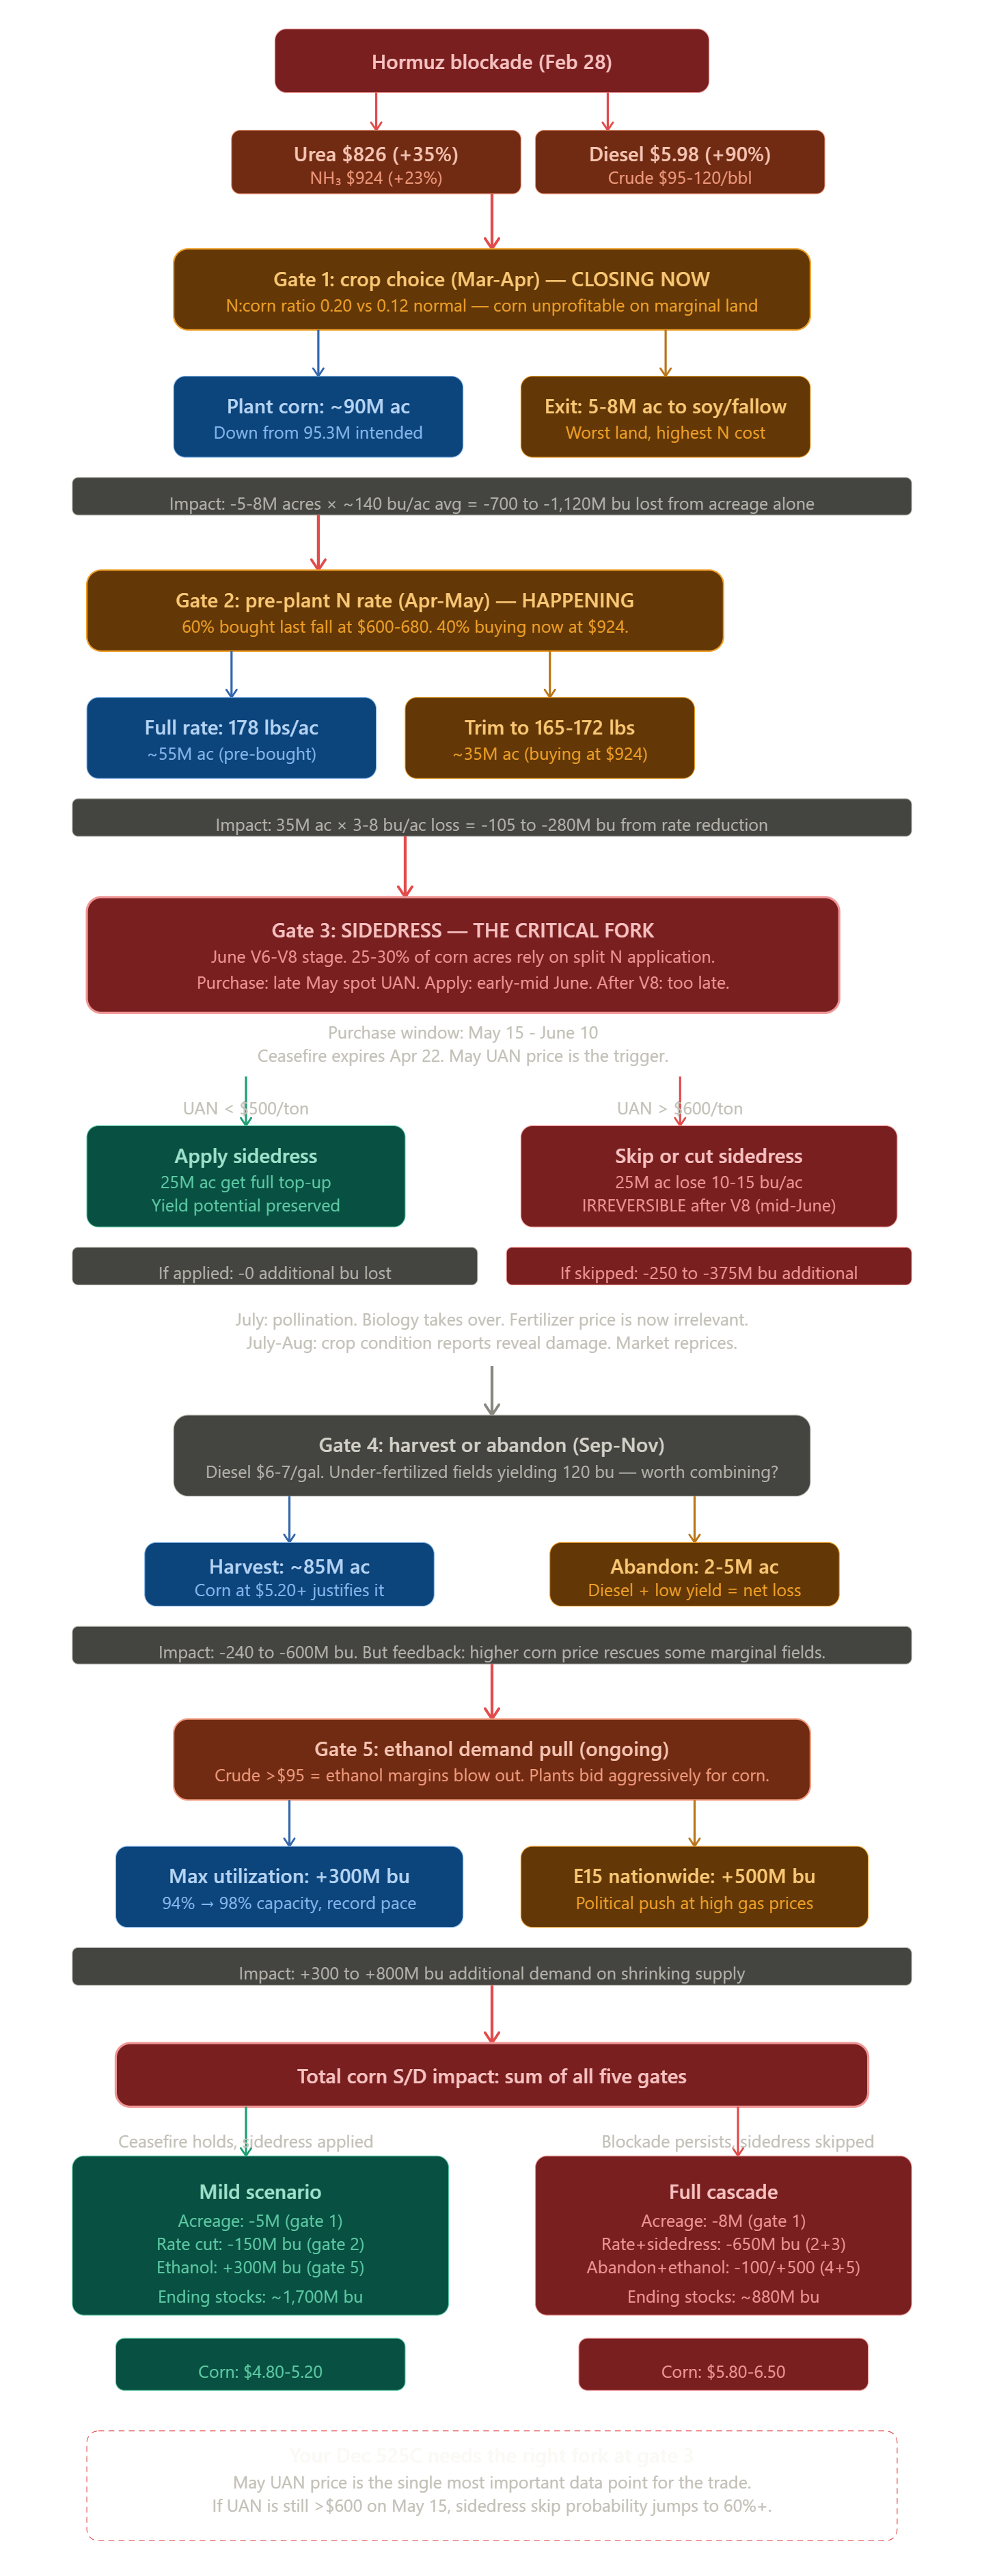
Gate 1: Crop choice (March-April, closing now). At a 0.20 N:corn ratio, corn is unprofitable on marginal land. Breakeven on average soil runs $4.90/bu before the fertilizer spike, closer to $5.10-5.50 at current input costs. Fields yielding 140 bu/acre or less cannot make the math work. The soybean pivot is already underway. Prospective Plantings captured some of this, but nitrogen prices have risen another 15-20% since the survey. We estimate 5-8 million acres exit corn beyond the 3.5M already reflected in intentions. At roughly 140 bu/acre average on those marginal fields, that is 700 to 1,120 million bushels of production removed from acreage alone.
The mechanism here is not uniform rate reduction across all fields. Farmers on good land (200 bu/acre potential) still plant corn because the economics work even at $924 ammonia. Farmers on marginal land (140 bu/acre or less) exit entirely to soybeans (which fix their own nitrogen) or fallow. The bad fields disappear. The good fields stay but trim rates. The weighted average yield drops because the bottom of the distribution gets removed.
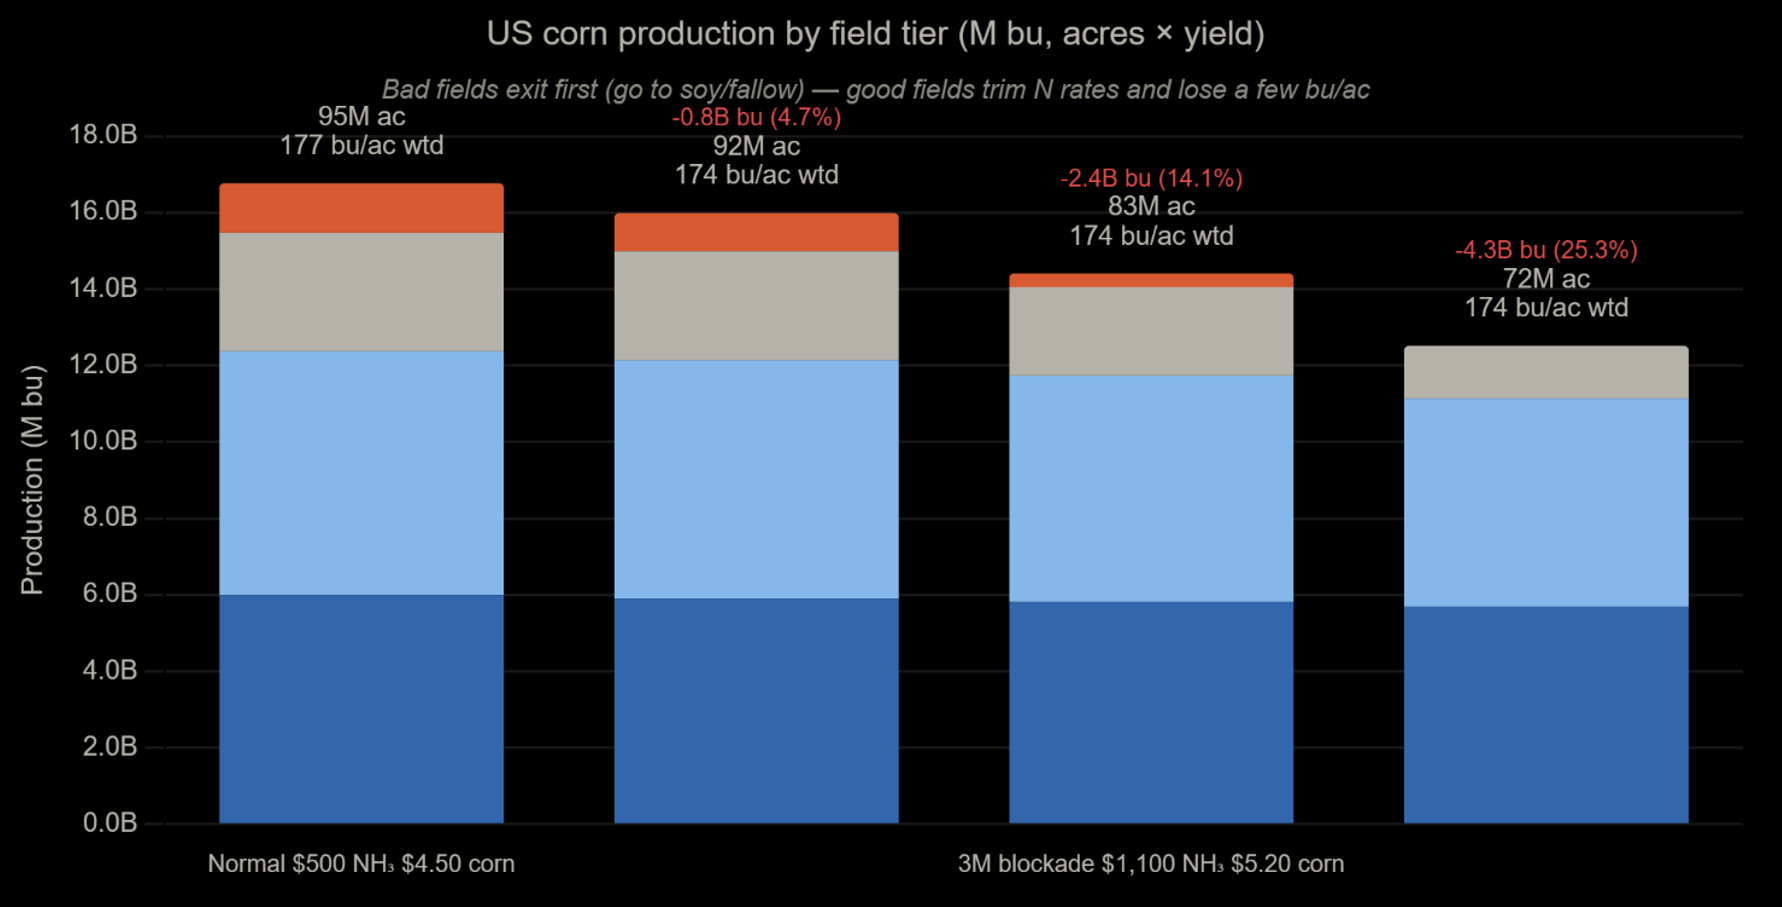
Gate 2: Pre-plant nitrogen rate (April-May, happening now). Roughly 60% of US corn nitrogen was purchased last fall at $600-680/ton ammonia. Those farmers are unaffected. The remaining 40%, about 35 million acres, are buying spring pre-plant at $924. The MRTN calculator tells them to cut 6-8 lbs/acre from the recommended rate. Some will cut more. At 3-8 bu/acre yield loss across those 35 million acres, that is another 105-280 million bushels of production risk from rate reduction.
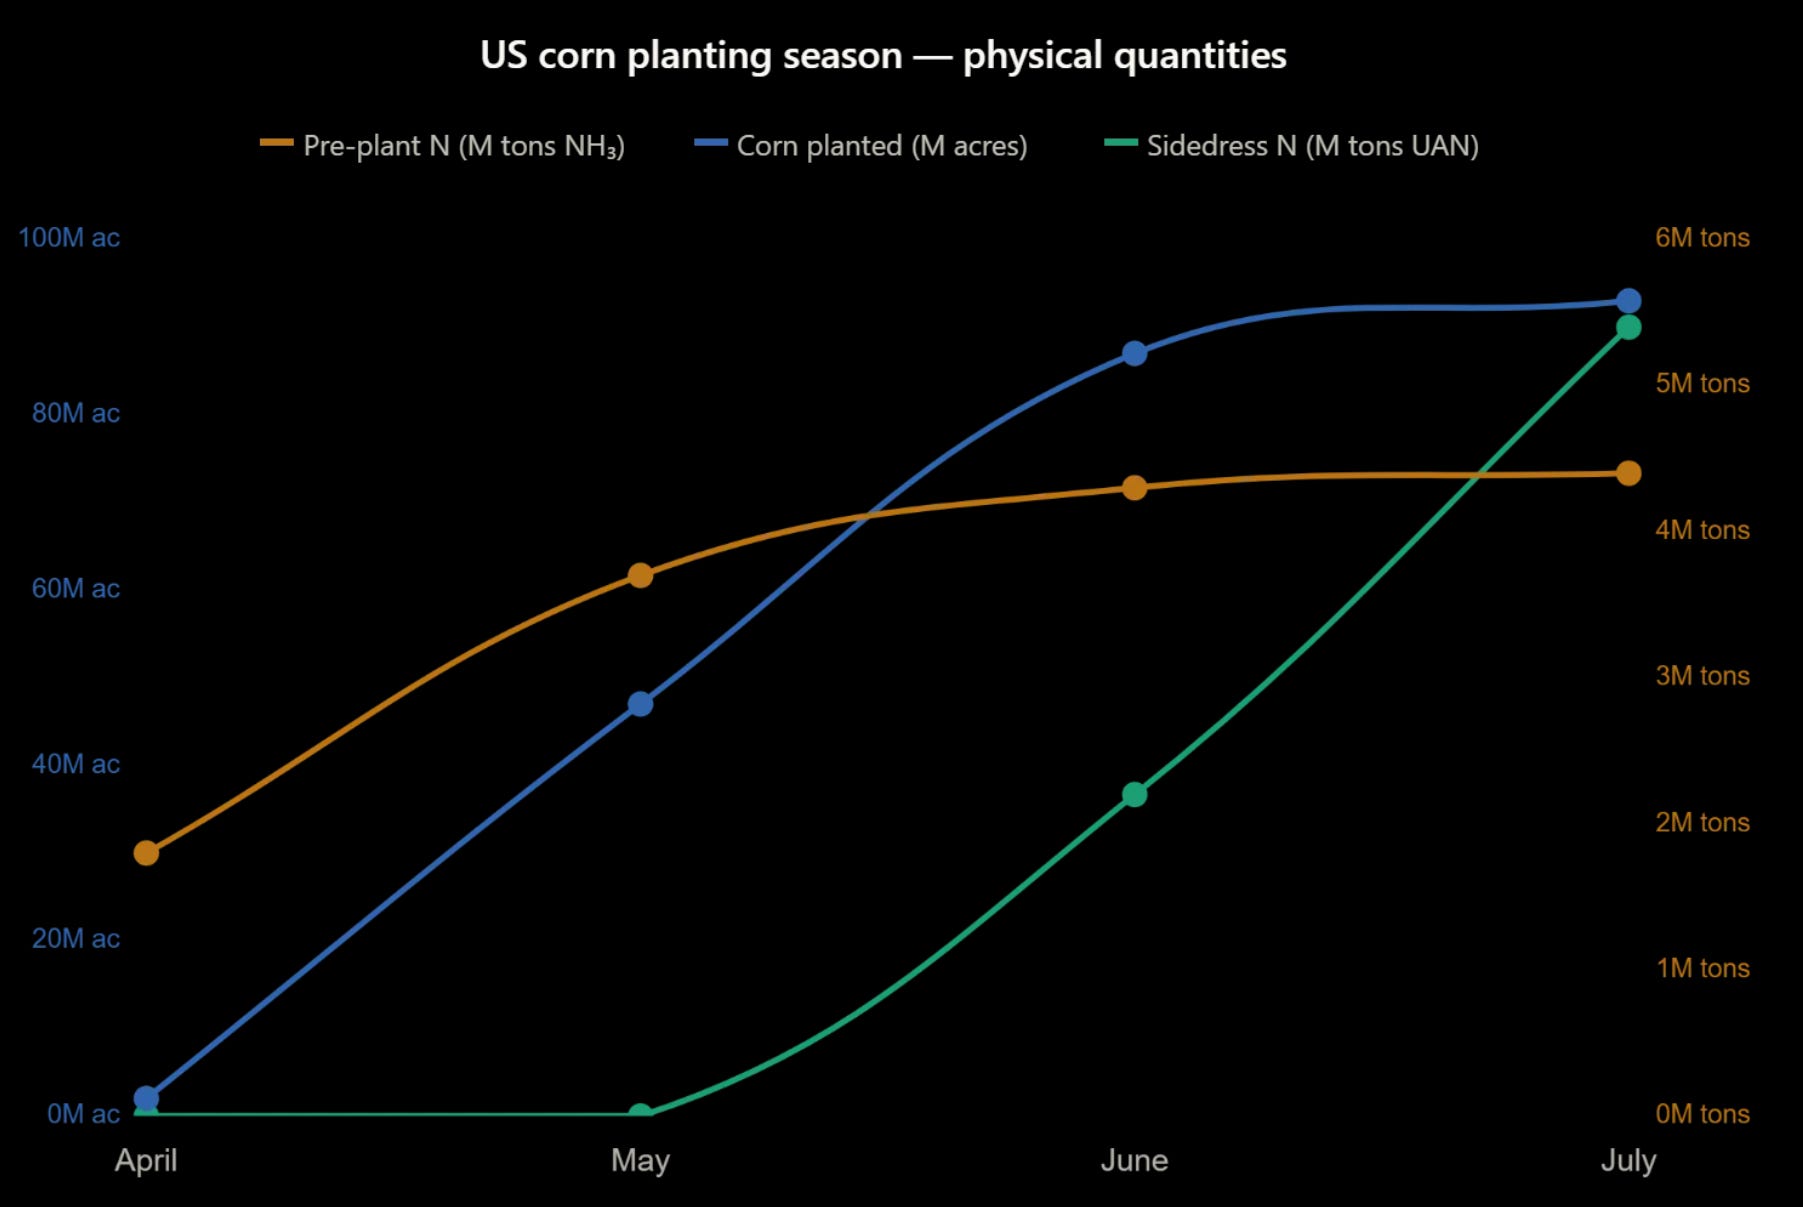
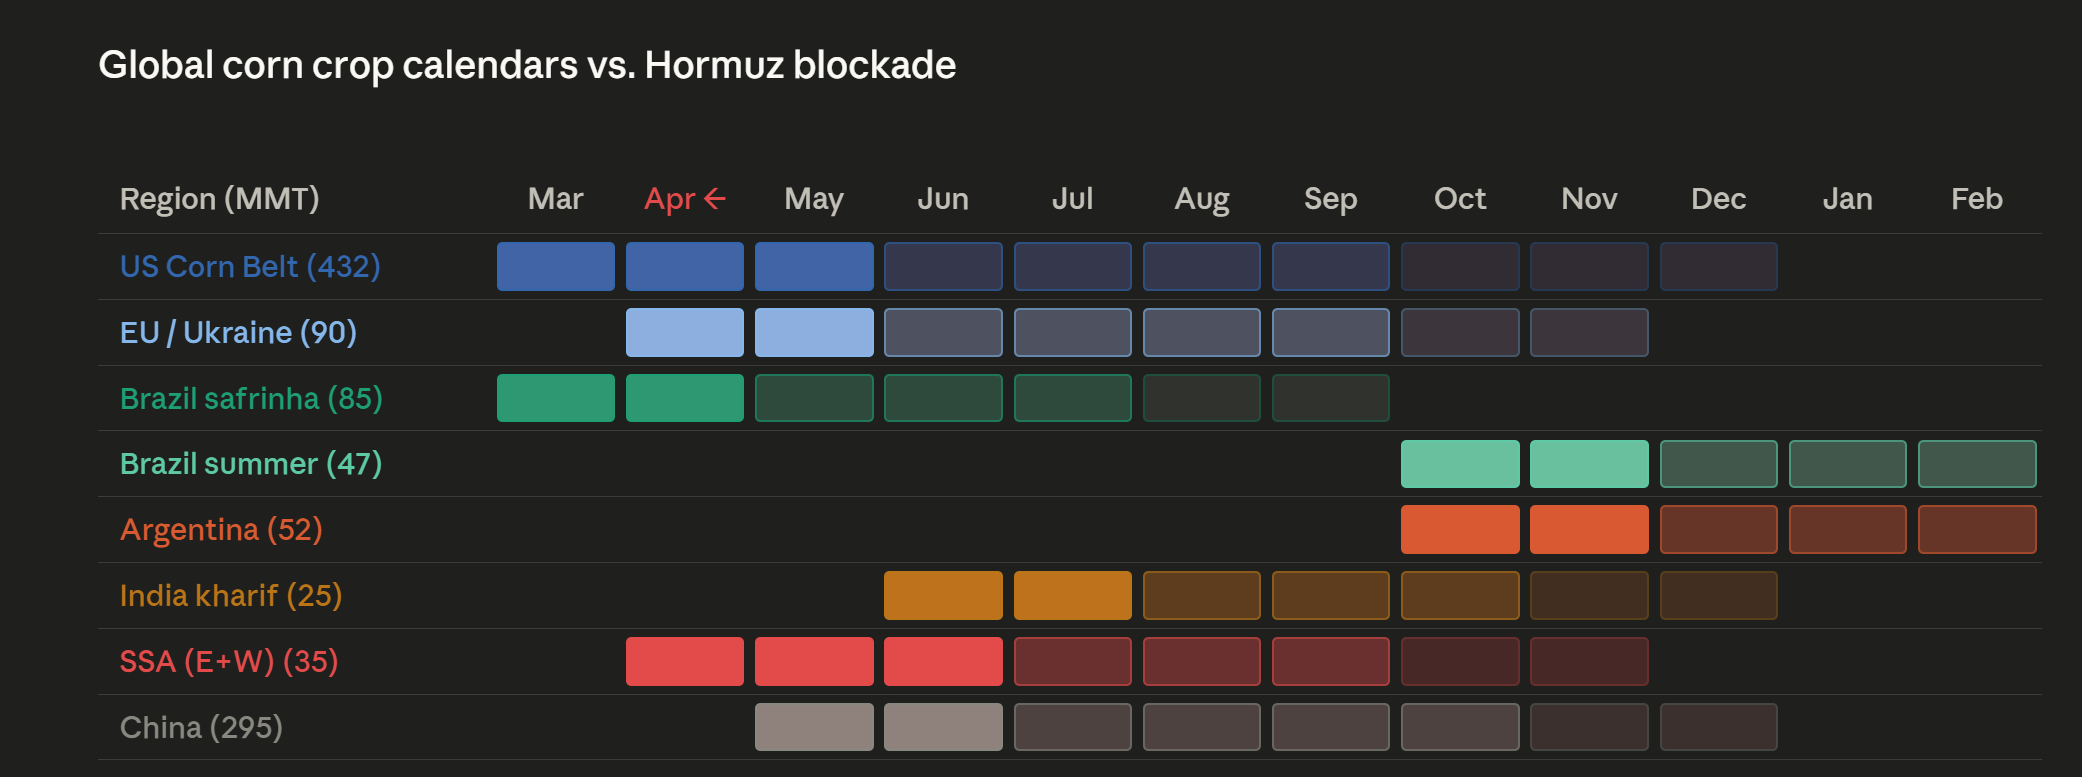
The corn planting season unfolds as three sequential S-curves, and the timing matters for understanding which decisions are still open.
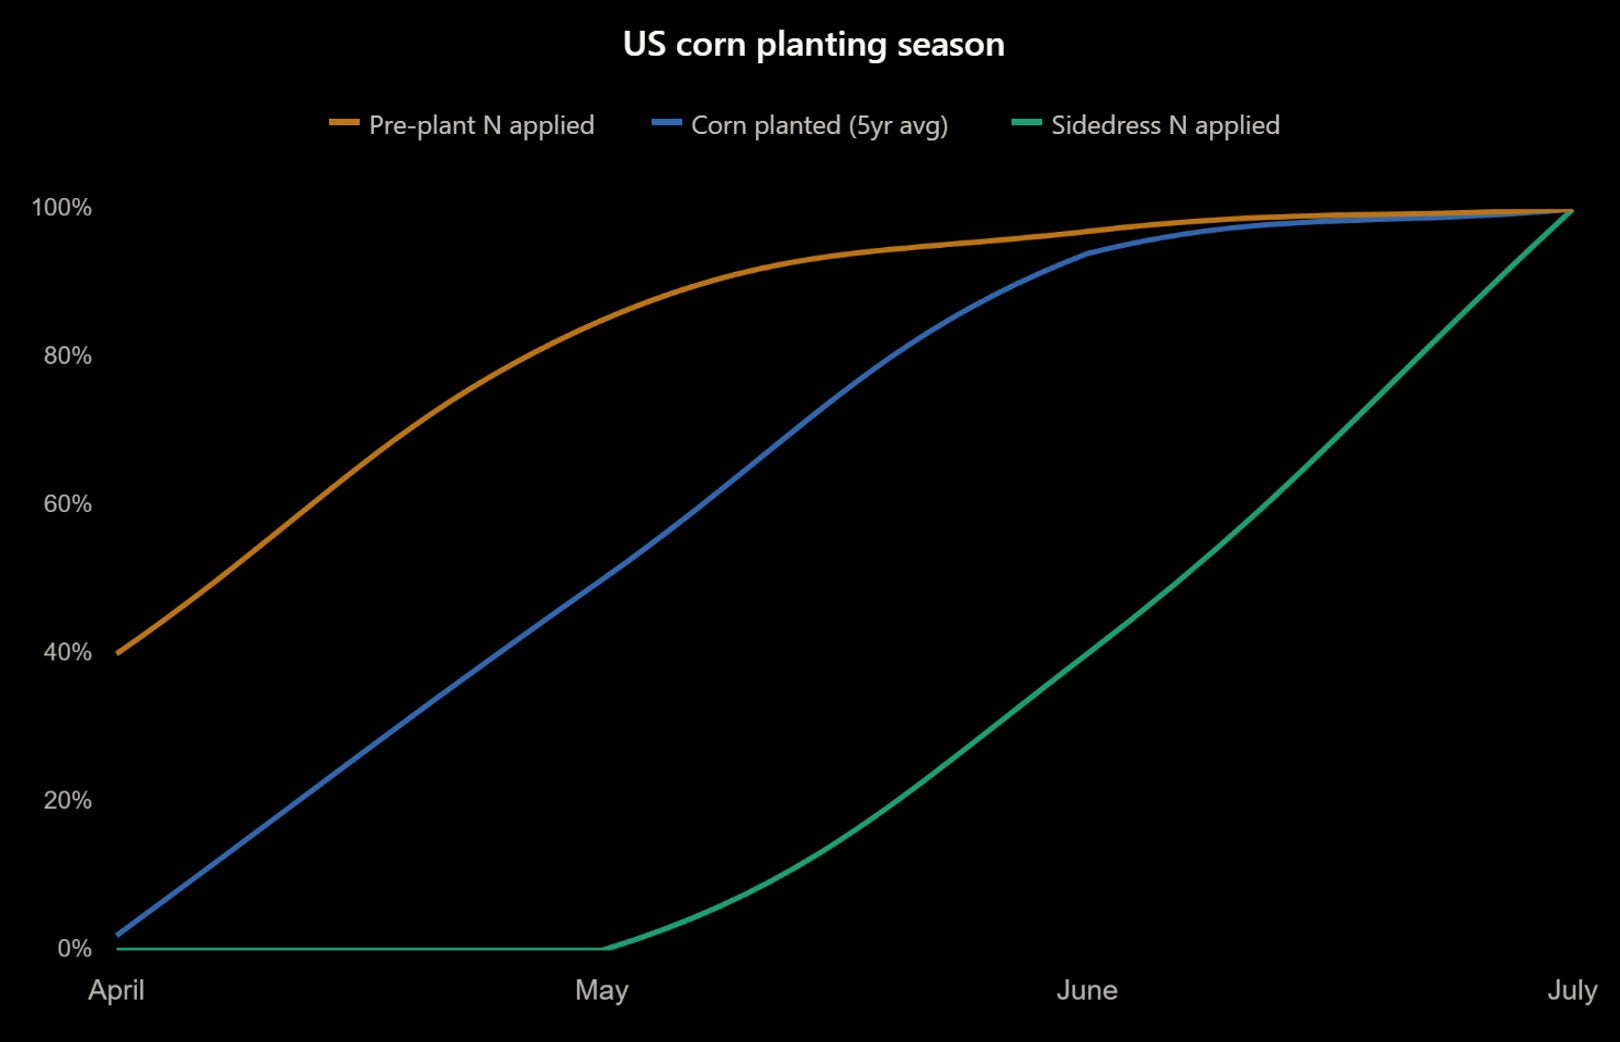
Pre-plant nitrogen (amber) is already 40% complete as of early April and will be 85% done by May 1. That horse is leaving the barn. Corn planting (blue) is just starting at 3% and ramps through late May. Sidedress (green) doesn’t move until June and doesn’t peak until mid-June.
In physical quantities, the magnitudes make the sidedress vulnerability concrete. Pre-plant is 4.4 million tons of NH₃, mostly deployed. Corn planting covers 93 million acres. Sidedress is 5.4 million tons of UAN solution that needs to be purchased and applied between late May and early July. At current UAN prices of $464/ton, that is $2.5 billion of farmer purchasing decisions sitting entirely inside the blockade window. Zero of it has been bought yet.
Gate 3: Sidedress, the critical fork (June). This is where the trade lives.
About 25-30% of Corn Belt acres rely on split nitrogen application, putting 30-40% of their total N down as sidedress at V6-V8 stage, typically early-to-mid June. Most sidedress is UAN solution, purchased from dealers in late May for application in the first three weeks of June. The purchase window is May 15 to June 10. The ceasefire expires April 22. May UAN price is the single most important data point for the trade.
If UAN is below $500/ton in late May (ceasefire holds, logistics normalizing), most farmers sidedress normally. Yield potential preserved. The cascade stops at gates 1 and 2. Corn goes to $4.80-5.00 on acreage loss and modest rate cuts. Our Dec 525C probably expires near zero.
If UAN is above $600/ton (blockade persists, logistics disrupted), 60%+ of the sidedress-dependent acres skip the top-up. Twenty-five million acres lose 10-15 bu/acre. That is 250 to 375 million bushels of additional production loss, locked in permanently after V8 around June 20. The corn plant has set its ear size by then. No amount of money or rain changes the outcome after that date.
This is the binary. Everything before it is gradual. Everything after it is biology.
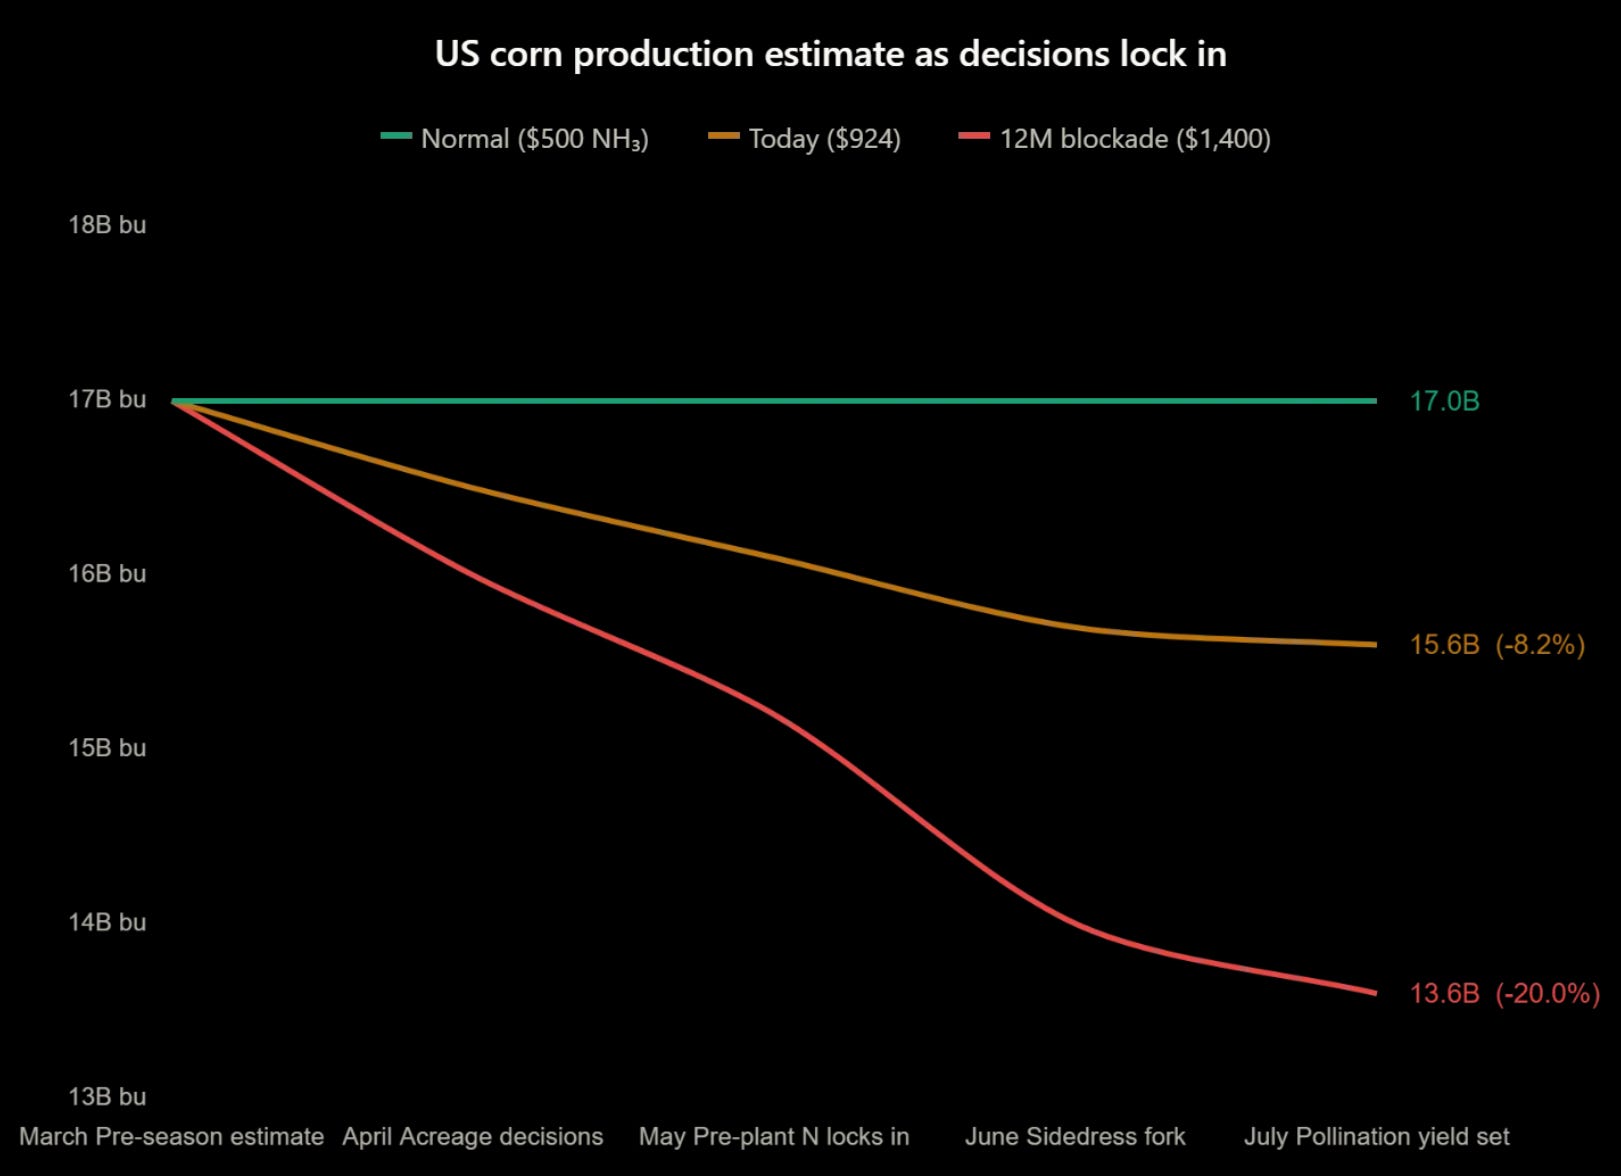
To see how fertilizer cost bends each of the three curves differently, look at what happens to acres, pre-plant N, and sidedress N at three price levels: normal ($500 NH₃), today ($924), and 12-month blockade ($1,400).
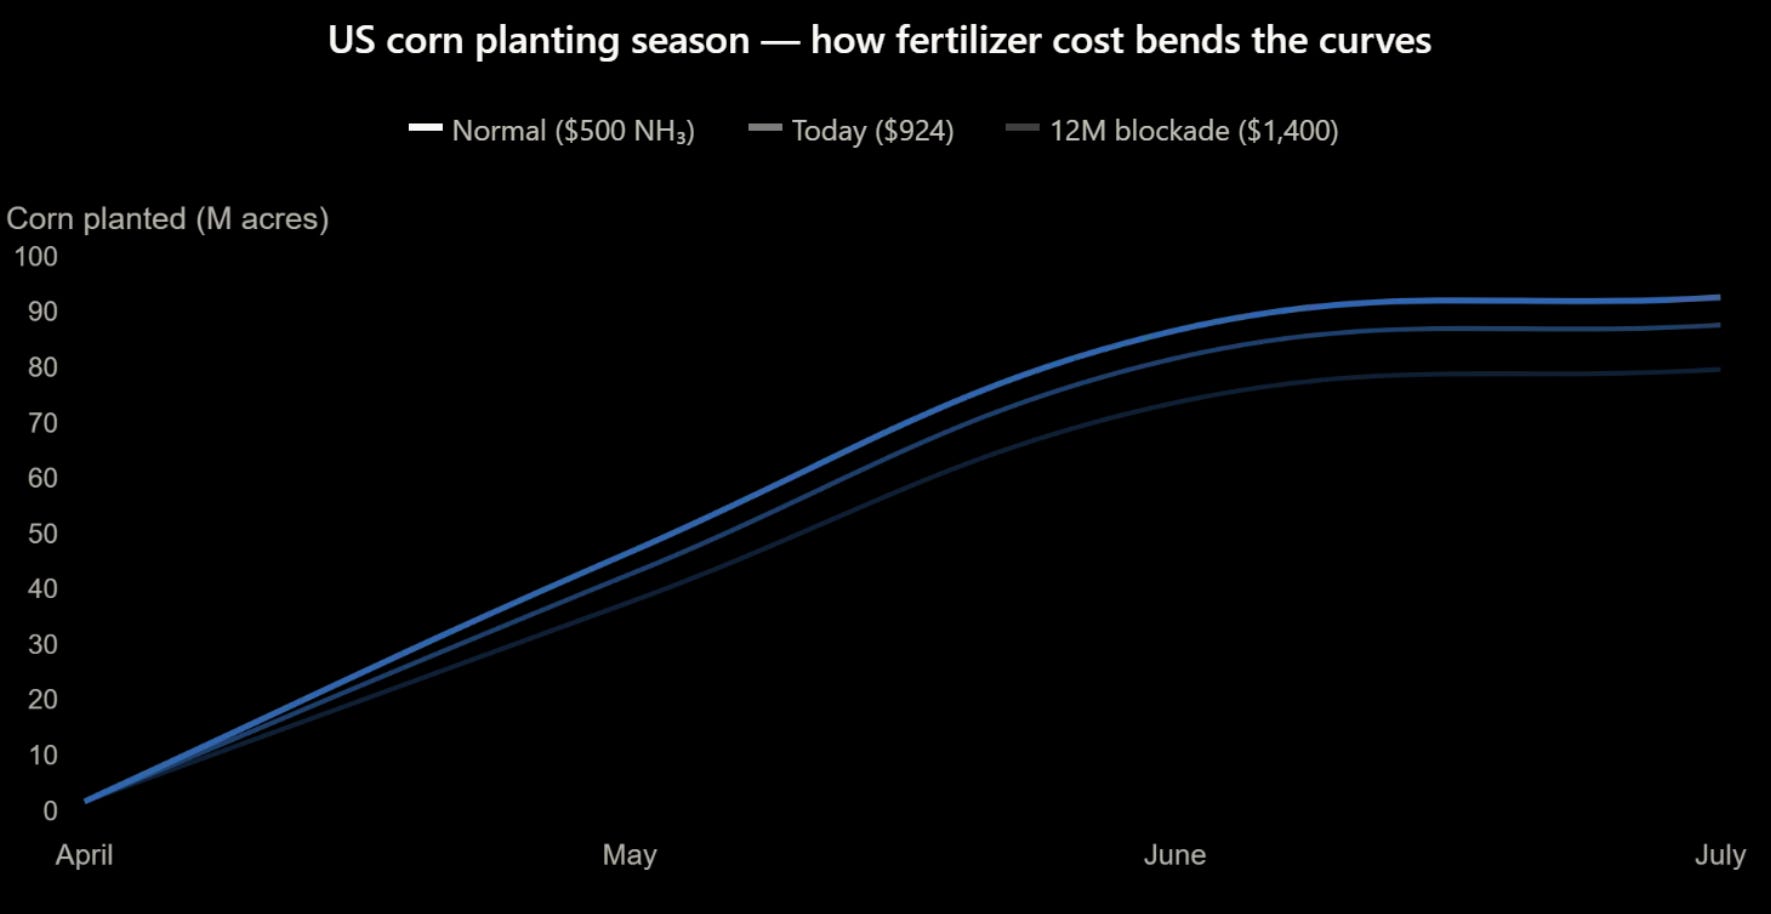
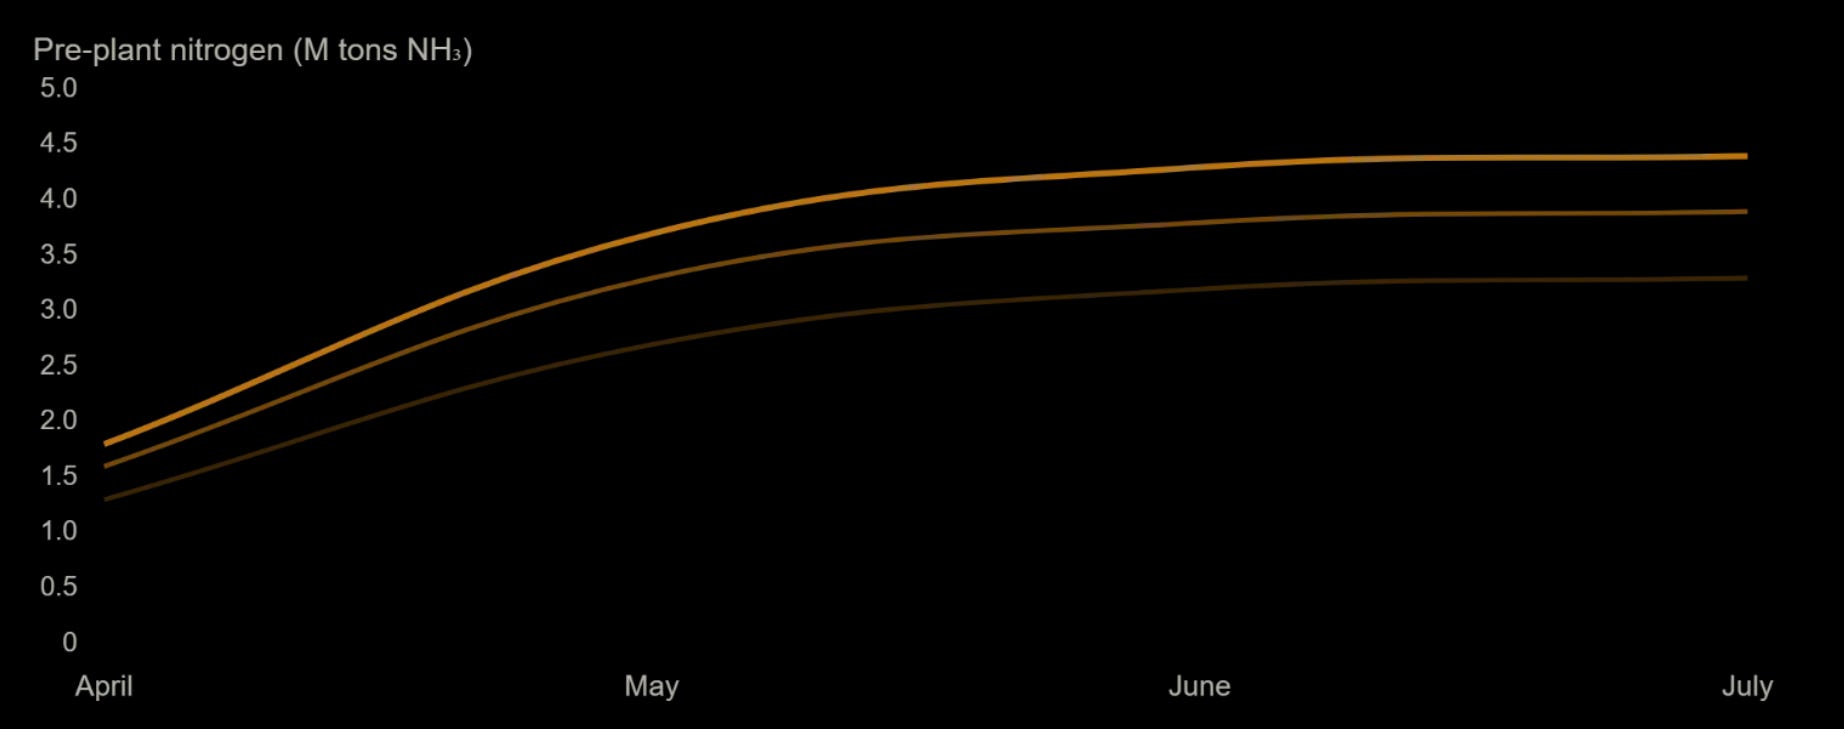
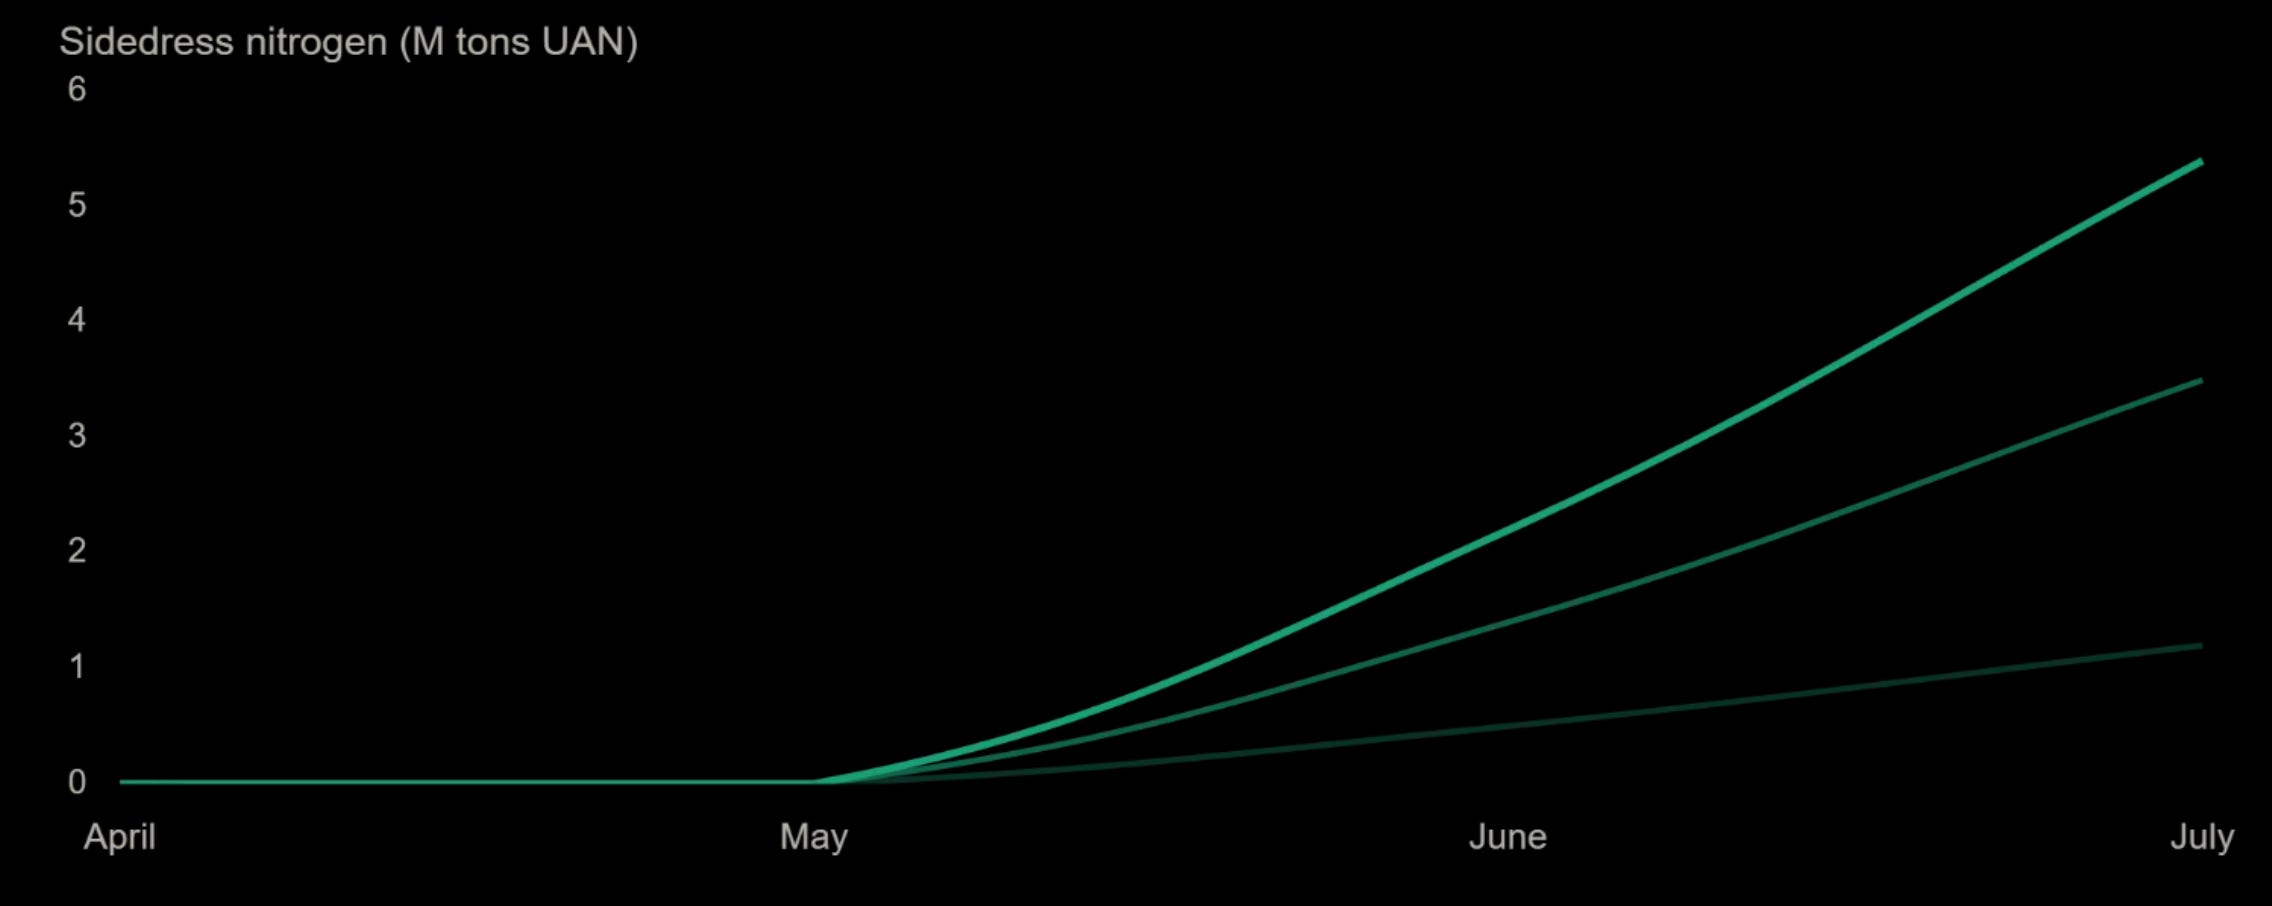
The top panel (acres) barely spreads. Even at $1,400 ammonia, 80 million acres still plant corn because the good land is still profitable. You lose 13 million acres off the bottom. The middle panel (pre-plant N) spreads modestly because most of it was purchased before the blockade. The bottom panel is where it blows apart. At normal prices the sidedress line climbs to 5.4 million tons. At today’s prices it reaches 3.5 million. At $1,400 it collapses to 1.2 million. That is 4.2 million tons of UAN that never gets applied. That is the corn that turns pale green in July.
A note on what happens after June. Once sidedress closes, the nitrogen price ceases to matter for the current US crop. July is pollination, which is weather-driven. August through October is crop condition reports revealing damage that was locked in during April-June. The market discovers what biology already determined. The June-September ramp in global production loss is driven primarily by other regions (India’s kharif corn begins planting in June, SSA continues bleeding, Argentina’s next crop gets exposed at 12 months), plus the revelation of US damage through WASDE revisions. The US corn line actually flattens at -28 to -30 MMT from August onward. The continued global ramp is everyone else.
Gate 4: Harvest or abandon (September-November). Diesel at $6-7/gallon. Under-fertilized fields that yielded 120 bu/acre on marginal land may not be worth combining. Harvest costs run $35-45/acre at normal diesel, $50-65/acre at current levels. We estimate 2-5 million acres abandoned at the margins, though this gate has a self-correcting feedback: if corn prices have risen to $5.50+ by harvest, even weak fields become worth cutting. The price signal partially rescues this gate. Impact: 240-600 million bushels, partially offset by higher corn prices.
Gate 5: Ethanol demand pull (ongoing). This is the demand-side accelerant that makes the supply-side cascade worse. At $95+ crude, ethanol margins blow out. US plants running at 94% utilization push toward 98%. At full capacity, that is roughly 300 million additional bushels of corn demand. If E15 goes nationwide under political pressure from high gasoline prices, the ceiling is 500 million bushels. The EPA’s record-high 2026 RVO of 26.81 billion gallons creates a floor that does not flex with price.
The ethanol bid does not create corn scarcity by itself. But it tightens the balance at exactly the moment supply is contracting from gates 1-4.
Historical precedent
The yield response to fertilizer withdrawal follows a consistent hierarchy based on where an agricultural system starts on the nitrogen response curve. The US and EU sit on the flat part of the curve at 150+ kg N/ha. They can trim 20-30 lbs per acre and lose 3-8 bu/ac. Sub-Saharan Africa sits on the steep part at under 20 kg N/ha. Any reduction comes straight off yield because every pound of N they apply is still on the high-return portion of the curve.
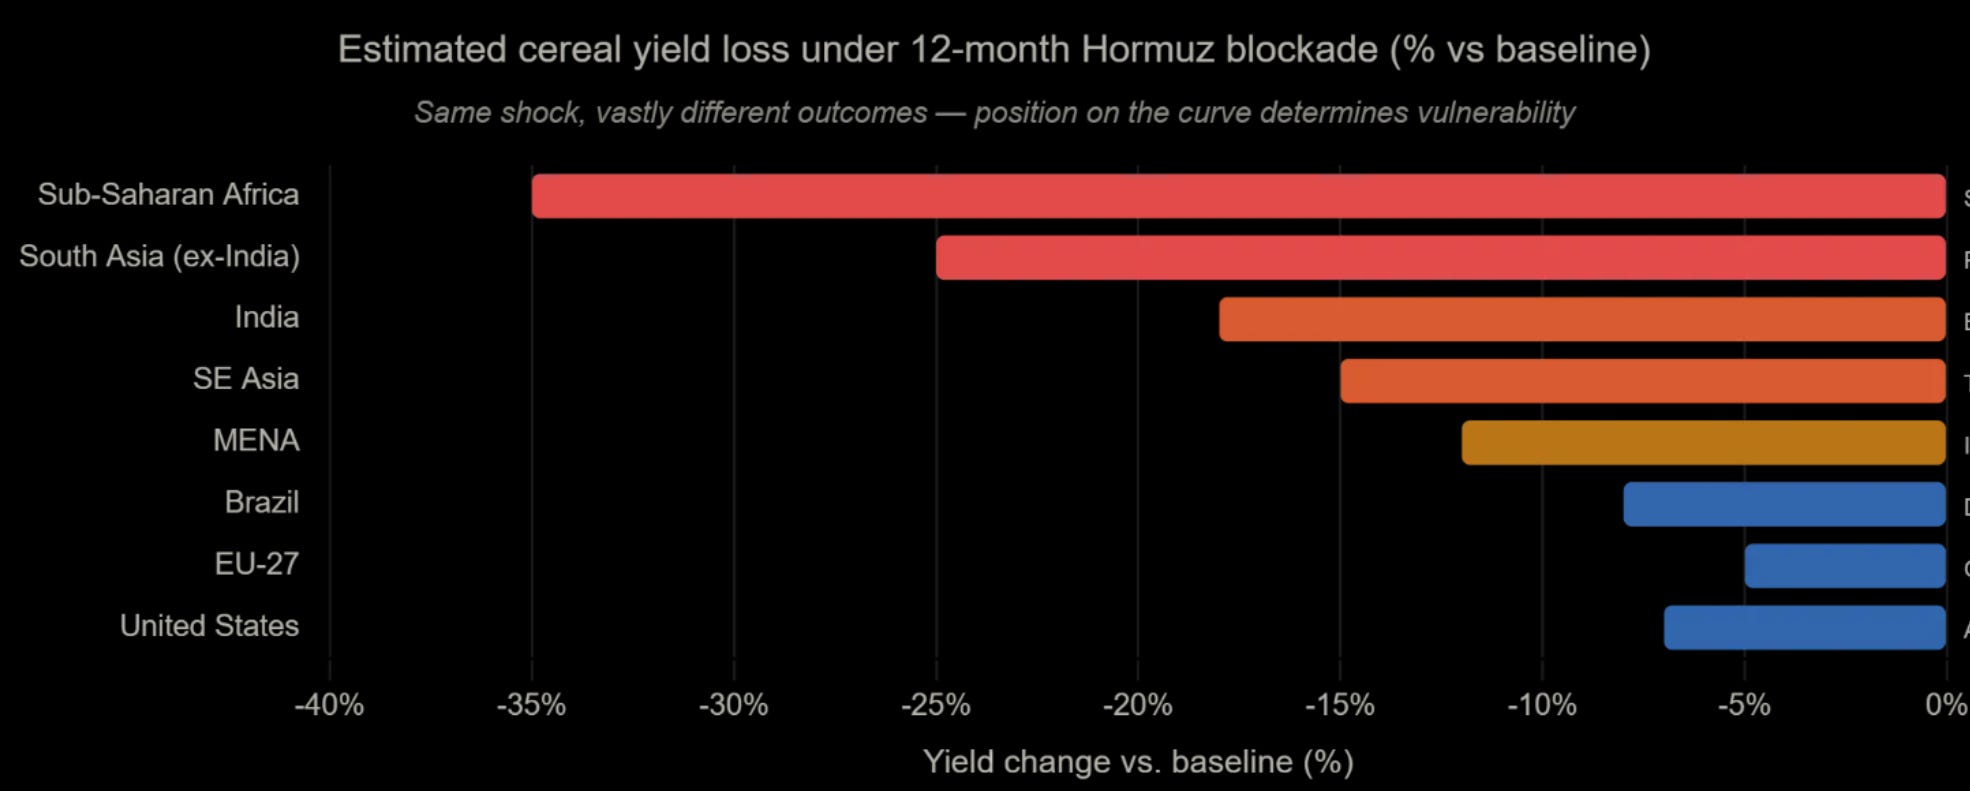
In 2022, the global fertilizer spike produced a 16% cereal production decline in East Africa but only 3.5% below-trend corn yield in the US. In Kenya, a 100% increase in fertilizer prices produced a 37-38% decline in maize production. Sri Lanka’s complete fertilizer ban in 2021 collapsed rice yields 20-32% and tea yields 27% in a single season, toppling the government. Zimbabwe’s currency collapse through the 2000s cut agricultural output 51% and tobacco 79% as farmers lost access to imported fertilizer.
The key difference between 2022 and today: in 2022, corn was at $7.50, so the N:corn ratio stayed at 0.14-0.16 despite ammonia at $1,600. Farmers could afford the nitrogen. Today corn is at $4.50 with ammonia at $924. The ratio is worse at a lower absolute nitrogen price.
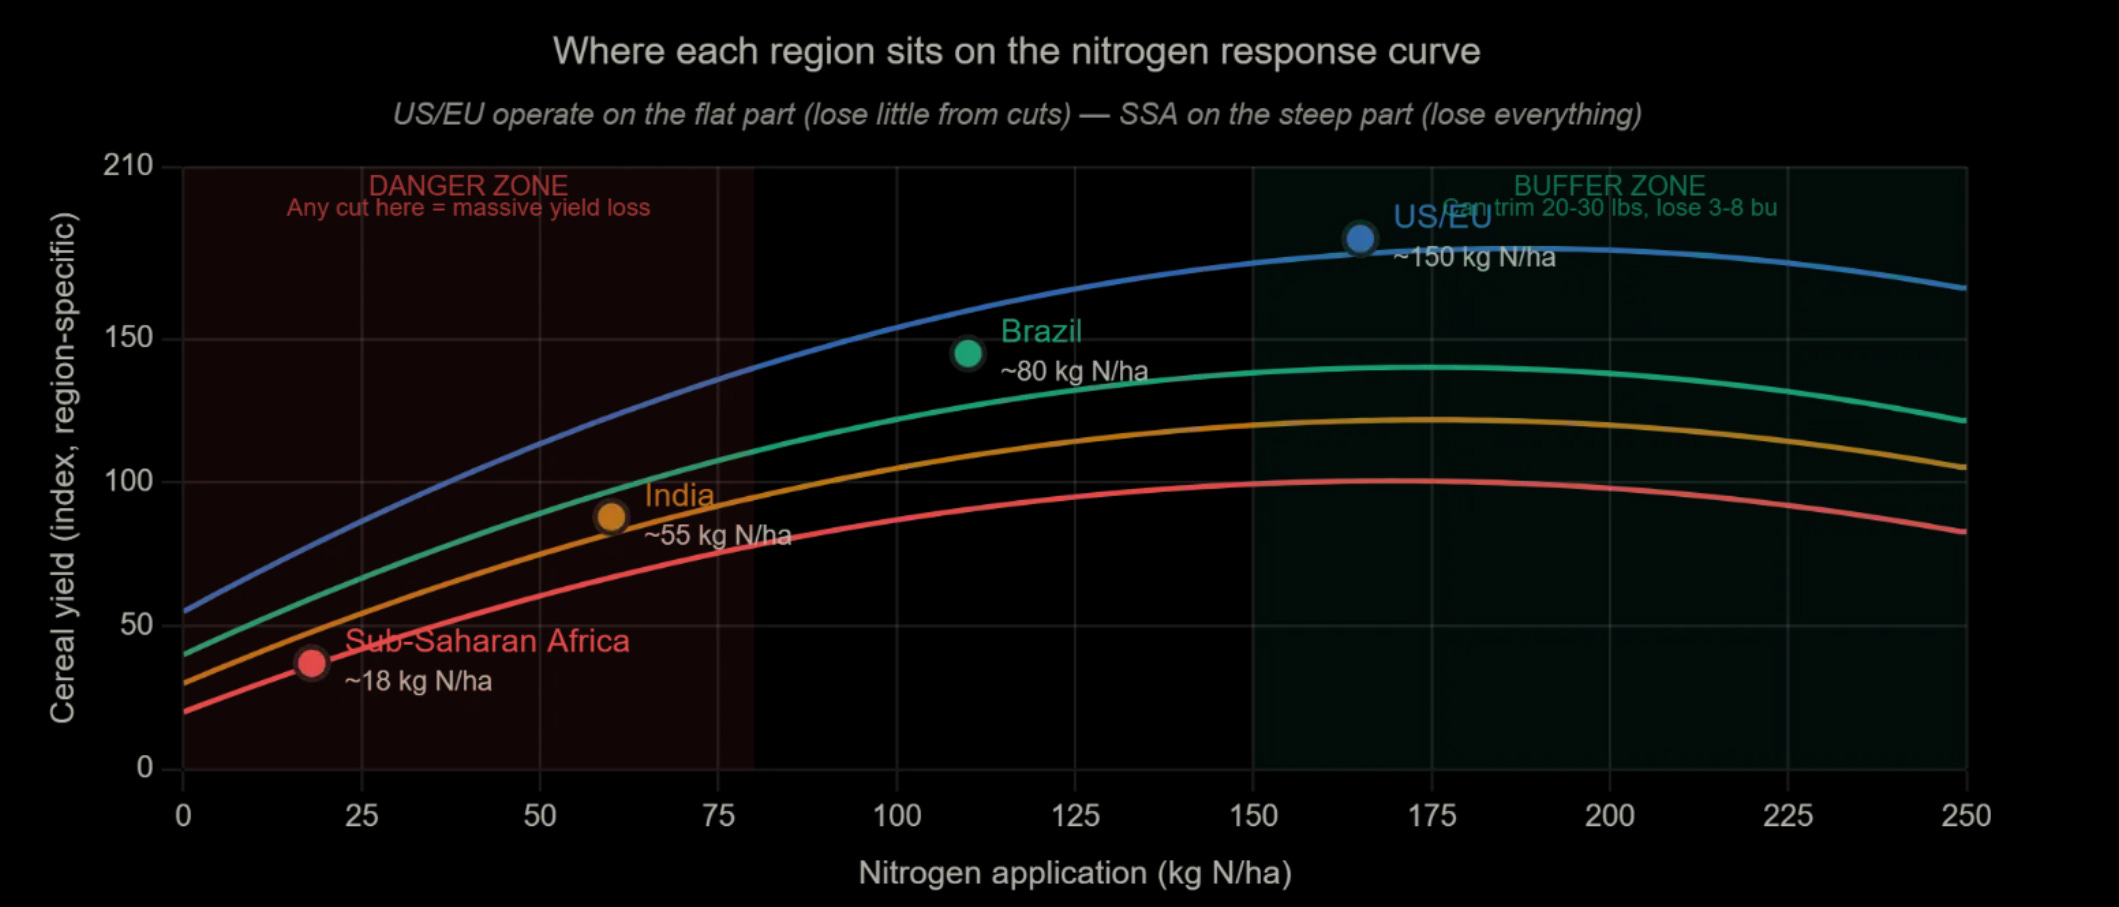
The global asymmetry is why the food security cascade generates MENA wheat panic buying. Developing countries cannot absorb the nitrogen shock. They bid for imports. That tightens global stocks and lifts prices for everyone. The US loses 7% of cereal yield. SSA loses 35%. Same shock, different position on the curve.
Scenario walk
Closed one month (through mid-May). Pre-plant nitrogen largely applied at elevated but manageable prices. Acreage loss limited to the 3.5-5M acres already in the Prospective Plantings data plus perhaps another 1-2M that shifted after the survey. Sidedress window still open. If ceasefire holds and nitrogen falls below $800 by late May, sidedress proceeds normally.
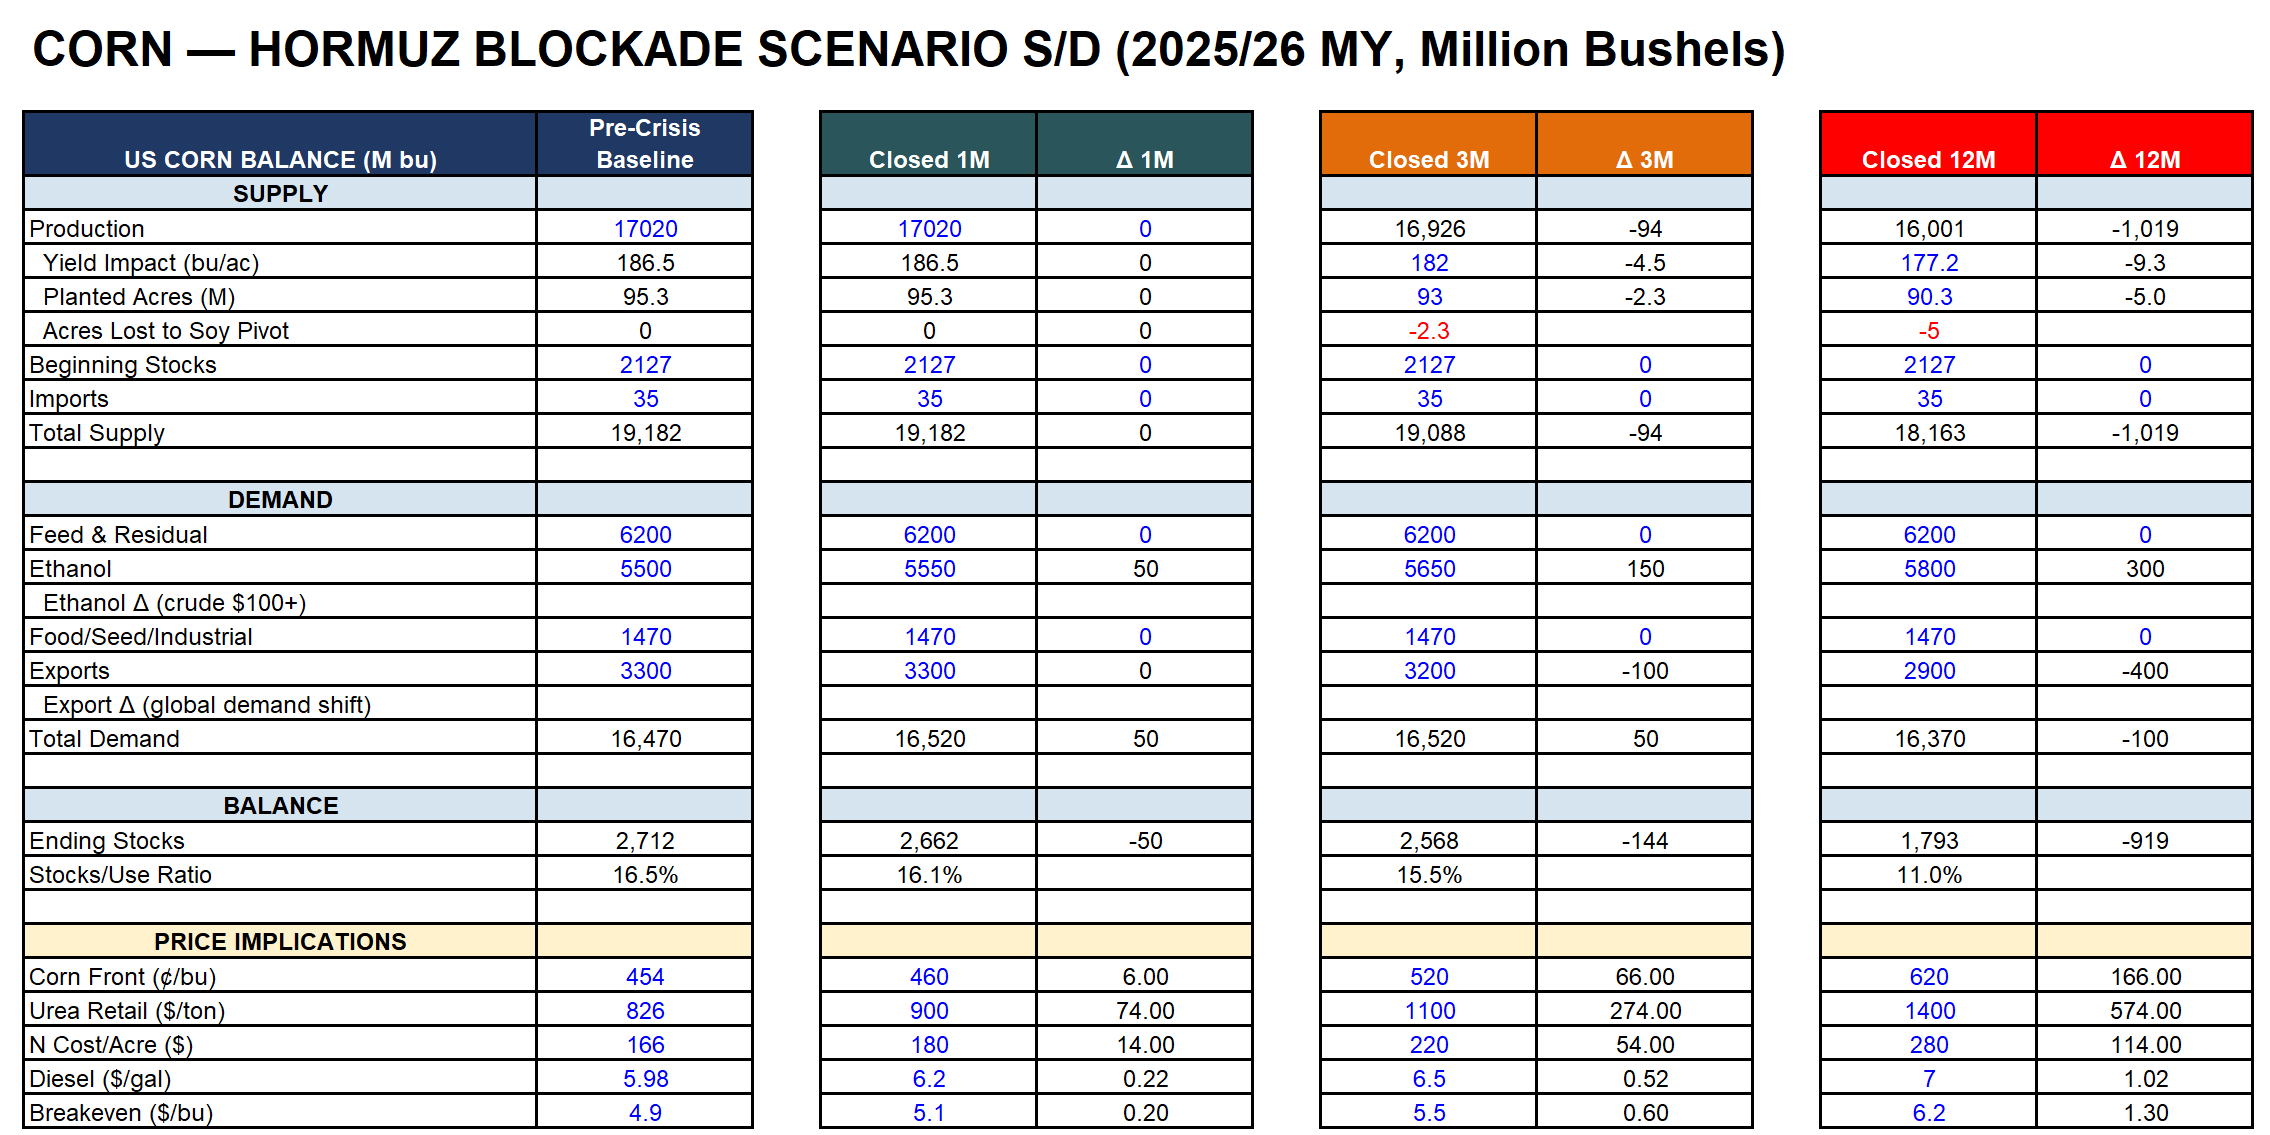
Production impact: 16.3-16.5 billion bushels (vs 17.0 baseline). The loss is 500-700M bushels, almost entirely from acreage exit at the margins. Ending stocks: 1,700-1,900 million bushels. Still above the 1,551M that supported $4.20 last year. Corn: $4.60-4.80. Our calls bleed theta.
Closed three months (through mid-July). The sidedress fork goes the wrong way. UAN above $600 in June. Fifteen to twenty million acres under-fertilized at sidedress. Pre-plant rate cuts locked in across 35M acres. Total acreage down 5-8M from baseline.
Production impact: 14.8-15.5 billion bushels. The yield hit reveals itself through crop condition reports starting late May, then WASDE revises in July. Ending stocks: 1,200-1,700 million bushels. At the low end, that is approaching the 2020/21 stocks-to-use of ~8% that supported $5.50+ corn. The contango flattens, potentially inverts if WASDE revises below 1,400M.
Ethanol adds 150-300 million bushels of incremental demand. Corn: $5.00-5.50 by September.
Closed twelve months (through April 2027). Full cascade plus second-order effects. Total corn acreage down 8-13M from baseline as 2027 planting decisions are made under persistent scarcity. Yield down 5-10% from trend on the acres that remain. Ethanol demand up 300-500M bushels at sustained $95+ oil.
Production impact: 13.0-14.5 billion bushels. Ending stocks: 600-1,000 million bushels. At 880M, that is a stocks-to-use ratio under 6%. The last time corn stocks were this tight relative to demand was 2012, when prices exceeded $8.00/bu.
This is the tail. The options we own are buying this tail.
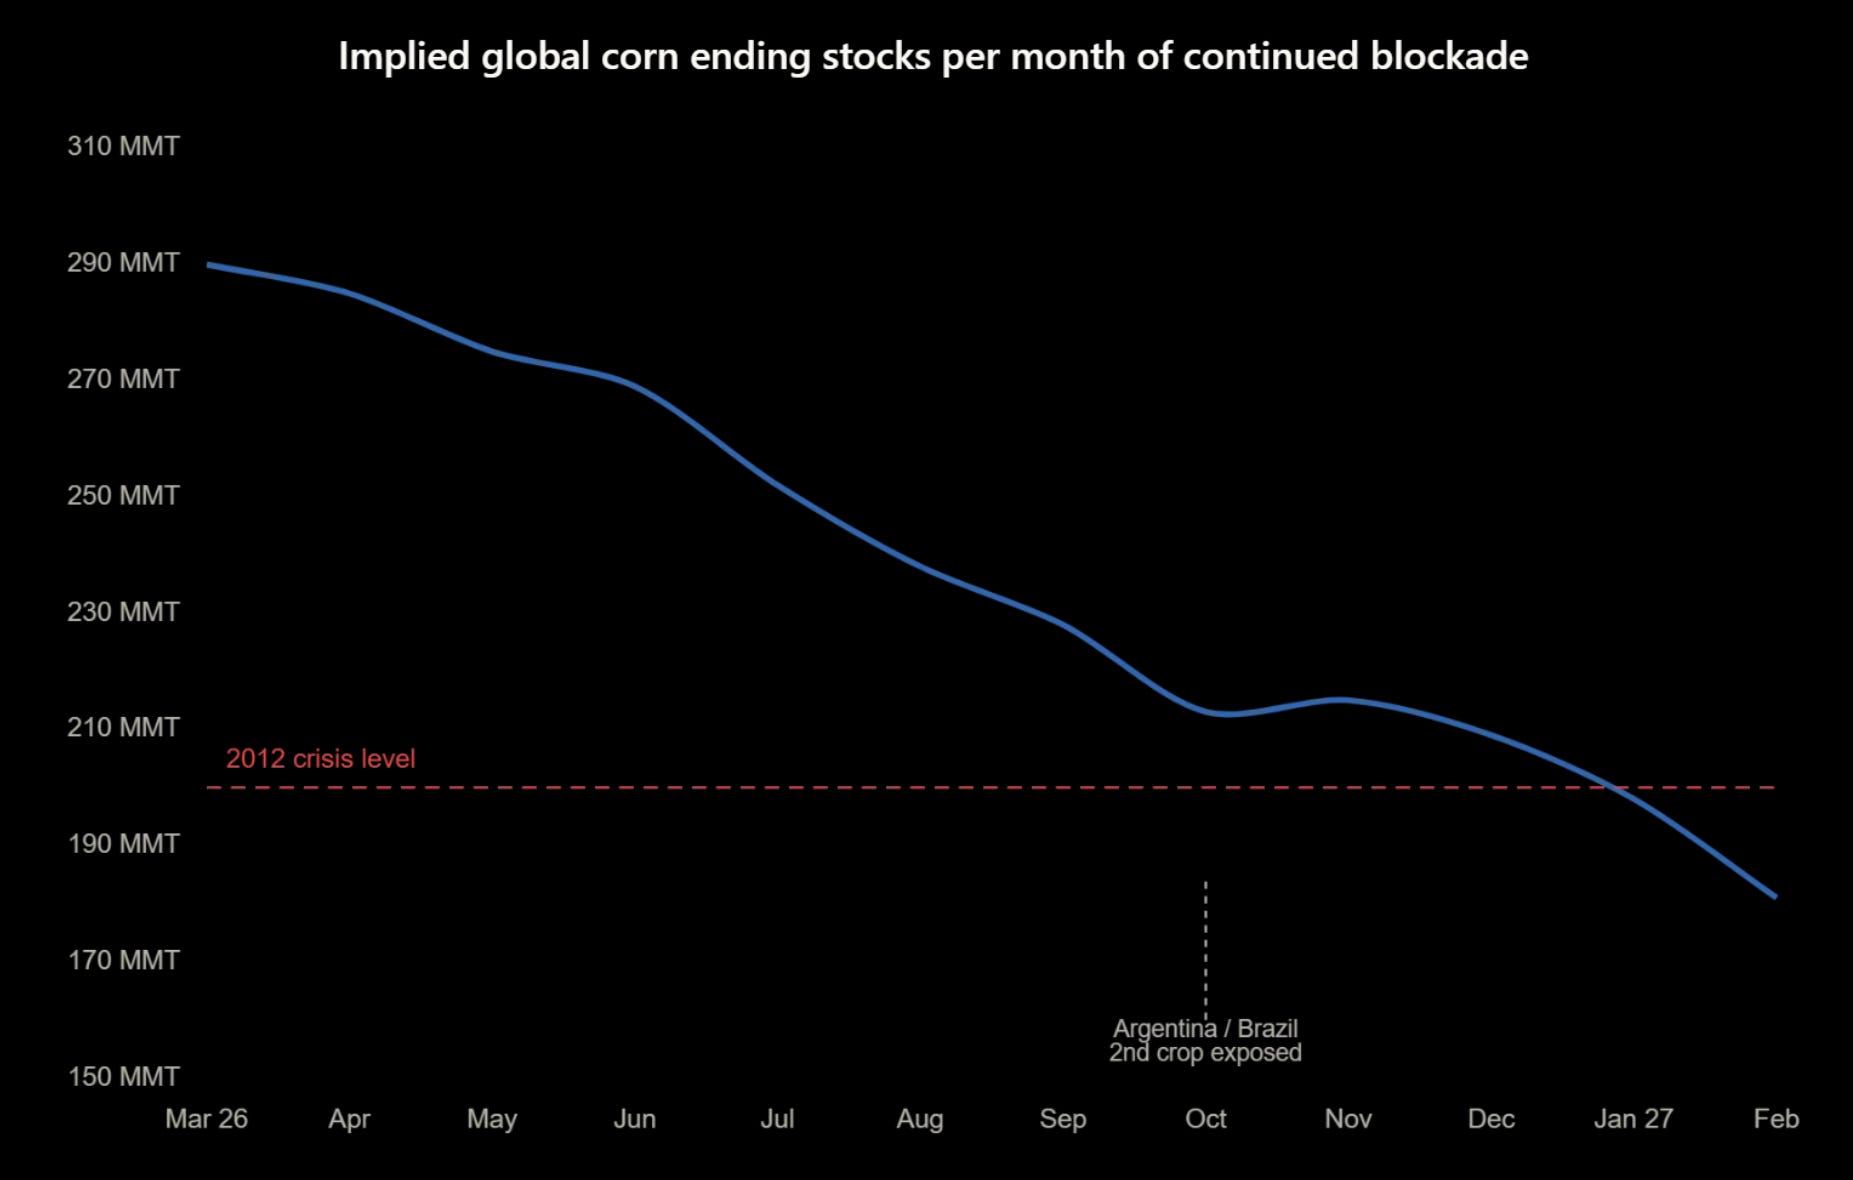
The global picture compounds the US story. At three months, total world corn production loss reaches roughly 18 MMT against 293 MMT of global ending stocks. Manageable. By six months, the loss reaches 65 MMT as the US damage ramps through pollination and harvest, SSA continues bleeding, and India’s kharif season is fully exposed. By twelve months, 112 MMT is gone. Global ending stocks drop from 293 to 181 MMT. For context, the 200 MMT level on the chart below is where global stocks sat during the 2012 drought crisis.
Positioning and vol
Speculative funds are net short corn. This is the consensus position for a record-supply environment and the market is not wrong about the current balance. What the positioning tells us is that the repricing, when it comes, will be violent. Spec shorts covering into a market that is simultaneously receiving bearish-to-bullish WASDE revisions is how you get 20-30% moves in weeks rather than months.
Corn ATM implied vol sits around 24.4%, roughly in line with 3-month realized. There is no premium being charged for the blockade scenario. Compare this to wheat where IV has expanded to 26-30% across the surface. The options market has decided corn’s surplus protects it. We disagree for the reasons above, specifically around gates 3-5 which have not been priced.
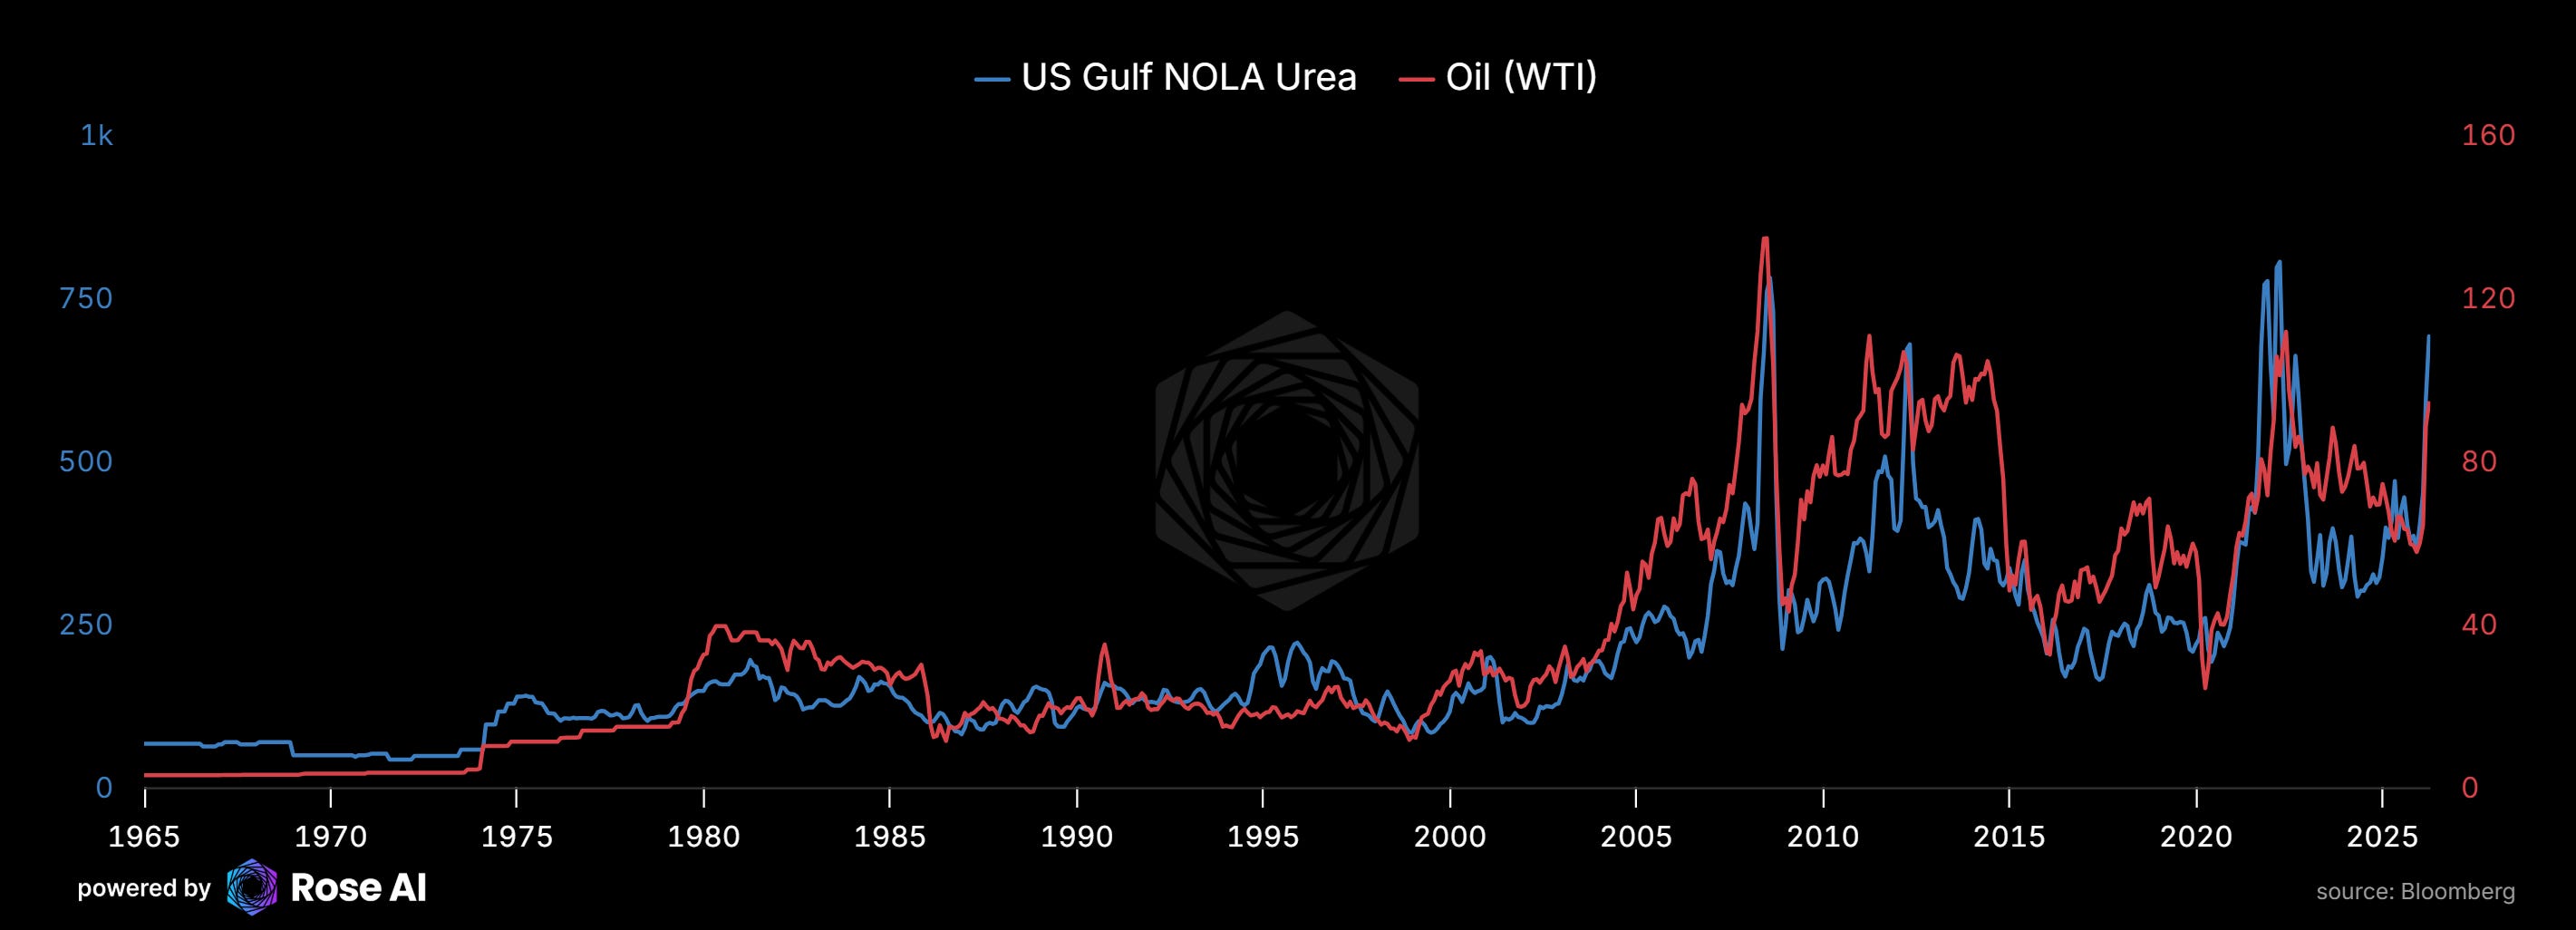
Dec corn (Z6) at 481 implies the market expects modest new-crop tightening but nothing dramatic. The 525 strike sits about 9% out of the money with 8 months to expiry. In a normal year this is a lottery ticket. In a year where 21 million tonnes of nitrogen capacity is physically offline and the sidedress window opens in two months, it is priced too cheap for the scenario it captures.
The vol work tells us something else. Corn realized vol has historically spiked to 35-50% during genuine supply shocks (2012 drought, 2020 demand shock, 2022 Ukraine). The current 24% implied assumes none of that. If the WASDE revises yield down 5+ bu/acre in July and realized vol expands to 30-35%, the Dec 525C reprices significantly on vega alone before delta kicks in.
We have half the corn allocation in vol (straddles and strangles closer to the money) and half in upside (the Dec 525C and some Dec 550C further out). The vol position profits if corn moves in either direction. The upside position needs gates 3-5 to trigger.
The trade
We hold Dec corn 525 calls. They are underwater. We are early. The thesis requires patience through gates 1-2 (where the market sees the acreage data but not the yield implications) and then confirmation at gate 3 (sidedress).
At current IV, the Dec 525C costs roughly 12-15 cents (as of writing, it has probably moved!). If the full cascade triggers and corn reaches $5.80-6.20, the 525C is worth $55-95 in intrinsic value alone. The risk/reward is asymmetric by construction.
What could go wrong: if the ceasefire holds and nitrogen prices normalize by June, sidedress proceeds, yield loss is limited to 3-5 bu/acre from pre-plant rate cuts, and ending stocks land at 1,700M. Corn trades to $4.80-5.00. Our calls expire worthless but the loss is capped at premium paid, and the SONIA position should offset on the peace scenario.
This is the inherent convexity of the cascade structure. Even in the most optimistic scenario, Hormuz will take time to normalize. Energy prices will remain elevated for months, not weeks. The flow-through to fertilizer prices has already happened and will not reverse on a handshake. High diesel at $5.98 leads to abandoned marginal fields. Ethanol economics pull corn off the food market to supplement refined products. We want to continue owning these even if we get peace in the next couple of weeks.
What to watch
Today, April 14: Crop Progress report (4pm ET). Corn 3% planted last week. First reading with a full week of planting activity since the blockade announcement. Watch planting pace vs five-year average and any early state-level divergence.
April 22: Ceasefire expiration. The most important binary for the book. If the blockade continues, the probability of UAN above $600 in May rises sharply and gate 3 tilts toward skip.
May 9: May WASDE. First report with USDA’s official 2026/27 new-crop balance sheet. They will use Prospective Plantings acres (95.3M) times trend yield (~181). The market will compare that to its own acreage estimates. If traders think actual acres are 91-93M, there is an immediate disconnect to trade against.
Weekly through May: USDA AMS fertilizer prices (Thursdays). Track UAN28 retail specifically. The sidedress purchase window opens in five weeks. The trend line from now to then determines gate 3.
May 19: Crop Progress. By this date, 55-70% of corn should be planted in a normal year. If the pace runs 5+ points behind the five-year average, acreage loss is real and the June 30 Acreage Report becomes a potential catalyst.
Late May: UAN spot price. The trigger. If UAN is below $500, sidedress happens. If above $600, the skip probability jumps to 60%+.
June 20: V8 cutoff. After this date, sidedress nitrogen does nothing. The yield is biologically locked. Whatever was applied is what the crop has to work with through pollination.
July WASDE: First yield revision. This is when the market discovers what was locked in during April-June. If USDA revises yield below 180 bu/acre (vs 186.5 trend), the repricing is immediate and the Dec 525C starts working.
The damage is locking in now, on biological and chemical timelines the market does not track. The repricing comes later.
Conclusion
The cascade runs on calendars and chemistry. The rimland strategy handles crude and the dollar. It does not handle what crude feeds, what fertilizer grows, or what happens when 21 million tonnes of nitrogen capacity disappears during planting season.
Sugar is ticking now. The crush started April 1. Every UNICA report either confirms or denies the ethanol diversion. We hold call spreads with 6.8:1 payoff and $213 max loss. The data arrives in weeks.
Wheat was ticking before the blockade started. Smallest crop since 1919, worst conditions since 2022, and a MENA demand bid that compounds with every week the strait stays closed. We bought futures because the vol surface was charging too much for options. The KC-Chi spread tells us whether the bid is accelerating.
Corn is the longest fuse and the biggest payload. The surplus buffer is real. The options are cheap because the market believes the buffer protects it. We think the sidedress gate in June determines whether the buffer holds. May UAN spot is the single most important data point in the cascade.
The ceasefire expires April 22. The WASDE publishes May 9. The sidedress window opens in June. The calendar does not wait for diplomacy.
We remain long the cascade.
Disclaimers
This analysis was built over several days of active markets. Prices, curves, vol surfaces, and positioning data reflect the time they were pulled, not the time you're reading this. Some of these levels will have moved by the time you see them. Do your own work. Check the chain before you trade. The price on your screen when you lift the offer may look nothing like the price on mine when I wrote this up.
a masterpiece of wide + deep knowledge, with great logic and projection. thank you!!
Much appreciate the analysis and insight down to trading. Have yet to comprehend the Dec corn calls and payoffs. If these are the Nov 20 calls on Dec’26 Futures, their breakeven shows up only after > $520 . What am I getting wrong?