

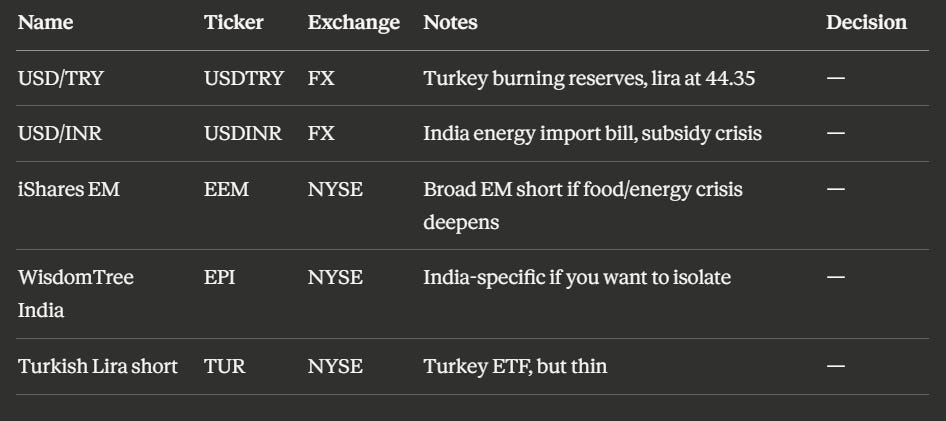
The Cascade Trade
Three carbs and diet bonds

You do not need to know whether Trump chooses war or peace to make money in markets.
You need to know what the market has priced and what it hasn’t.
Peace is linear: bounded, visible, mostly priced. War is exponential: the market prices each broken node with a lag. That is the trade.
This piece is dense. The short version: we’re buying call options on corn, wheat, and sugar, hedged through European and UK front-end rate options. If war escalates, the food trades pay 10-30x. If central banks blink, the rate options cover the cost.
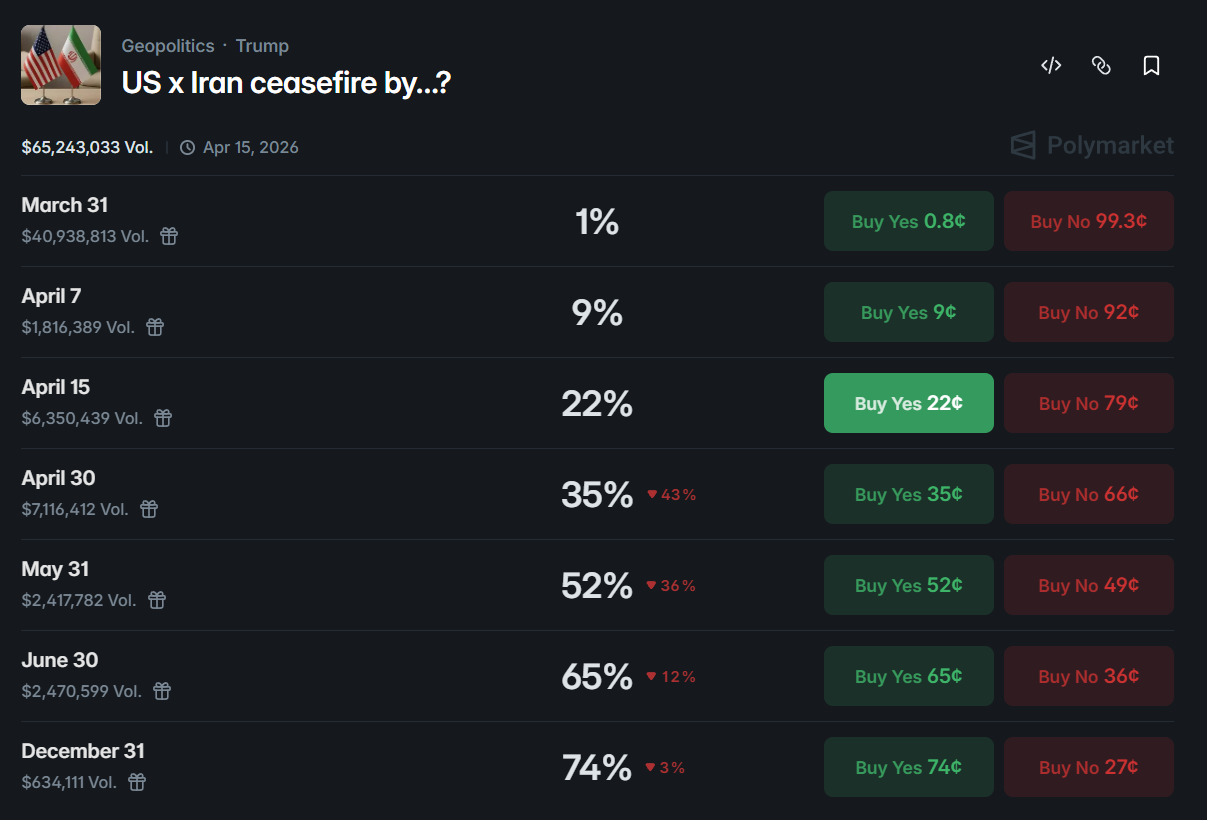
Betting markets give a ceasefire by end of April less than a 30% chance. The grain calls sell insurance against a cascade that the market itself doesn’t expect to resolve quickly. That also means assets aren't priced for a quick resolution. A peace deal that reopens the strait would reprice violently in the other direction.
Where the Value Is (and Isn’t)
Different markets are pricing different wars. If rates and commodities are right, equities aren’t down enough. If equities and commodities are right, long rates haven’t risen enough. If equities and long rates are right, the short end of the curve is unreasonable and central banks won’t tighten this much. That inconsistency is the opportunity.
Let’s start with the market on everyone’s home screen: oil.
Spot energy and first-order oil trades appear mostly priced. We have about 60bps of June 85/95 call spreads we picked up for ~30bps after the front end collapsed from 120 to sub-$80 a couple of weeks ago.
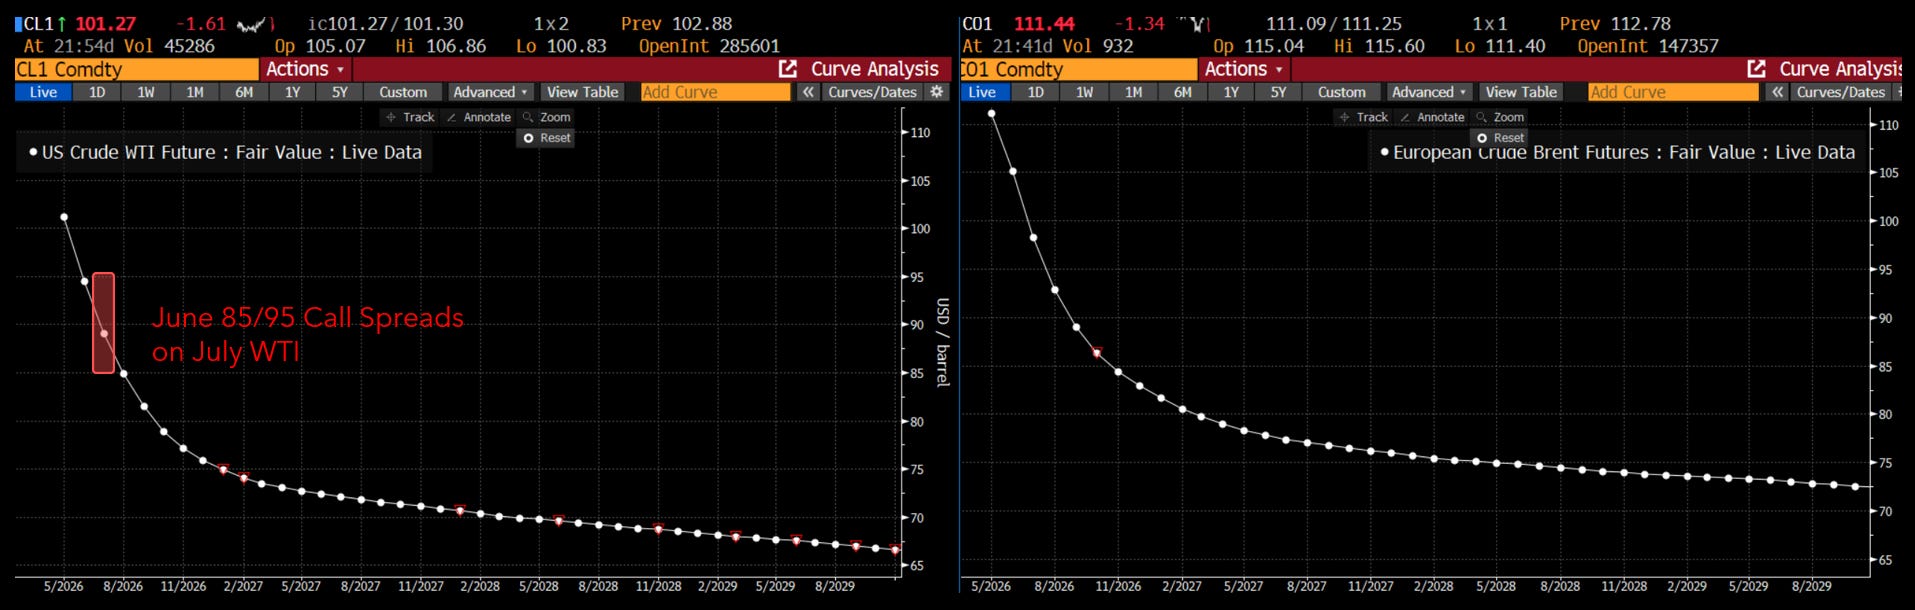
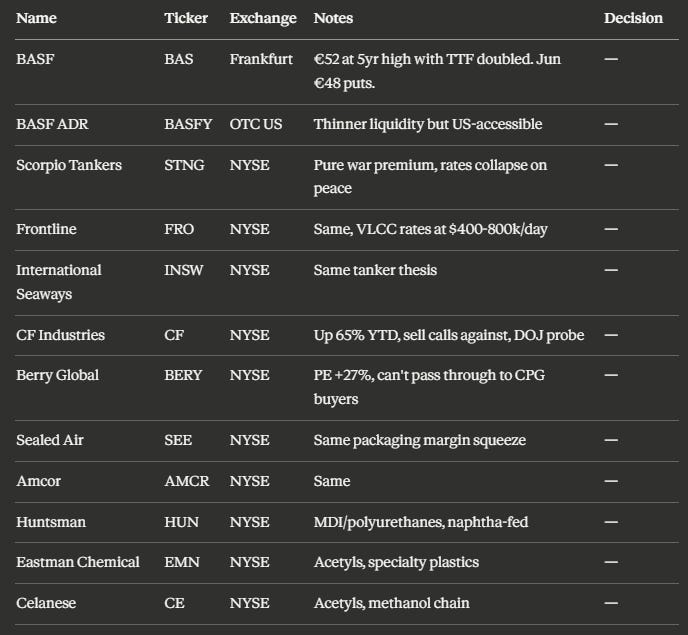
They’re mostly trading at intrinsic given the skew, and they give the book a little direct sensitivity we’re happy to hold, but there’s not that much value here anymore. At this point everyone who wants oil exposure has it. CF Industries is up 65% YTD with a DOJ probe. Tanker stocks have doubled on rates that collapse the moment a ship transits. Many of these positions are expensive if not outright sells.
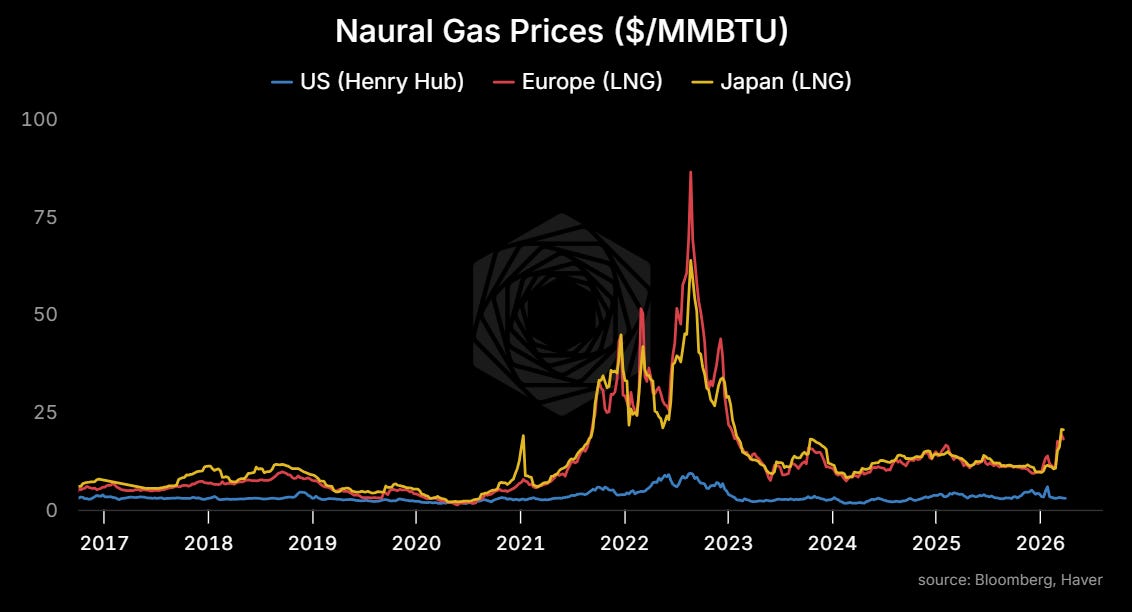
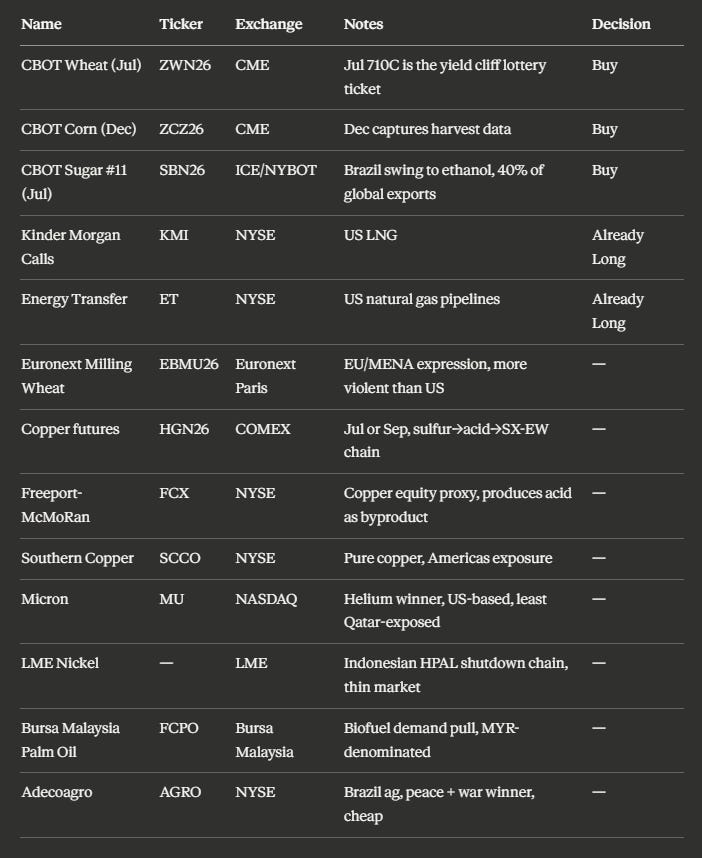
Structural US energy advantage is where it gets interesting. The spread between Henry Hub and international LNG is the widest since Ukraine because the US is already exporting as much natural gas as its infrastructure allows. We think US LNG exporters and pipeline companies benefit whether Hormuz reopens or not. The world has just learned that Gulf energy infrastructure can be destroyed by precision strikes, which should provide a backdrop for investment into this space. Regular readers will know we’ve had positions in Kinder Morgan (KMI June 38 & 40 calls for 22bps of book in premium), NextDecade (NEXT shares, 34bps), Energy Transfer (ET shares, 33bps) and DOW Chemical (DOW shares, 18bps) for a couple of weeks.

The offsets everyone cites are temporary. If the strait stays closed or disruptions get worse, the oil shock is enormous relative to anything the market has priced. But again, more oil. The US Energy ETF XLE has been going up in a straight shot for this reason. This isn’t where the edge is.
Fertilizer to Food (Node 2): underpriced. The grain market has moved maybe 10-15% of the terminal price impact from yesterday’s yield cliff model. The damage is invisible until harvest, five months away. This is where we want to be.
Industrials (Node 3): unpriced but maybe too early. Copper is flat-to-down while 9-14% of global supply faces physical shutdown from sulfuric acid shortage. The sulfur-copper linkage is the one to watch. If copper sells off strongly we’ll likely open a position, but we think the market may still want to sell copper on the demand story before folks catch this nuance.
Three Grains, Three Channels
A lot of folks think of me as a “commodities guy” but I certainly wouldn’t call myself an agriculture guy. More everything but (energy, metals, critical minerals). There are people at Cargill and the big trading houses who have forgotten more about trading ags than I have ever known.
That being said, when we look at the market with an eye for convexity, I kept coming back to the stuff that needs a lot of fertilizer in the ground at very specific times or things go bananas.
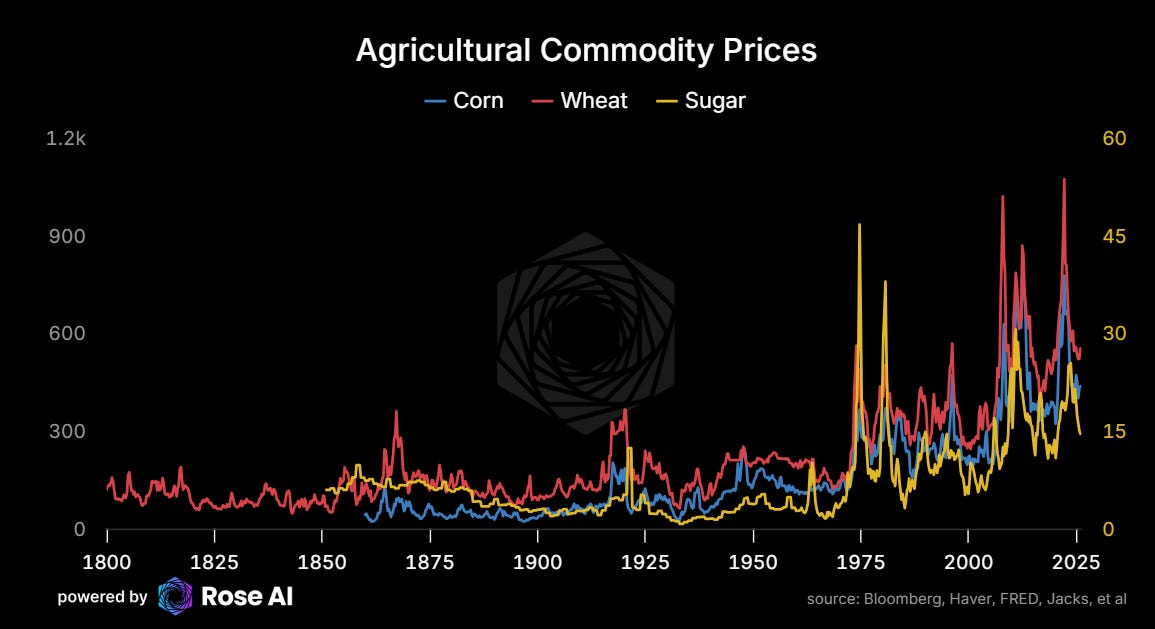
Without a deep view on any one of these particular markets, we want the basket: corn, wheat, sugar. Each captures a different node of the cascade. The market has started to price one of them (wheat). It hasn’t touched the other two.
Corn has three independent legs that compound. First, nitrogen: corn takes 150-180 lbs per acre vs wheat at 60-100, so at $931 urea, the cost hits corn acreage first and hardest. USDA Prospective Plantings drops Tuesday and that’s where a nitrogen-driven acreage shift shows up. Second, ethanol: 40% of US corn goes to ethanol under the RFS mandate. At $120 crude, corn can go to $8.80 before ethanol demand destruction. At $150, the ceiling is above $10.50. The same event that causes the nitrogen shock pulls the demand ceiling up. They compound. Third, you can’t replant corn in August. The Hormuz cascade vol sits on top of seasonal weather vol (pollination in late June/early July). Two independent variance sources in the same contract. (The full vol analysis and strike selection math are in Appendix A.)
Corn sold off late today ahead of the USDA report. If the report shows nitrogen is pushing farmers out of corn, that’s the first confirmation of the supply leg.
Wheat is the global food security commodity. MENA and EU import calories as wheat, not corn. When the cascade hits headlines, wheat is where the panic premium lands. Wheat gapped $13 to $618 on the Sunday open after the Houthi news. Faster fuse, more expensive entry.
Sugar runs through Brazil. Mills choose between sugar and ethanol every crush season based on the price ratio. At $150 oil, the economics flip to 55-60% ethanol, pulling 10-15 million tonnes off the global sugar export market. Brazil is 40% of world sugar exports. Two independent expressions of the same oil-to-food cascade, running through different countries’ agricultural systems.
The Trades
Corn December 525 calls. Options on Dec futures (ZCZ26, currently ~482), expiring in June (87 days). Around 9 cents at the ask. $450 max risk per contract. Strike is 8.9% above the Dec contract. Base case (+30%): corn to ~$627, call pays ~11x. High case ($150 oil): corn above $800, call pays 32x+.
Wheat July 710 calls. Around 17 3/8 cents at the ask. $869 max risk per contract. Wheat Jul futures at ~621, strike 14.3% above spot. Why $7.10 and not $6.50? Wheat has already moved. The $6.50 is only 5% above spot, mostly delta, not convexity. Open interest at $6.50 went from nothing to over 1,000 contracts in March. The $7.10 is genuine optionality. If wheat runs to $9, the call pays ~11x.
Sugar July 18 calls. Around 0.23 cents at the ask. ~$258 max risk per contract. Sugar Jul at ~15.67, strike 14.9% above spot. At $150 oil, sugar above 25 cents, call pays ~30x. At $200, sugar past 30 cents, 52x.
Total grain premium: ~$1,560 per set of three options. Three independent cascade channels. Three independent catalysts. Scale to your needs.
The Peace Hedge
The grain side is relatively clean. Oil is up. There’s a supply shock in fertilizer. US agricultural markets aren’t pricing in sustained pain. Buy calls. Pretty simple.
The other leg is where the problem gets harder, and where we really struggled to find something that had the right directional properties, the right risk properties, and the right liquidity.
TLDR, in the end, we bought bonds. Lol.
The first version of this post spent a lot of time trying to be too cute. Buy options on X to profit if Hormuz stays closed, sell options on Y to cover the cost if peace breaks out. Came up with some plausible constructions that lasted right up until the markets opened. No perfectly hedged trade survives first contact with a messy open.
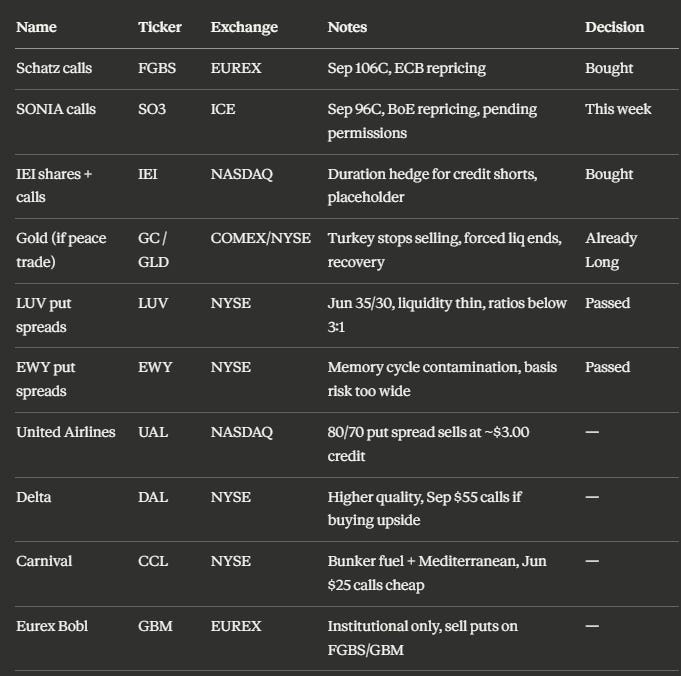
We came close to selling put spreads on airlines (LUV) and Korean equities (EWY). Not to say these are bad trades, and we still might do them. But the more we looked, the more we felt we weren’t selling expensive options, just fairly priced ones with a decent chance of leading to losses. The basis risk (oil up, ags flat) was enough to walk away. (Full walkthrough in Appendix B.)
Which brought us to rates.
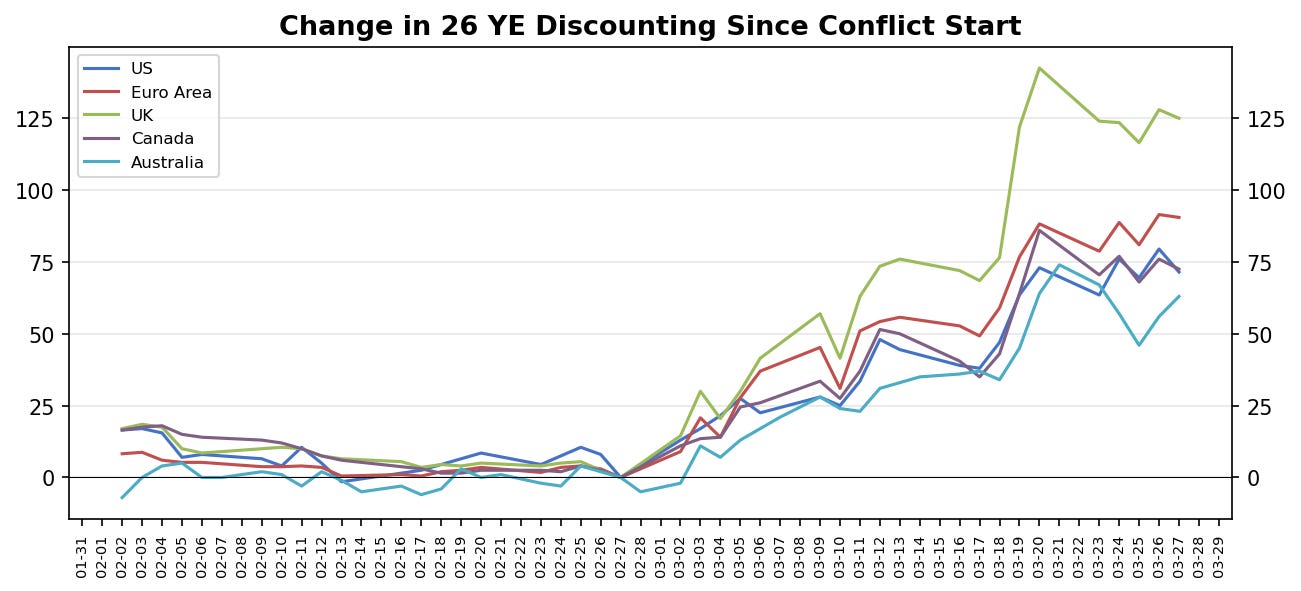
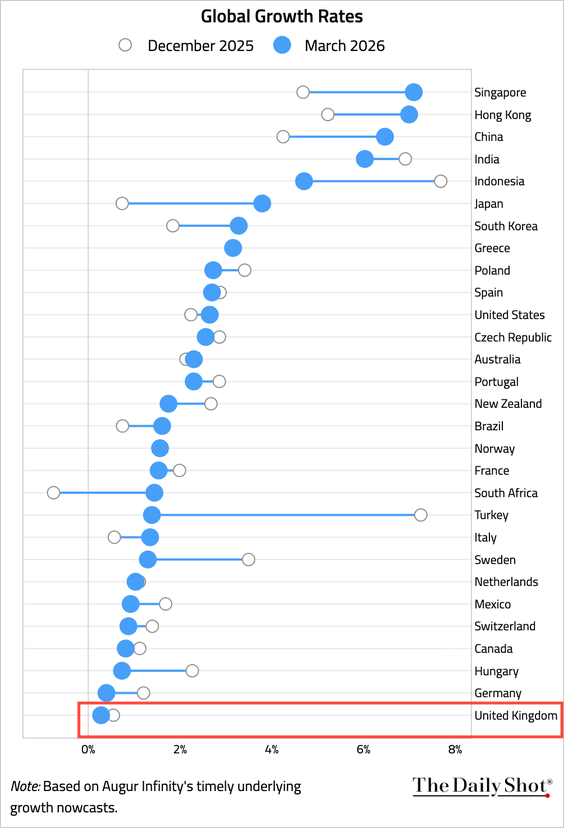
The bond market in Europe is not loving this whole oil/energy thing. So much so that it moved, quickly, from pricing in a decent amount of easing to pricing in a bunch of hikes. Particularly in the UK, where not only was the move most pronounced, but the economy was already pretty weak.
Then, as we were searching for the trade, our old friend and short rates guru Jason Rotenberg published: My Nomination for a Peace Hedge: UK Front-End Rates. He says it better than I can. Go read his version. The short version:
The Bank of England was priced to ease 50 basis points and is now priced to tighten 75 basis points. That’s 125bp of repricing in a month, into the weakest economy in the G7. If this resolves, that unwinds fast. If it doesn’t resolve but the growth shock dominates, rates still come down.
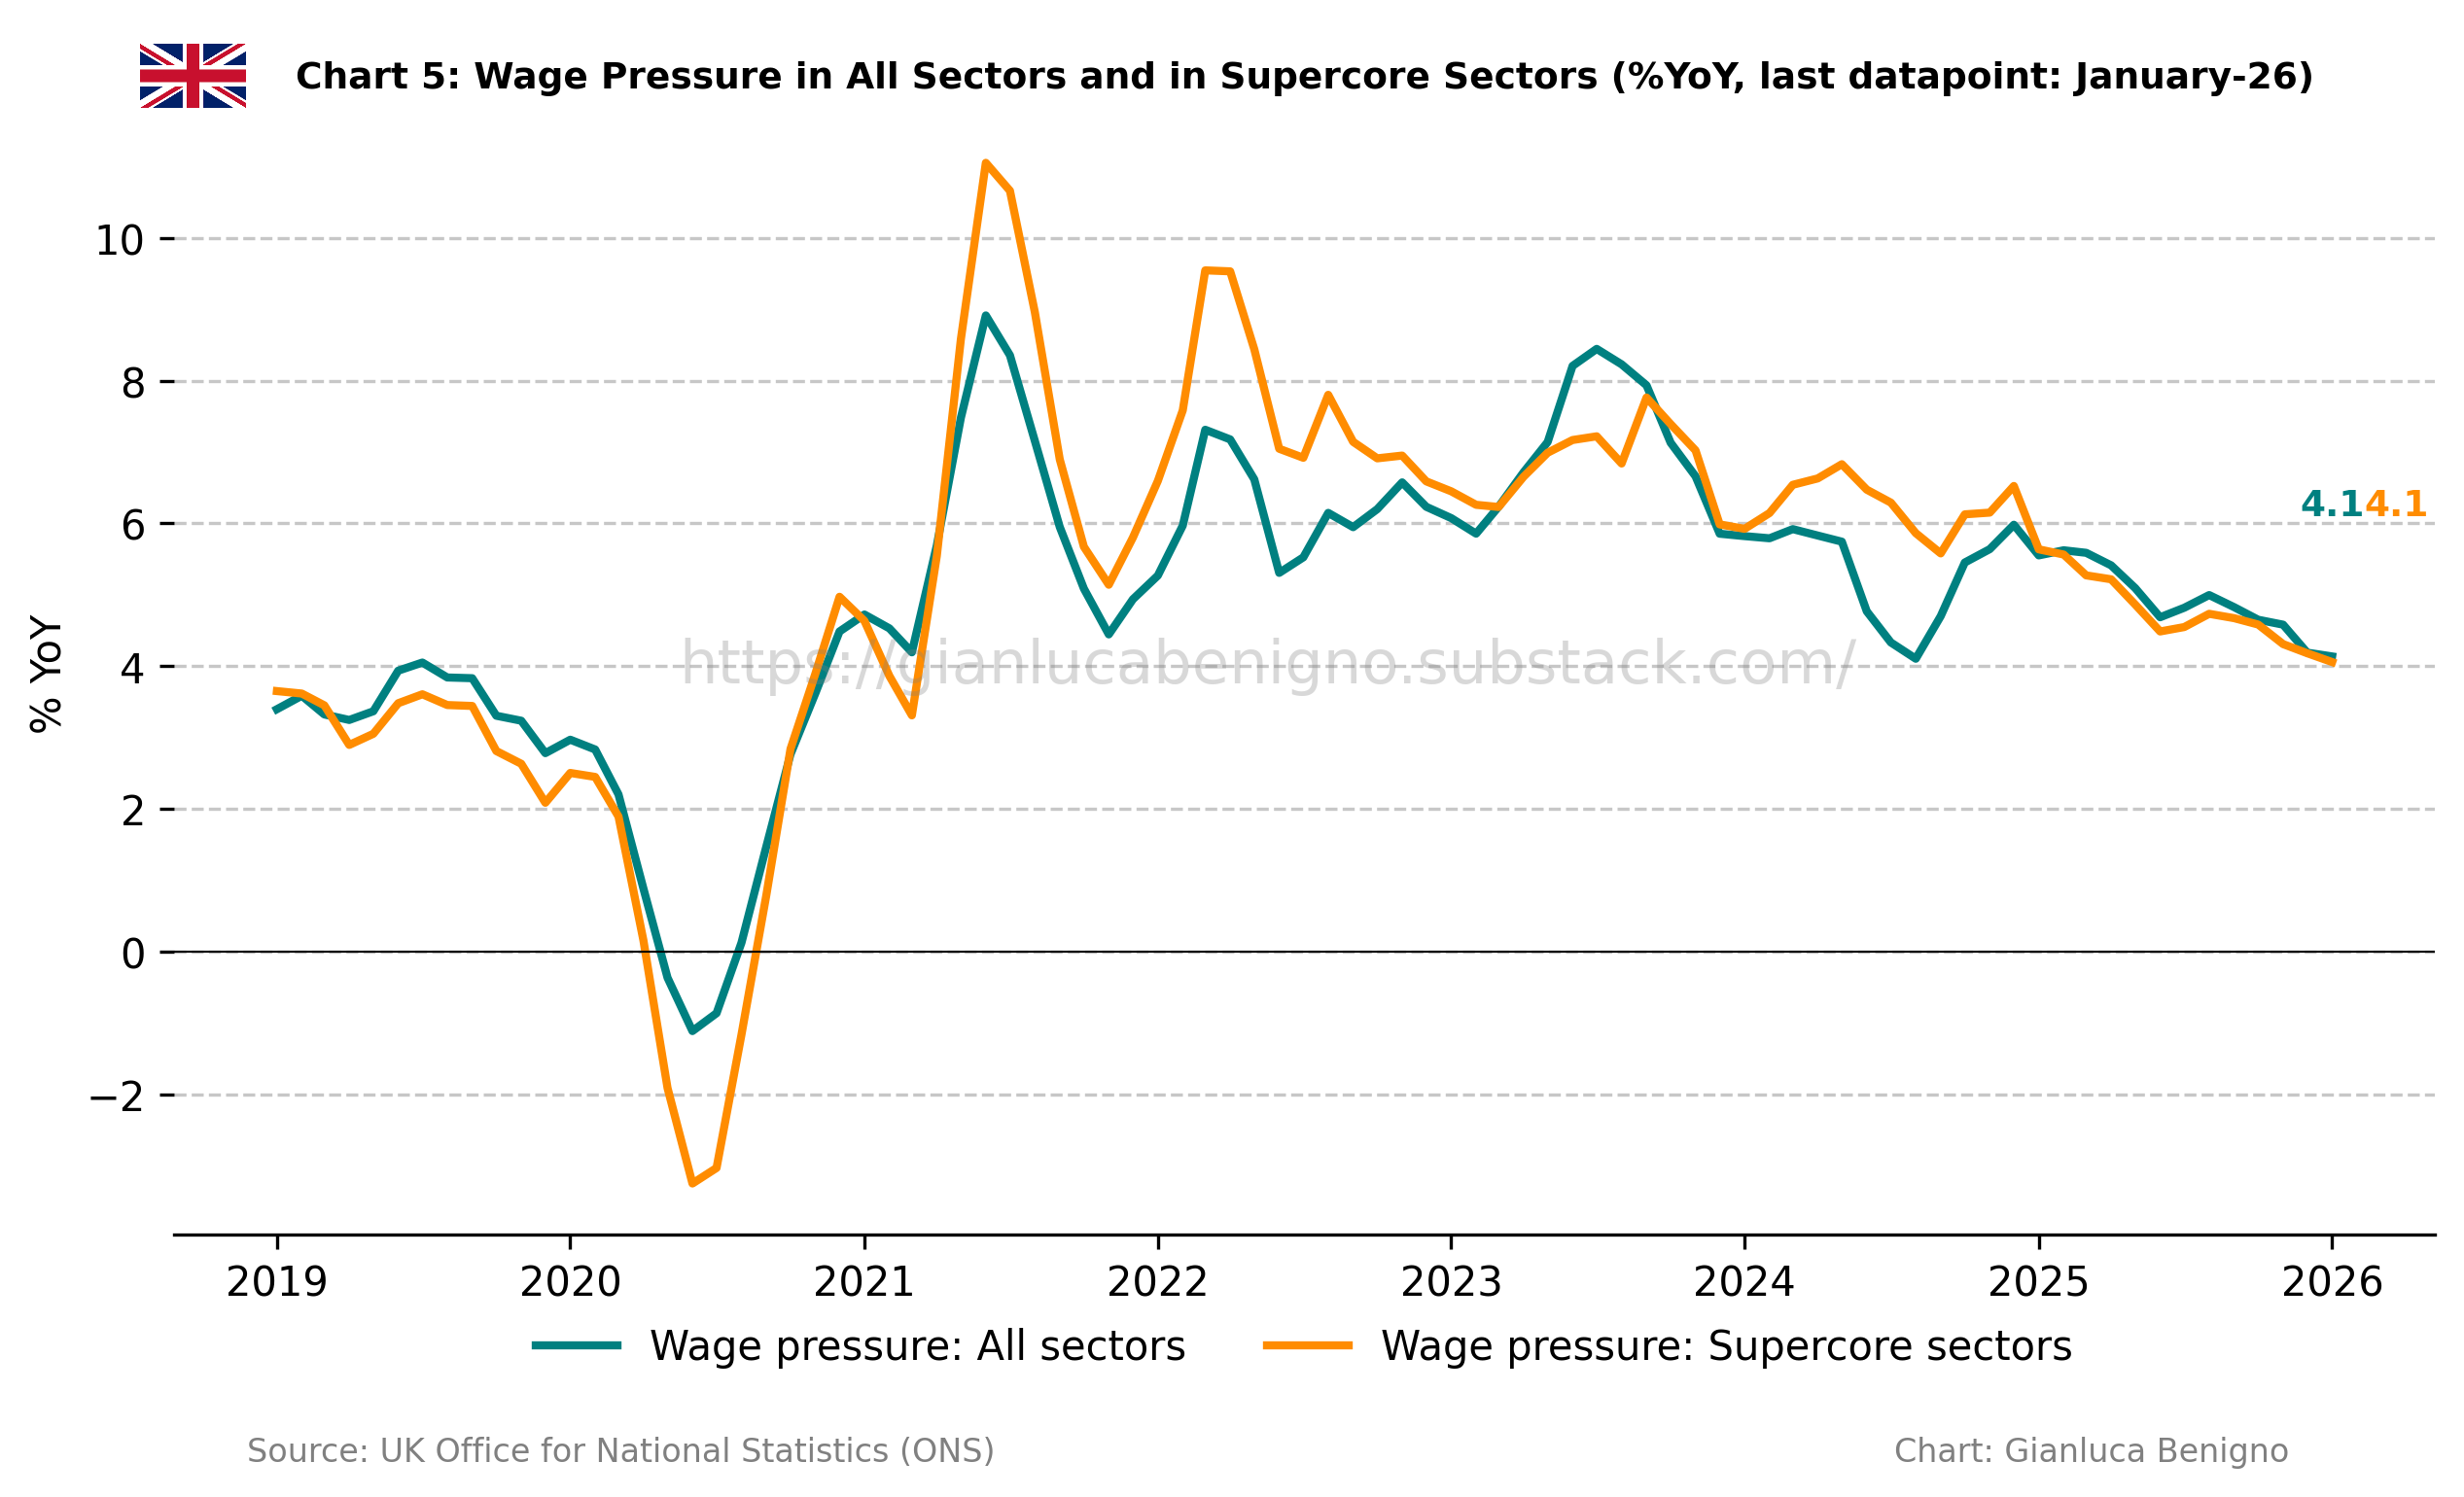
UK wage pressure has been falling steadily. The BoE would be fighting the last war. An energy supply shock is not demand-pull inflation. You don’t tighten into an external cost shock when your economy is running on fumes.
We wanted to buy SONIA options on ICE. The instrument that sits at exactly the point on the UK curve where the mispricing lives. And then we realized our ICE Futures Europe permissions weren’t even enabled. “The machine is down,” as we say. We submitted the request. It’s pending.
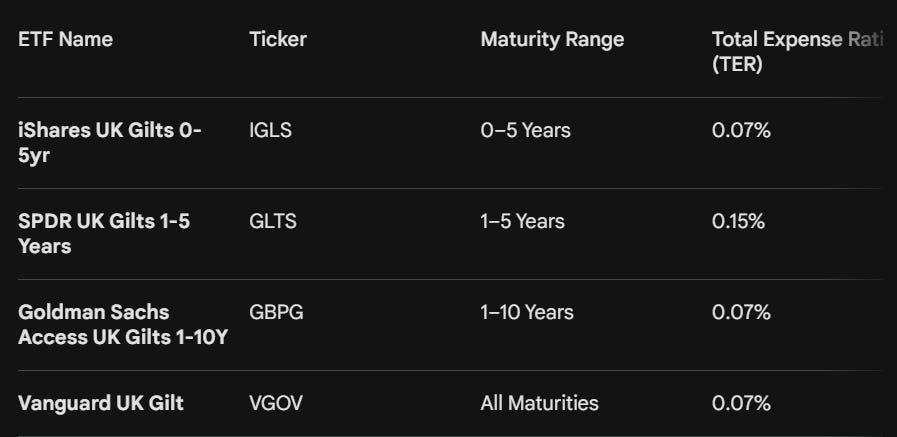
In the meantime, we bought Schatz (German 2-year bond) Sep 106 calls on Eurex for roughly 80bps, and some intermediate US Treasuries (IEI) as a bridge because the duration hedge to our short credit trade had rolled off. It’s boring. It’s a placeholder. It gets replaced by SONIA when permissions clear. For those trading at home, who are ok with the currency exposure (a big if), there’s a couple of retail ETFs you can look into.
The honest summary: the grain book is on and we’re confident in it. The peace hedge is being built this week.
The Structure
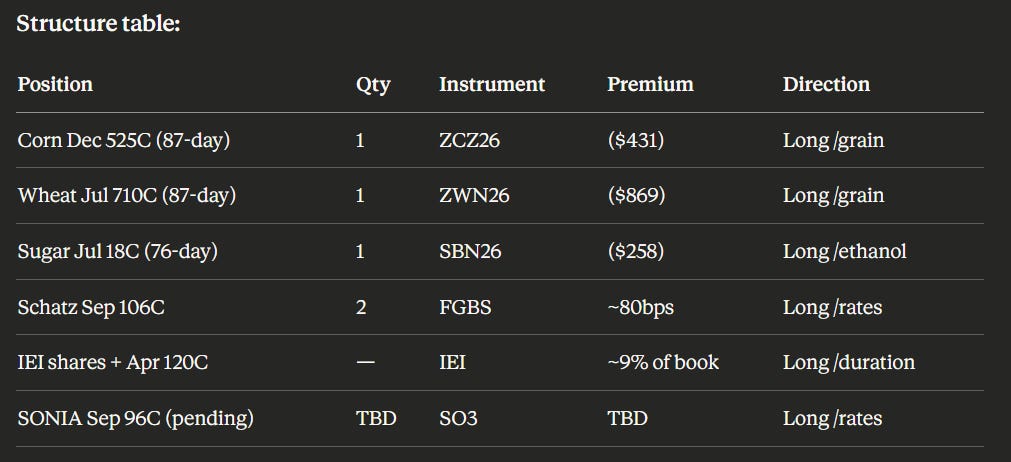
Trade specifics reflect analysis at time of writing*. Strikes, sizes, and credits may differ at execution.
The Payoff
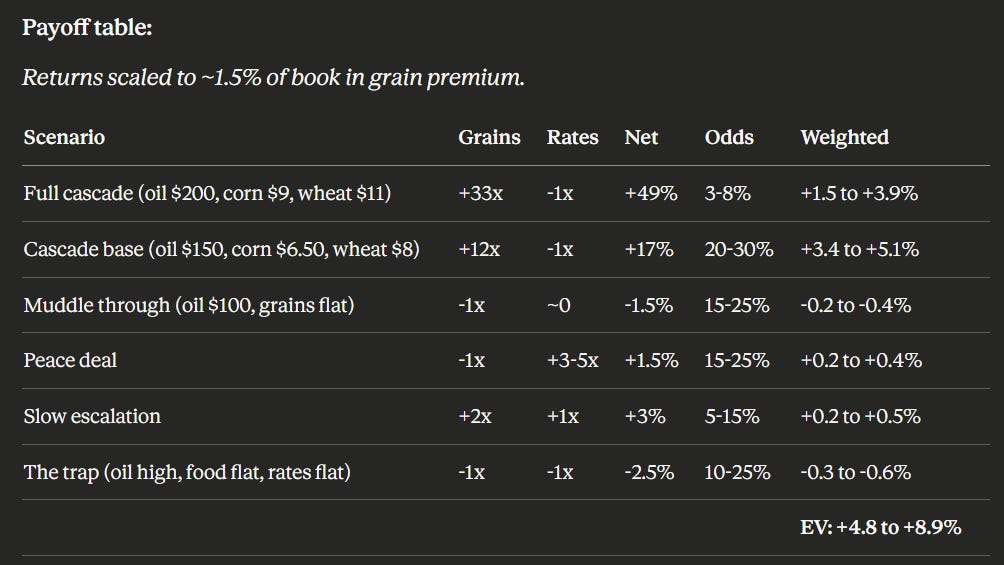
Peace now has the potential to make money. The structure went from “free if wrong” to “gets paid a bit on peace and gets paid more on war.” The cost is that muddle-through loses about 2% of book instead of zero. The trap (oil high, food flat) requires the cascade to be specifically wrong while the war call is specifically right. Even then, max loss is the premium paid.
What We’re Watching
USDA Prospective Plantings drops Tuesday. First official read on whether $931 nitrogen is already pushing acreage out of corn. This piece lands the day before.
IBKR for SONIA permissions. When those clear, we’ll update subscribers with the fill and the final structure.
For the macro backdrop behind the rates thesis, Jason Rotenberg’s piece is the best thing we’ve read on the topic.
The thesis is the chain, not any single trade. But if we’re right about the cascade, this is a cheap way to be right.
What follows are appendixes with the full detail behind each section. Read the ones that interest you.
Appendix A: The Grains in Detail — vol surfaces, ethanol breakeven, seasonal corn, strike optimizer framework
Appendix B: The Peace Hedge Journey — full LUV/EWY walkthrough, why we pivoted, rates curve analysis
Appendix C: The Full Map — every expression across the cascade, longs/shorts/peace wing/EM stress
Appendix D: Commodity ETFs: Buyer Beware — CORN and CANE work, WEAT doesn’t, here’s why
Appendix A: The Grains in Detail
This section walks through the vol analysis, strike selection, and seasonal mechanics behind each of the three grain trades. If you just want the trades, they’re in the topper. This is for the people who want to see the work.
Corn: the full picture
We covered the three legs in the main piece. Here’s the deeper look at each one.
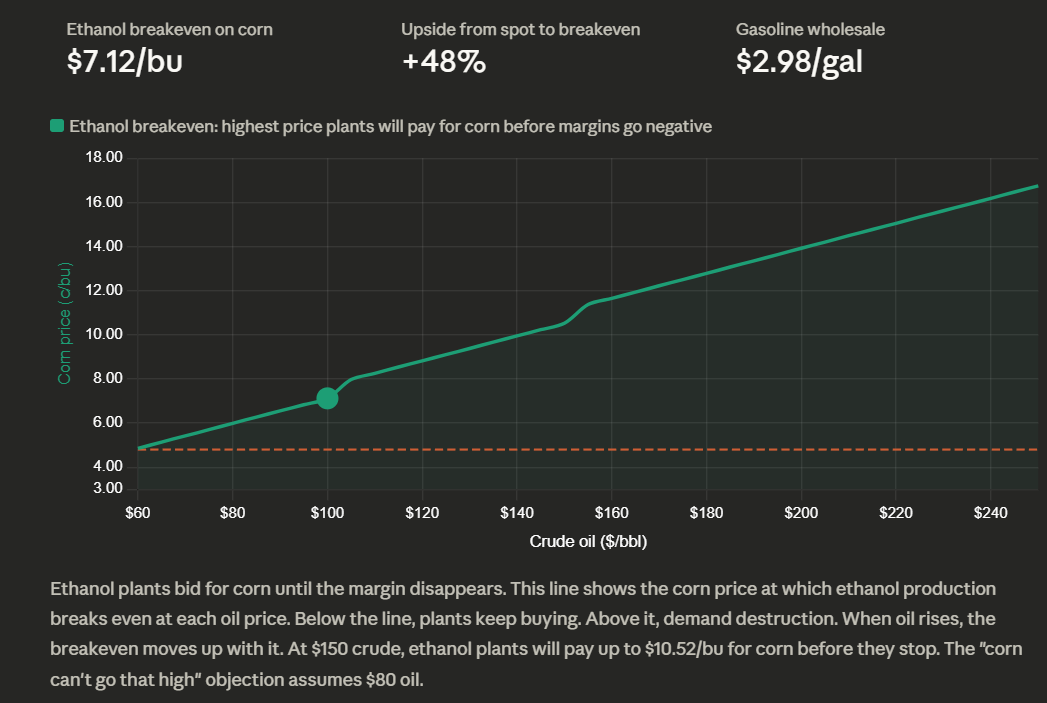
Ethanol breakeven. The chart below shows the corn price at which ethanol production breaks even at each oil price level. Below the line, plants keep buying corn. Above it, demand destruction. When oil rises, the breakeven moves up with it. At $150 crude, ethanol plants will pay up to $10.52/bu for corn before they stop. The “corn can’t go that high” objection assumes $80 oil.
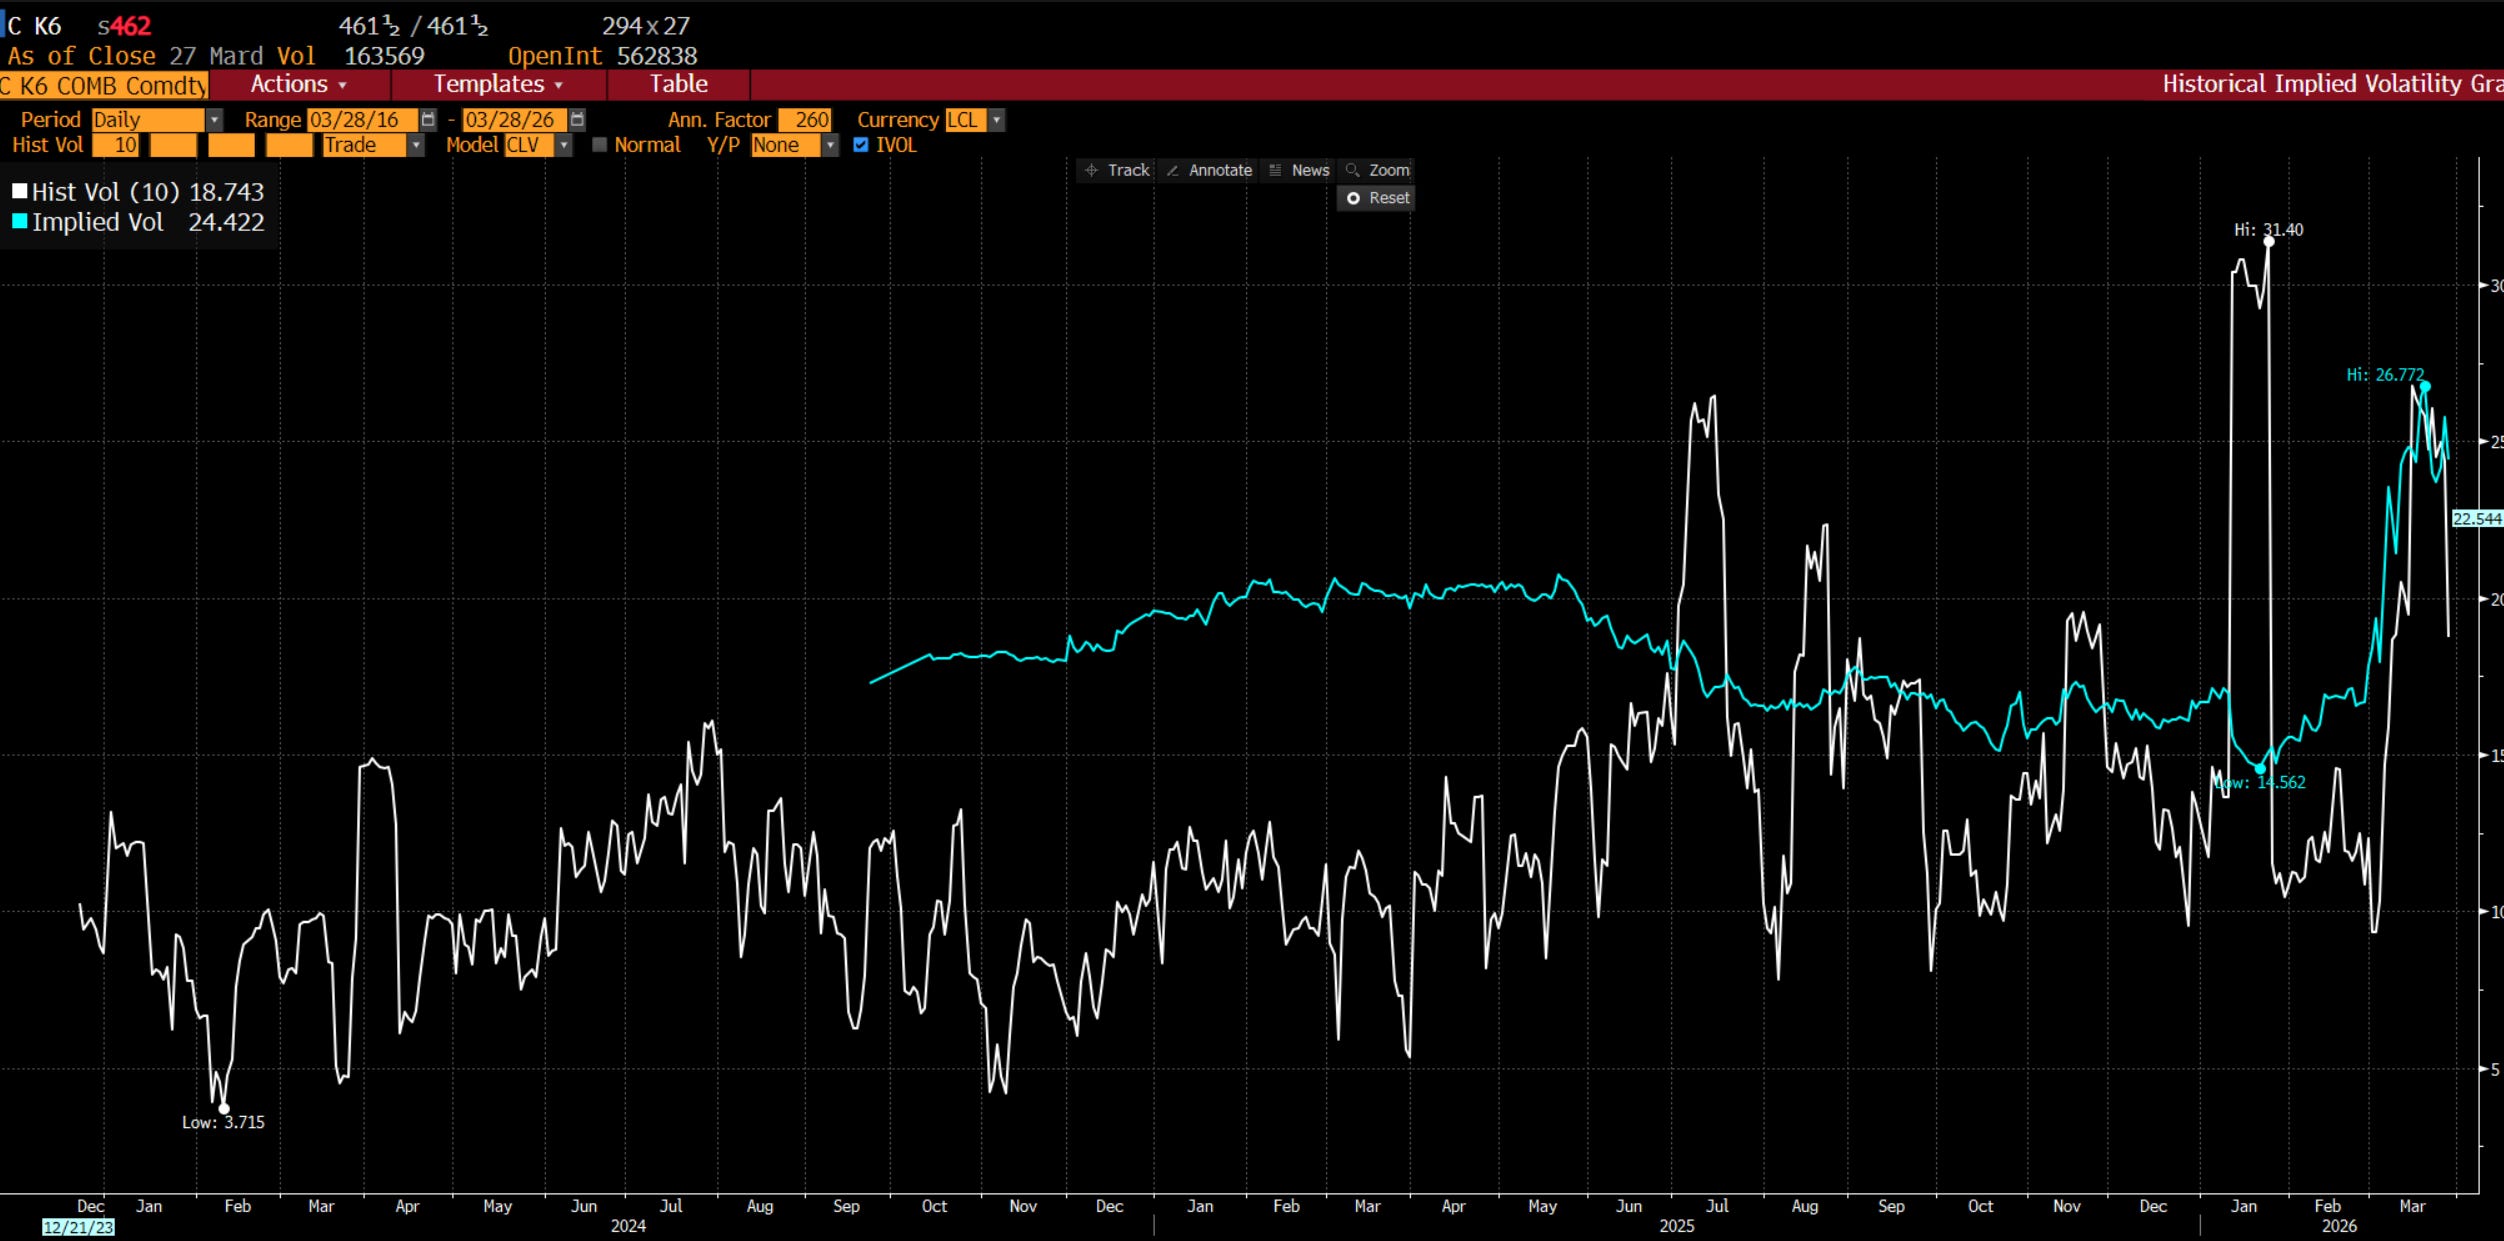
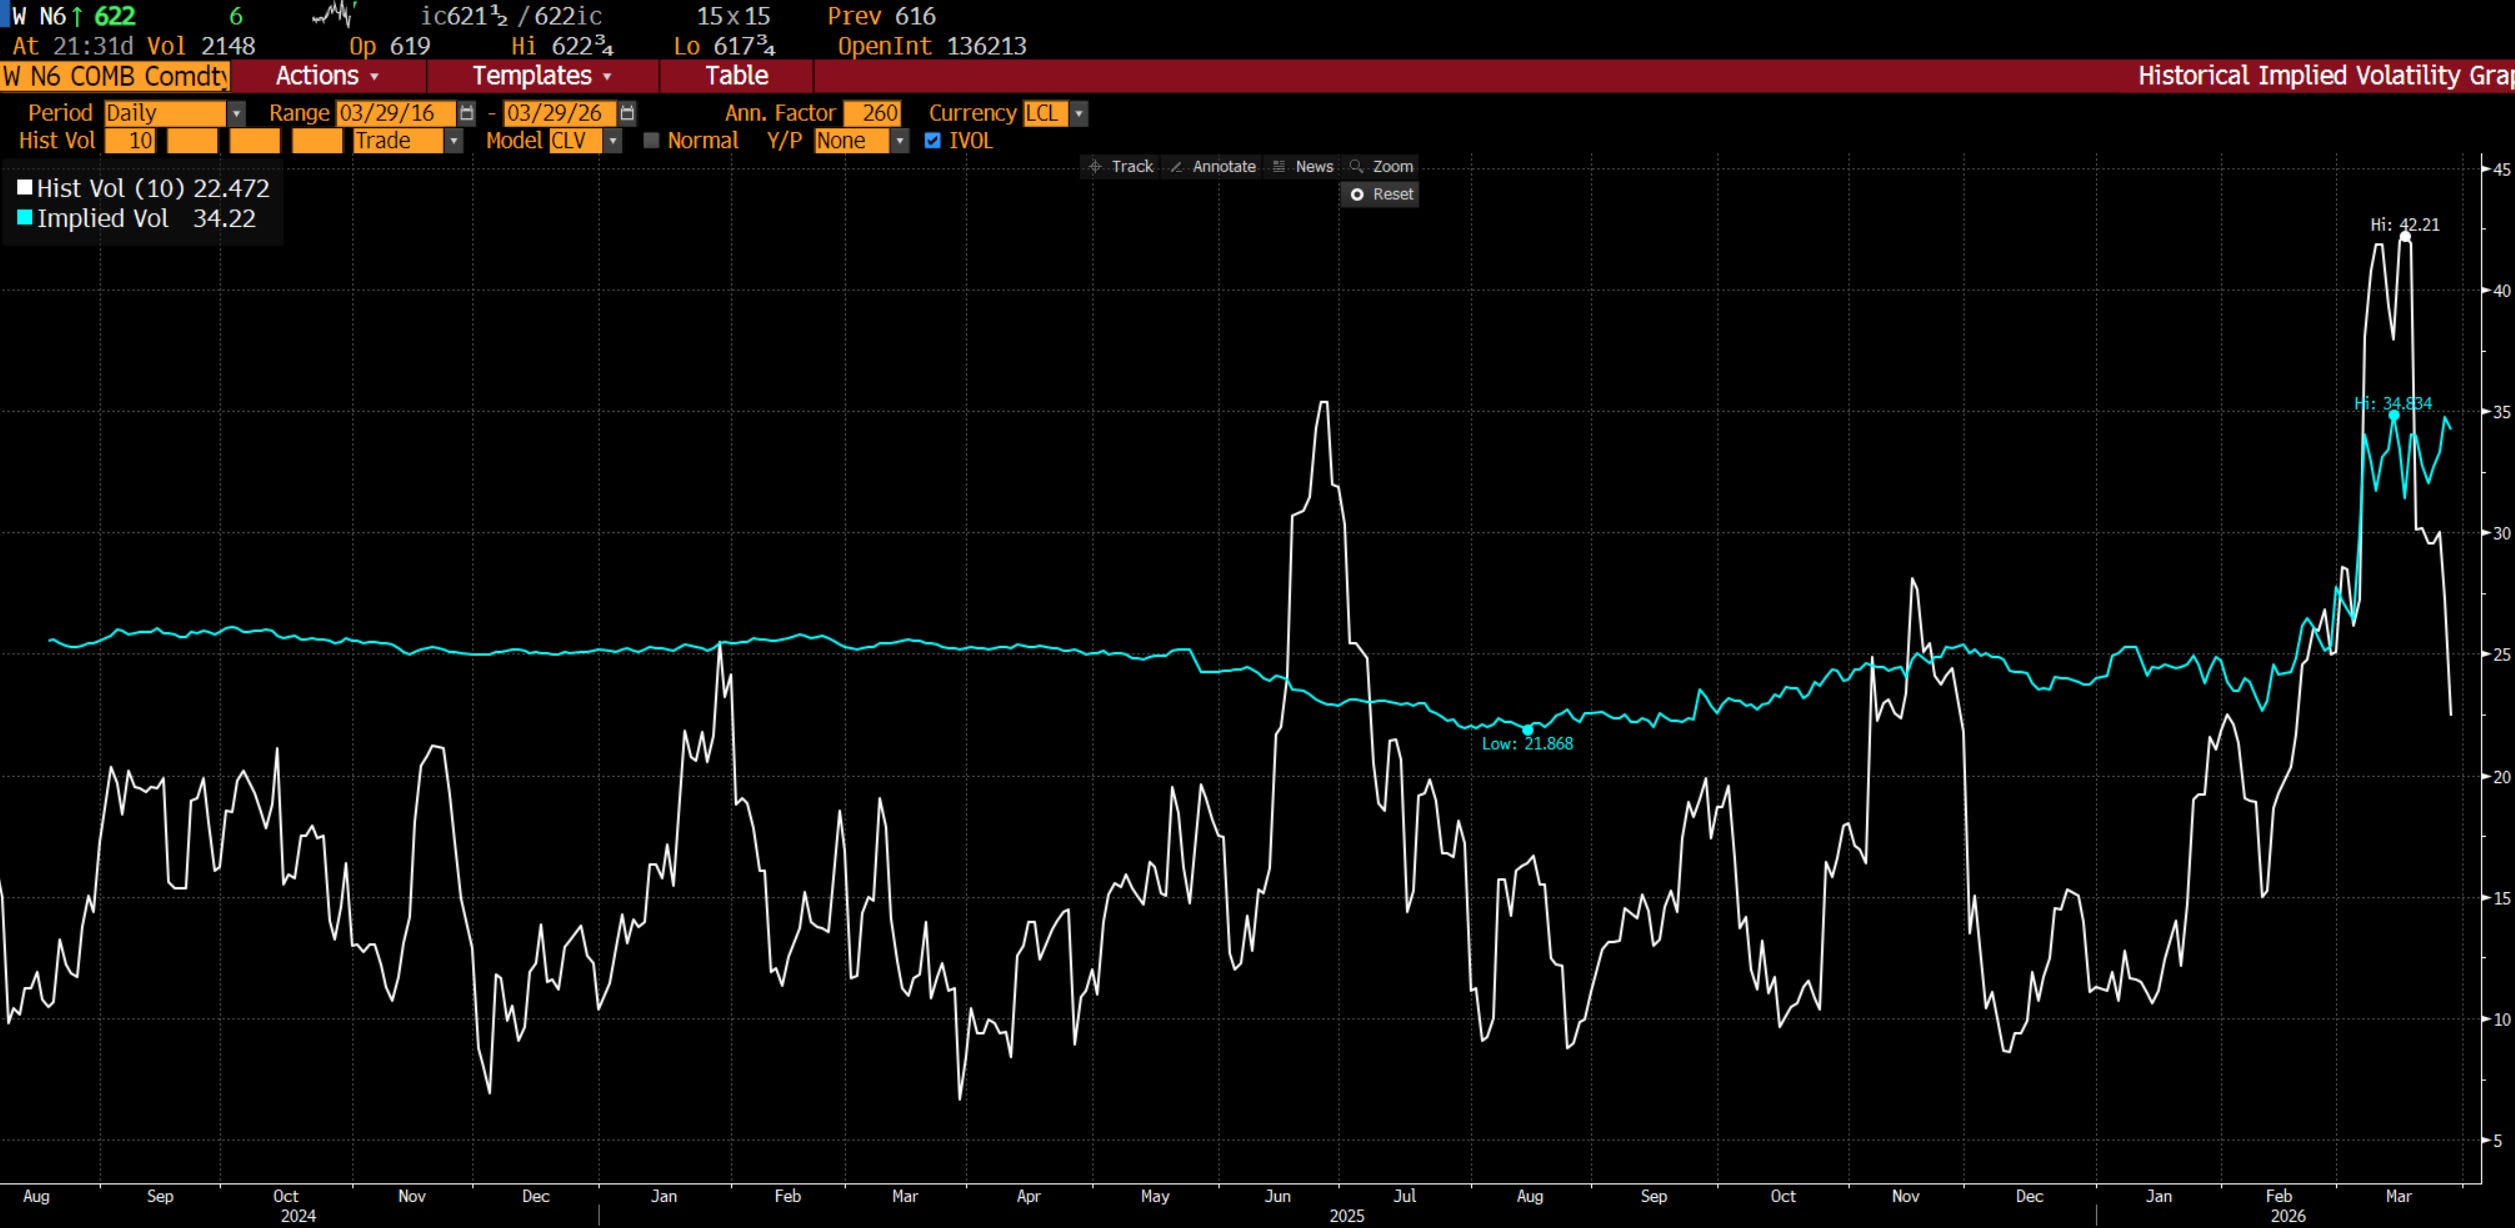
Vol surface. Corn implied volatility is 24.4% against 18.7% historical realized. That’s 1.30x. Wheat implied vol is 35.8% against 23.6% realized, or 1.52x. To some extent the easy money on the vol trade is already gone. If you buy these options you are playing to get convexity to the underlying, not making a bet on the implied-minus-realized spread.
Corn options are cheaper per unit of expected movement. The market has started to price disruption risk into wheat. It has barely touched corn.
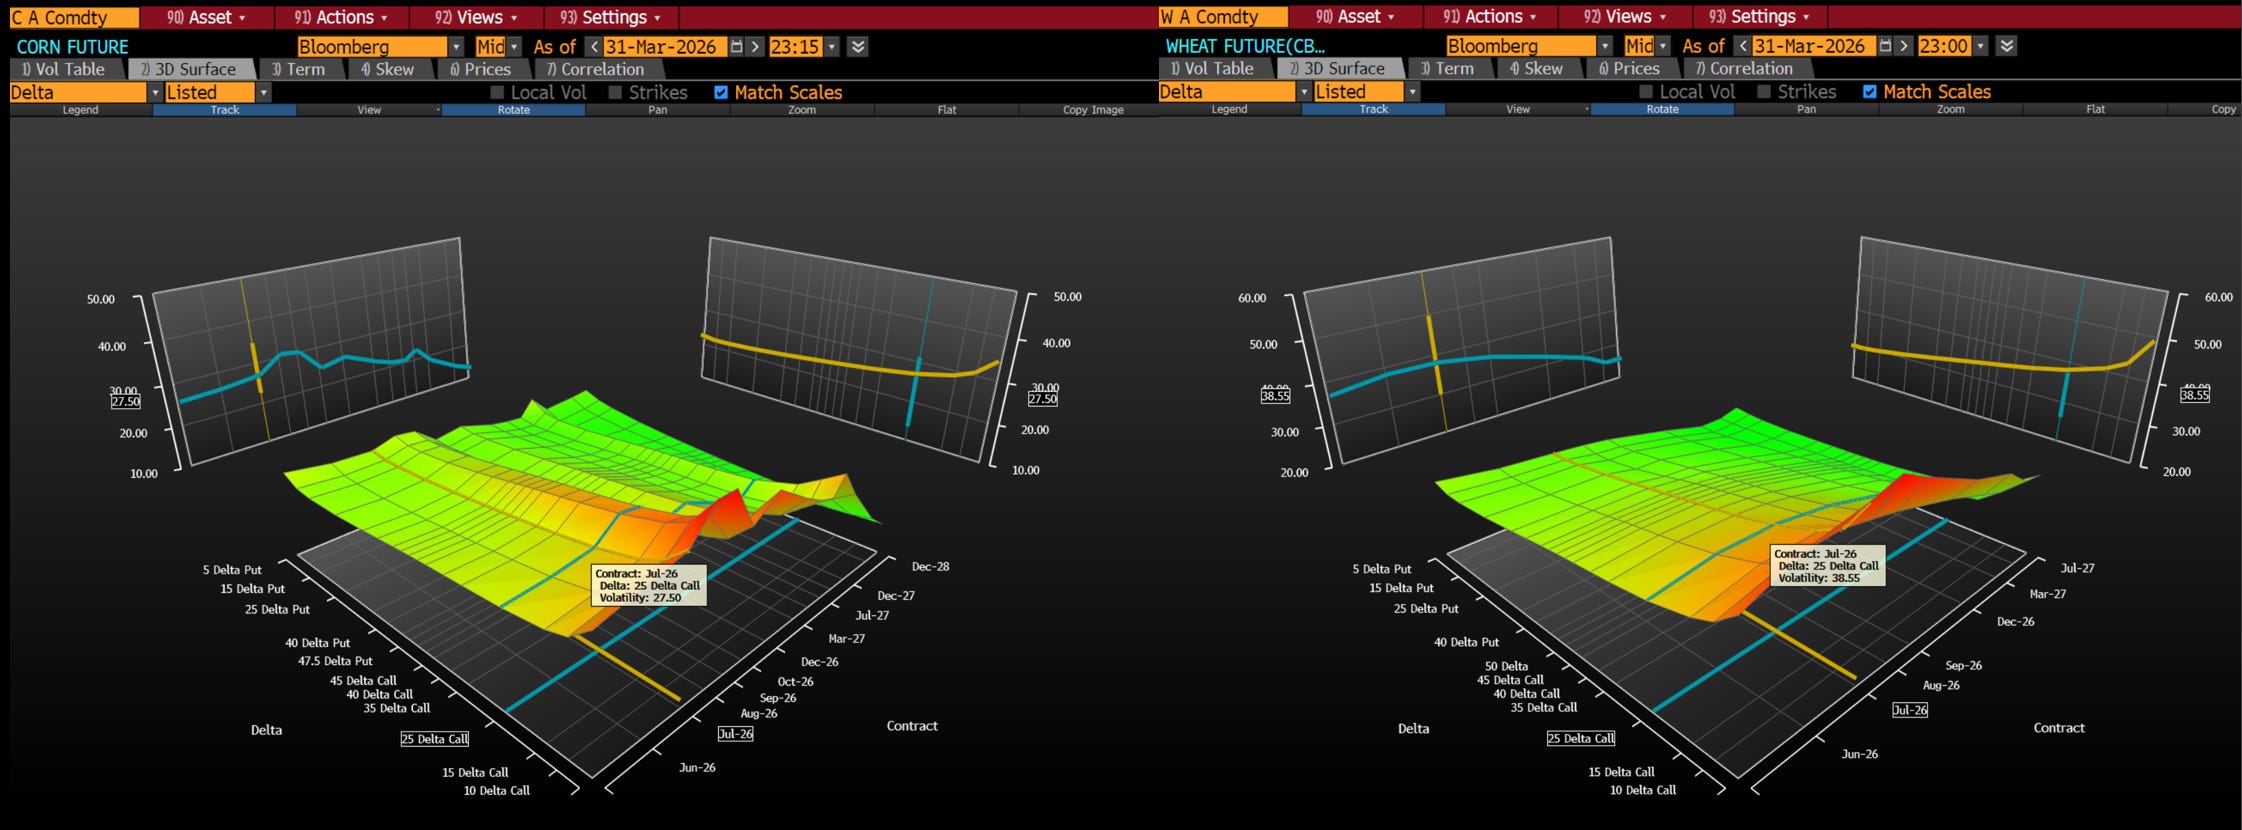
Seasonal vol. Corn pollination is a two-to-three week window in late June and early July. A single heat event during that window can cut national yields 20-30%. The vol surface always peaks over summer because that’s when the irreversible biological risk concentrates.
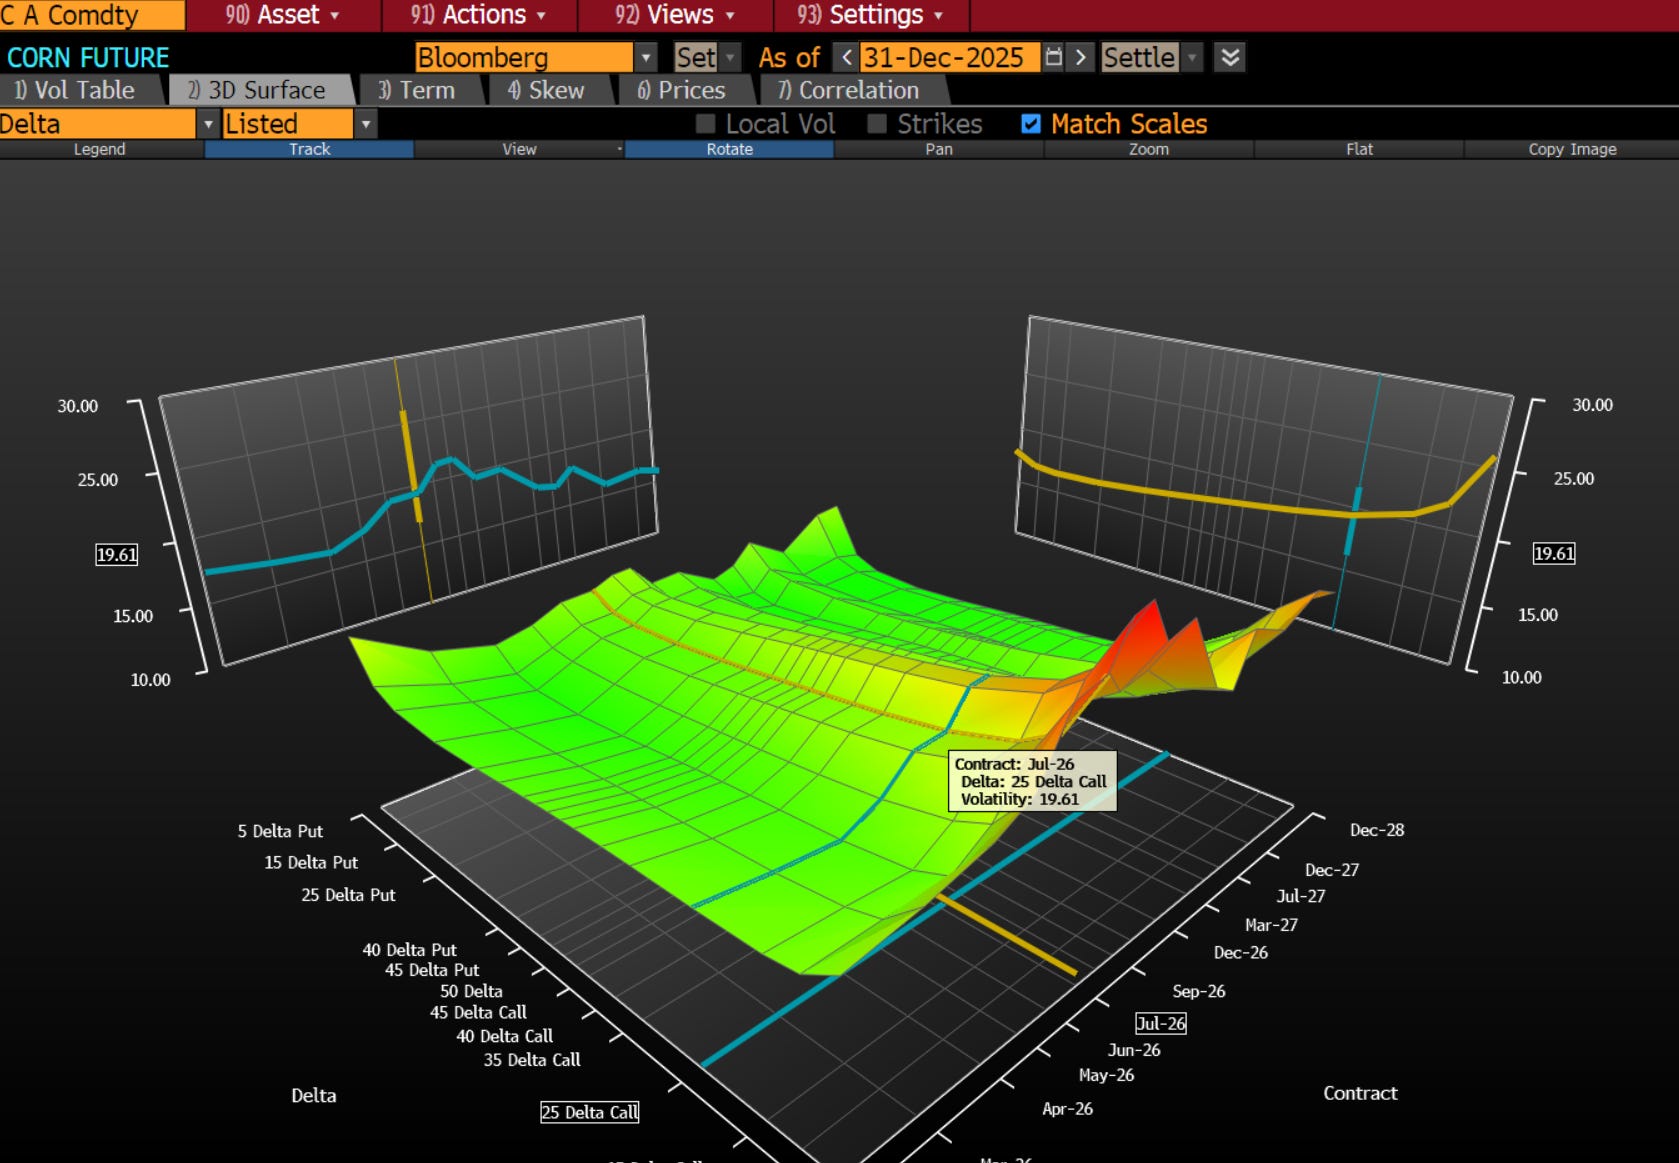
Note summer calls in corn were already at 20-26 vol before Iran. That’s when the price is the most volatile.
You can’t replant corn in August. The Hormuz cascade vol sits on top of seasonal weather vol. Two independent variance sources in the same contract.
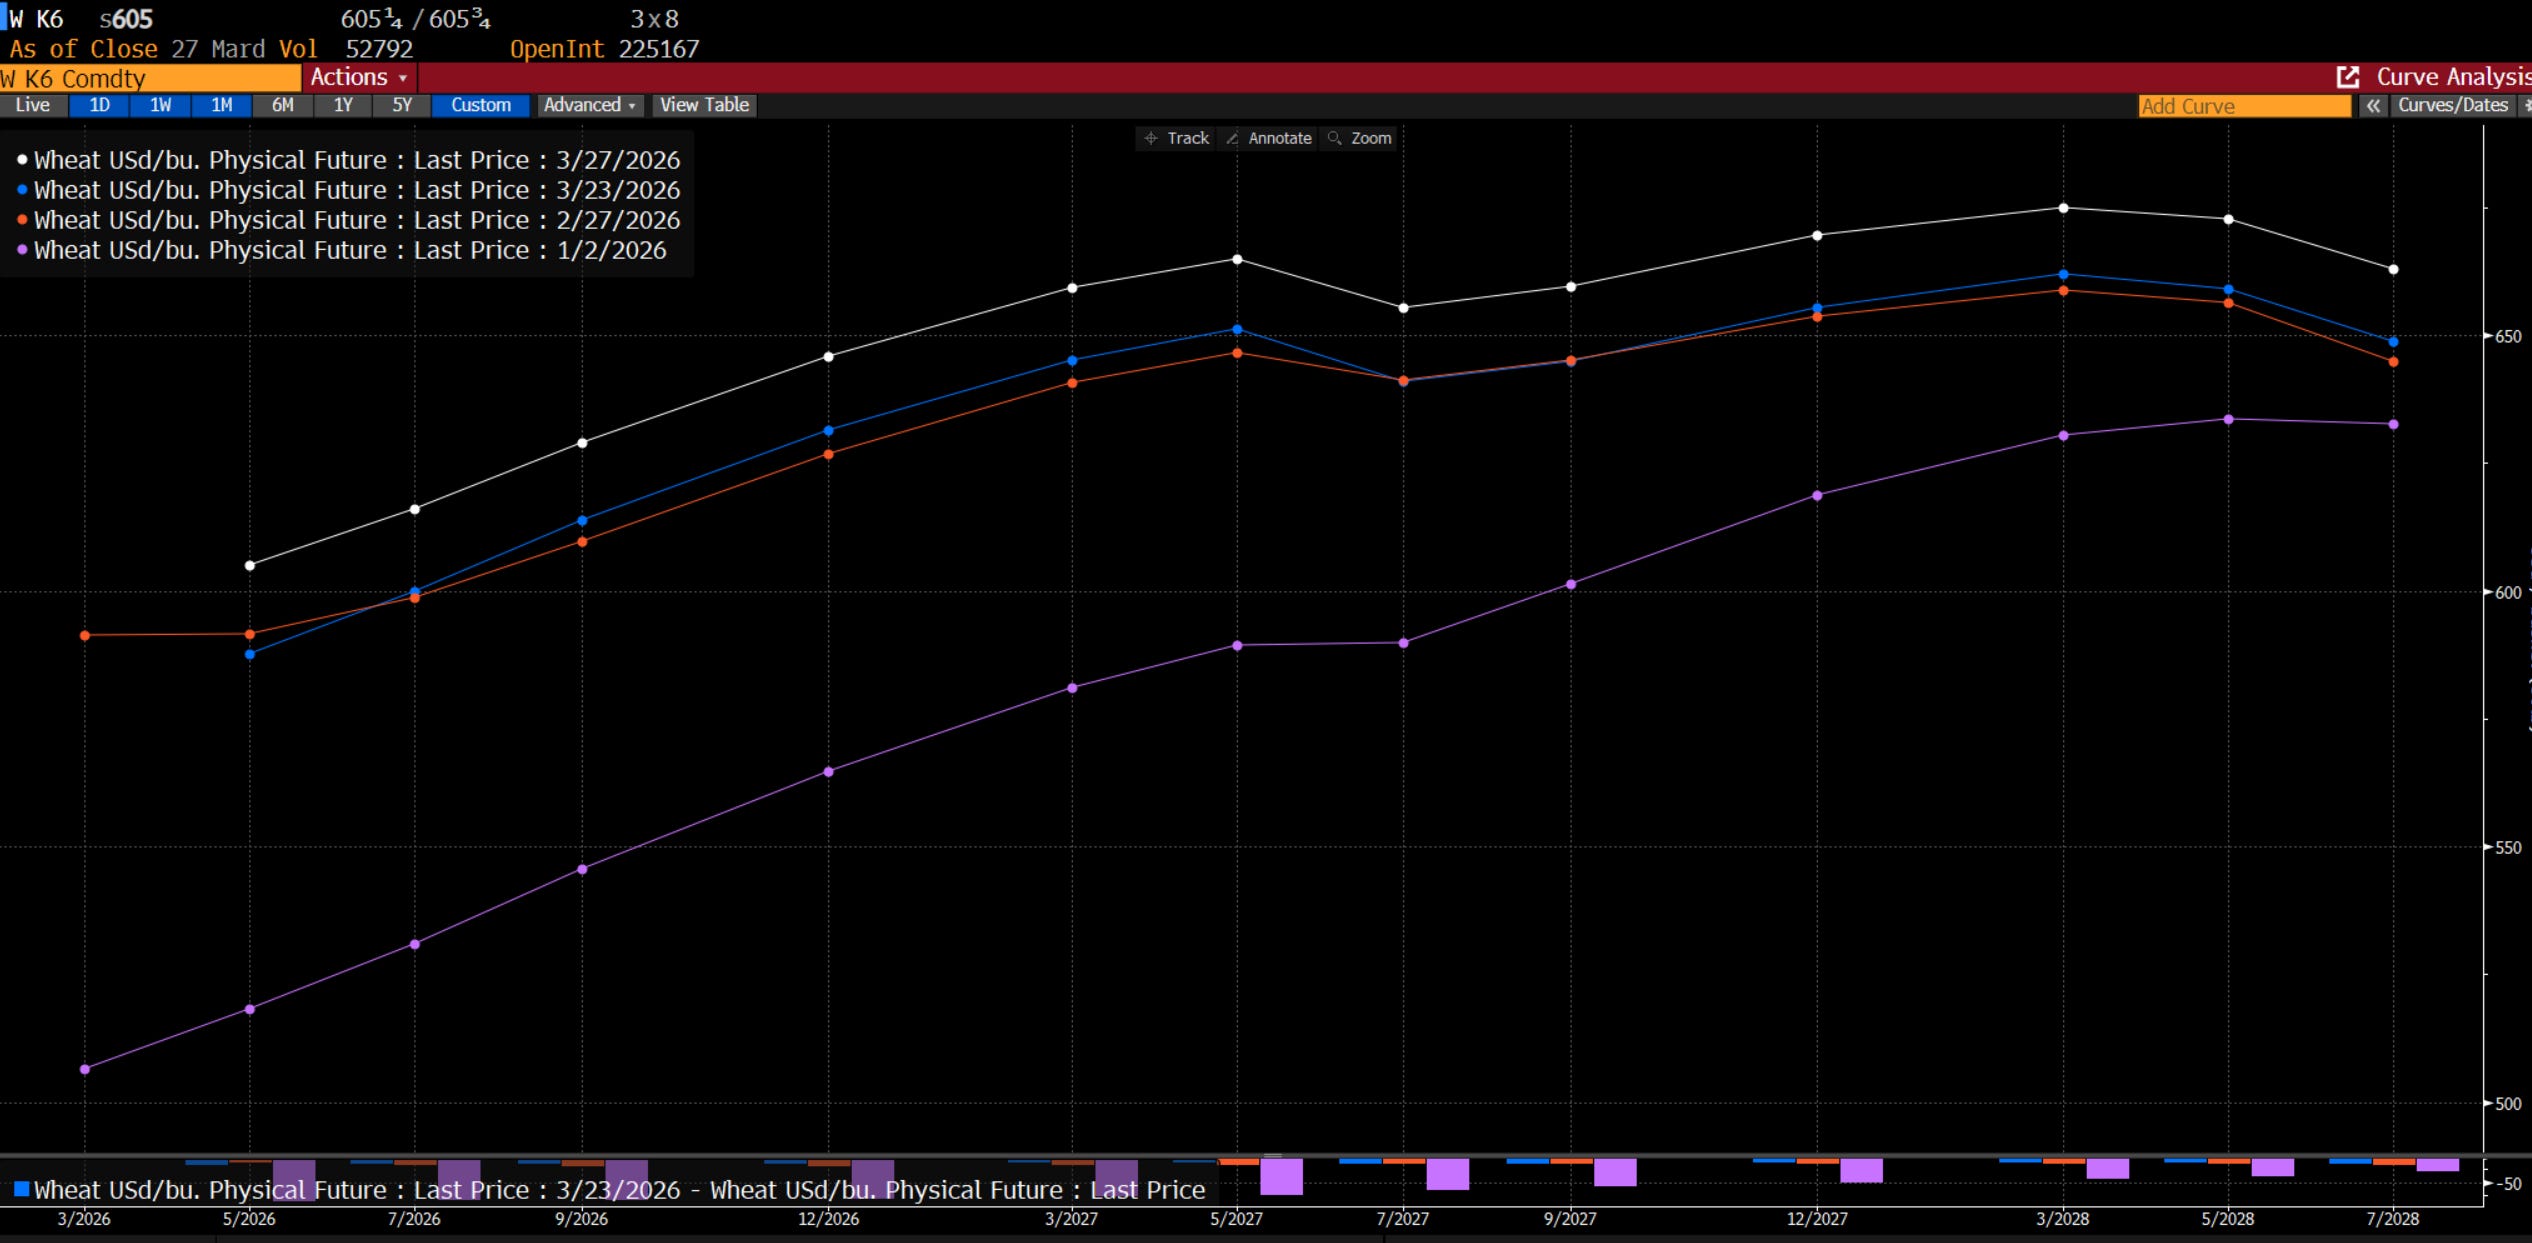
Wheat: vol and forward curve
Wheat is the global food security commodity. MENA and EU import calories as wheat, not corn. When the cascade hits headlines, wheat is where the panic premium lands. Wheat gapped $13 to $618 on the Sunday open after the Houthi news. The geopolitical reactivity is already visible. That makes wheat the faster fuse but the more expensive entry.
Sugar: the Brazil swing
Like the US corn-ethanol dynamic, Brazilian mills choose between sugar and ethanol every crush season based on the price ratio. At current oil, roughly 45% of cane goes to ethanol. At $150, the economics flip to 55-60%, pulling 10-15 million tonnes of sugar off the global export market. Brazil is 40% of world sugar exports. That’s a 5-7% global supply shock from demand substitution alone, before the MENA food security panic bid arrives.
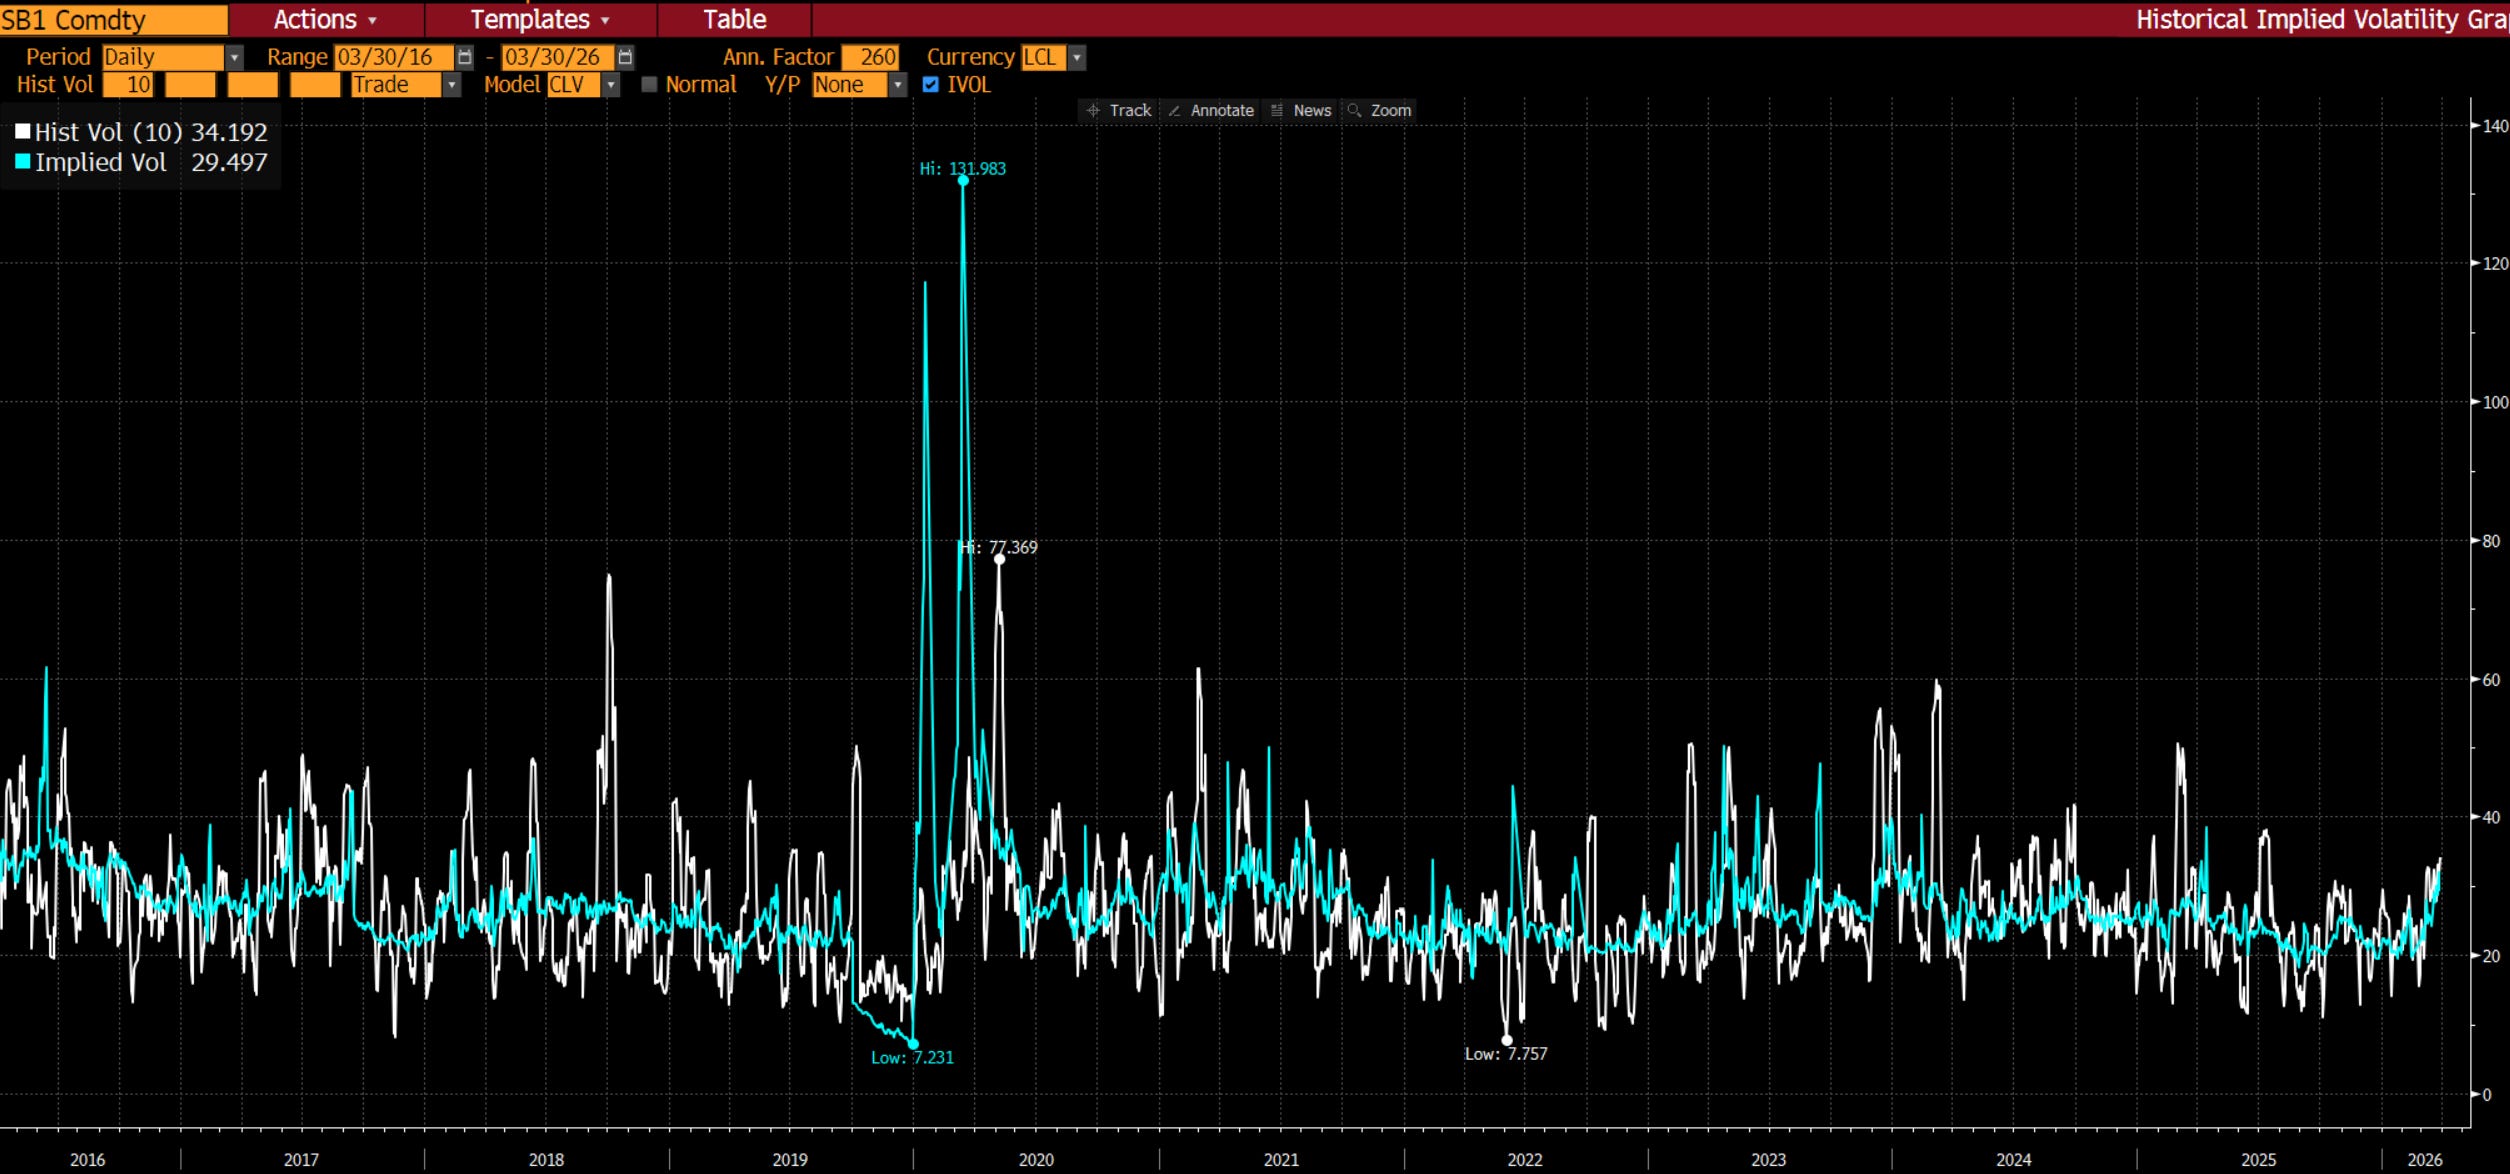
At 30 vol, these are also not cheap! We are not buying these to play realized-implied vol, we’re looking for convexity, not vol spread.
The same mechanism as US corn-ethanol, running through a different country’s agricultural complex. Two independent expressions of the same oil-to-food cascade.
How We Chose the Strikes
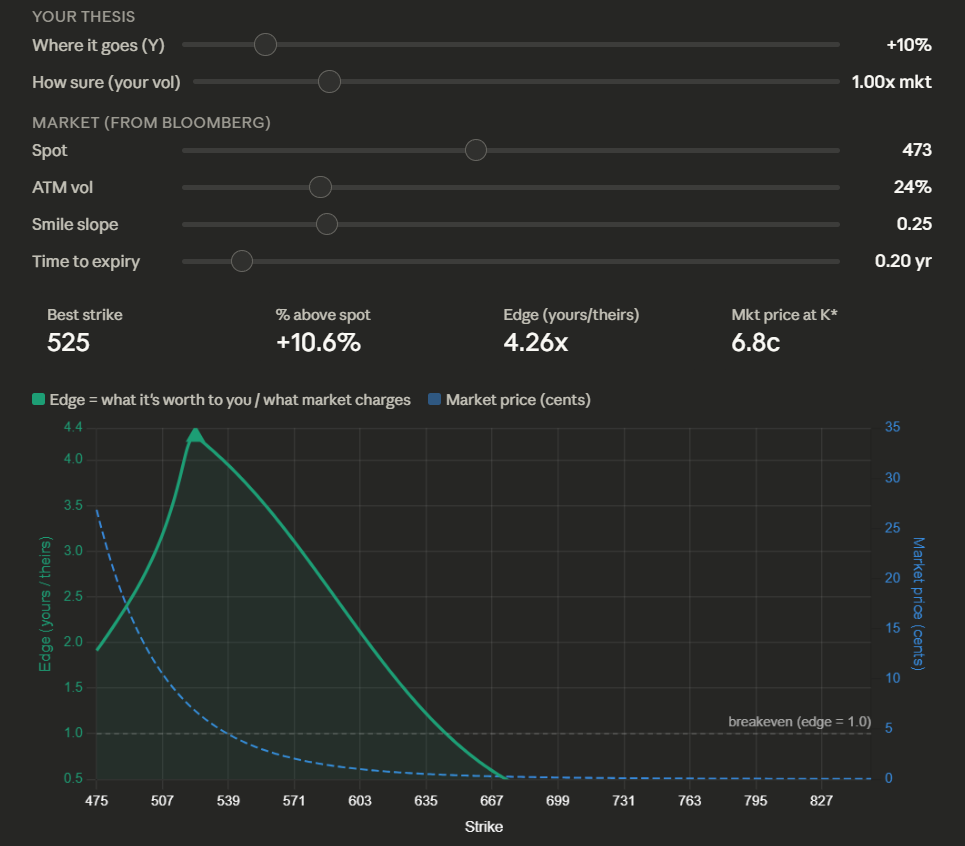
The question sounds simple: given a thesis about where price goes and how uncertain you are, which call option has the best expected return per dollar of premium?
The answer requires comparing two things. What the option is worth to you, based on your target and your uncertainty. What the market charges, based on the vol surface. The ratio of those two numbers peaks at a specific strike. Below it, you’re overpaying for delta. Above it, the vol smile makes each additional unit of optionality more expensive than your thesis justifies.
How you net those together is a bit of tradecraft (though we’re working on a closed form mathematical solution. If I ever get that Nobel I bailed on when I left academia for Lehman, lol as if, it will be this or something to do with integrating options into a portfolio).
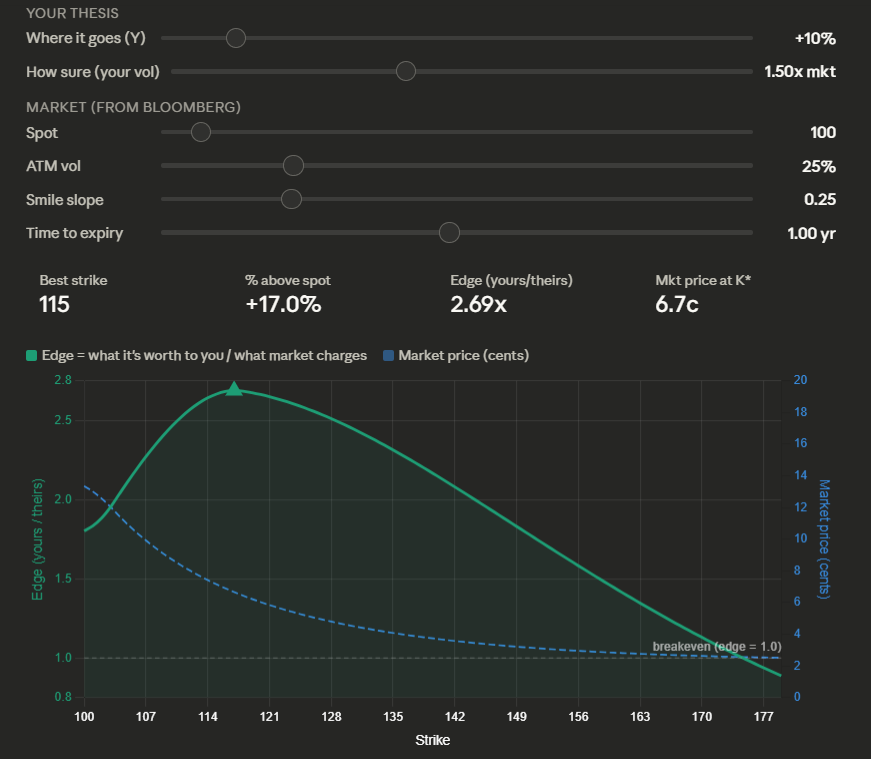
The practical rule: buy at the lesser of your expected move or one standard deviation of your belief, adjusted down for the slope of the smile. For corn, that puts you at 525. For wheat, 710. For sugar, 18.
For corn, we think the sweet spot is 10-15% above spot. Further out, the smile slope makes calls expensive faster than the thesis adds value. Closer in, you’re paying for delta you don’t need. The 525 sits in the valley.
Why the 89-day expiry: USDA plantings Tuesday. Crop progress reports through May and June. Corn pollination late June. All inside the window. Longer-dated options have roughly three times the vega exposure, meaning a vol compression on a “productive talks” headline bleeds premium before spot moves. The 89-day limits that exposure while capturing every catalyst through the growing season.
Why naked calls and not call spreads? A spread buys vol at one strike and sells it at a higher one, harvesting the differential. That’s a good trade if your edge is localized to a specific zone. But the cascade thesis says the entire right tail is underpriced. Nitrogen squeezes supply, oil pulls the demand ceiling up, and vol is pricing neither. If the tail is fatter than the market thinks all the way out, selling the far leg sells back the very edge the thesis is built on. Naked calls. Defined risk. Maximum convexity.
Appendix B: The Peace Hedge Journey
This is the full story of how we got from “sell put spreads on airlines” to “buy bonds.” The topper gives you the punchline. This gives you the process.
What we tried first
The original plan was to sell put spreads on airlines (LUV) and Korean equities (EWY) to finance the grain premium. The logic was clean on paper: airlines and Korea both rally on peace, so selling put spreads on them collects premium that offsets the grain cost. Net entry near zero. Flat if wrong. Paid 10-30x if the cascade plays.
We spent a chunk of time on this. We stress-tested the LUV Jun 37.50/30 put spread and the EWY Jun 105/95 put spread. The LUV math was decent on paper. EWY was ugly: 0.11 return/risk on a $10-wide spread. We resized EWY to a $5-wide spread to fix the ratio, but then the credit shrunk and the structure went from a net credit to a net cost.
Tinkering on selling fairly priced vol on something illiquid.
The more we thought about it, the more we wanted to sell something expensive on something liquid. Something we wanted to own.
Why LUV didn’t work
When we went to execute, the liquidity wasn’t there at ratios we liked. The Jun 35/30 put spread sells for roughly $1.60 credit on a $5-wide spread. Risk/reward is 2.1:1 against you. The Jun 37.5/32.5 is slightly better but the short strike is in the money. We want 3:1 or better when selling insurance. LUV is sitting on its 200-day moving average after a 32% decline, and the puts just aren’t fat enough at these levels.
Why EWY didn’t work
The memory cycle is rolling over. OpenAI’s DRAM commitments are looking soft. Google’s compression algorithm cuts memory requirements up to 6x. EWY is 25% Samsung and SK Hynix. A peace rally in Korean equities could be partially offset by collapsing DRAM pricing. The basis risk between the peace leg and the war leg was too wide.
For readers who want equity expressions or defined-loss structures, both of these are still viable. Match the premium of one cereal call with one put spread and you have the original self-financing structure. We decided the rates construction is the better trade and we’re willing to pay for it.
The pivot to rates
Two things happened that pushed us toward rates.
First, rates were telling us something. On Monday morning, European and UK front-end rates rallied hard while LUV and EWY both sold off. The market was giving us the “war continues but growth shock dominates inflation” scenario. Central banks can’t tighten into this. The airlines didn’t care. They kept falling. But rates moved, without any peace headline at all.
Rates capture more scenarios than equities. Airlines need peace AND lower oil. Rates just need central banks to blink, which can happen on peace OR growth shock. The payoff set is wider.
Second, when we went to hit the LUV and EWY put spreads, the liquidity wasn’t there at ratios we were comfortable with. We like selling insurance at 3:1 or better. These didn’t qualify.
The curve detail
The topper covers the headline: 125bp of BoE repricing into the weakest G7 economy, wages already falling, fighting the last war. Jason's piece has the full case. Here's the curve detail.
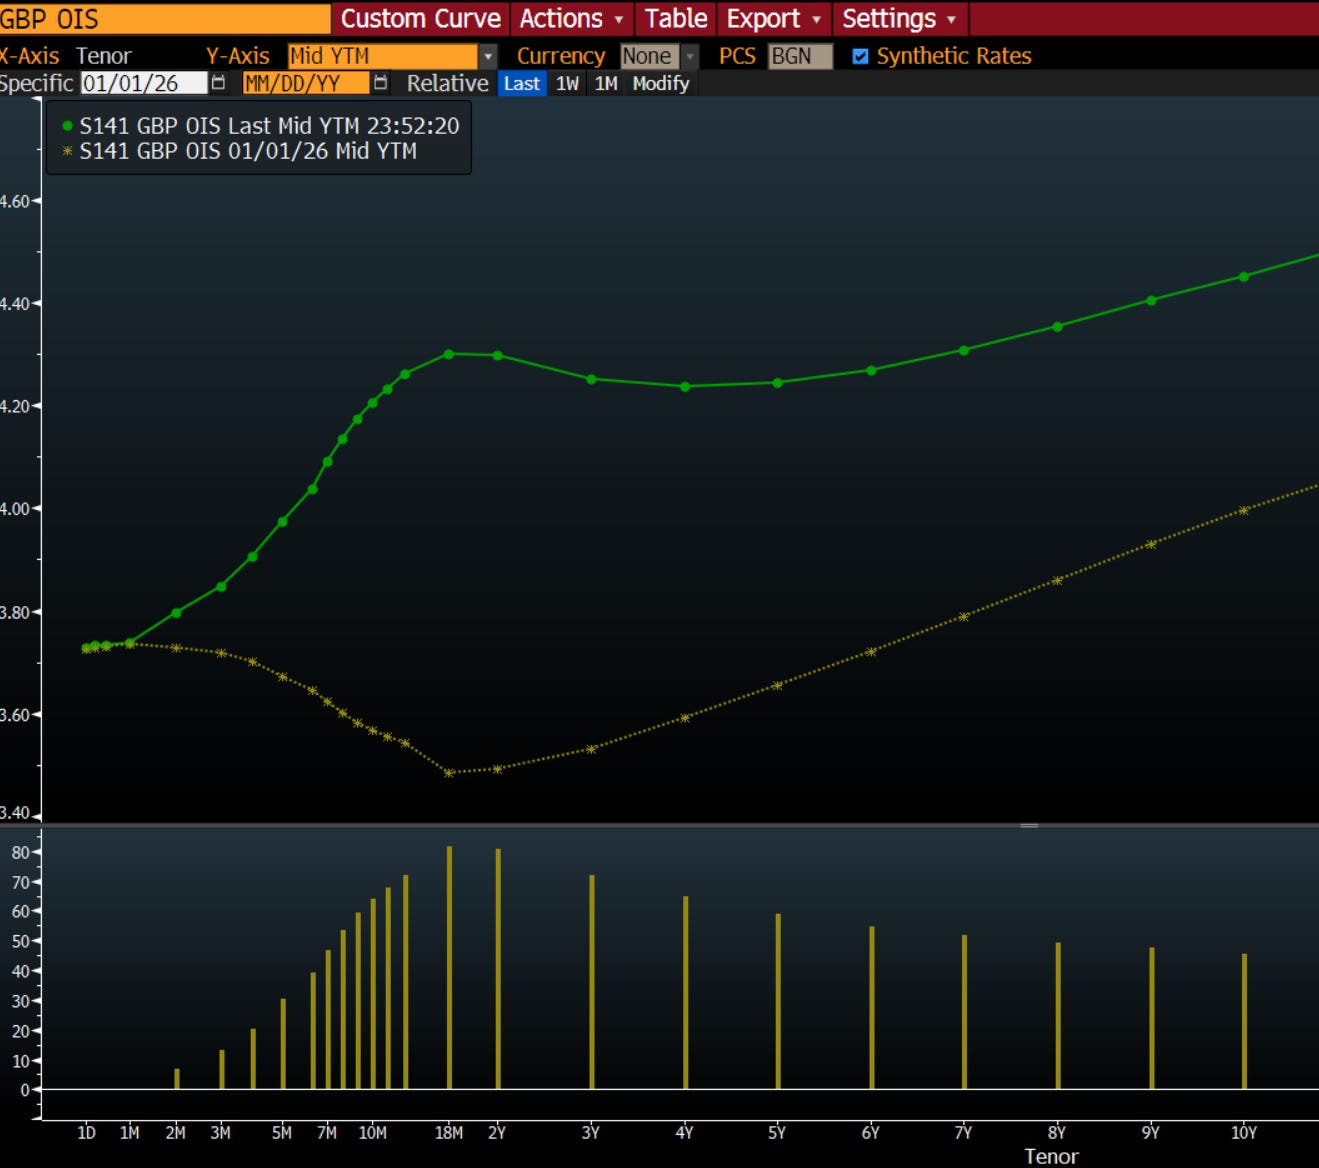
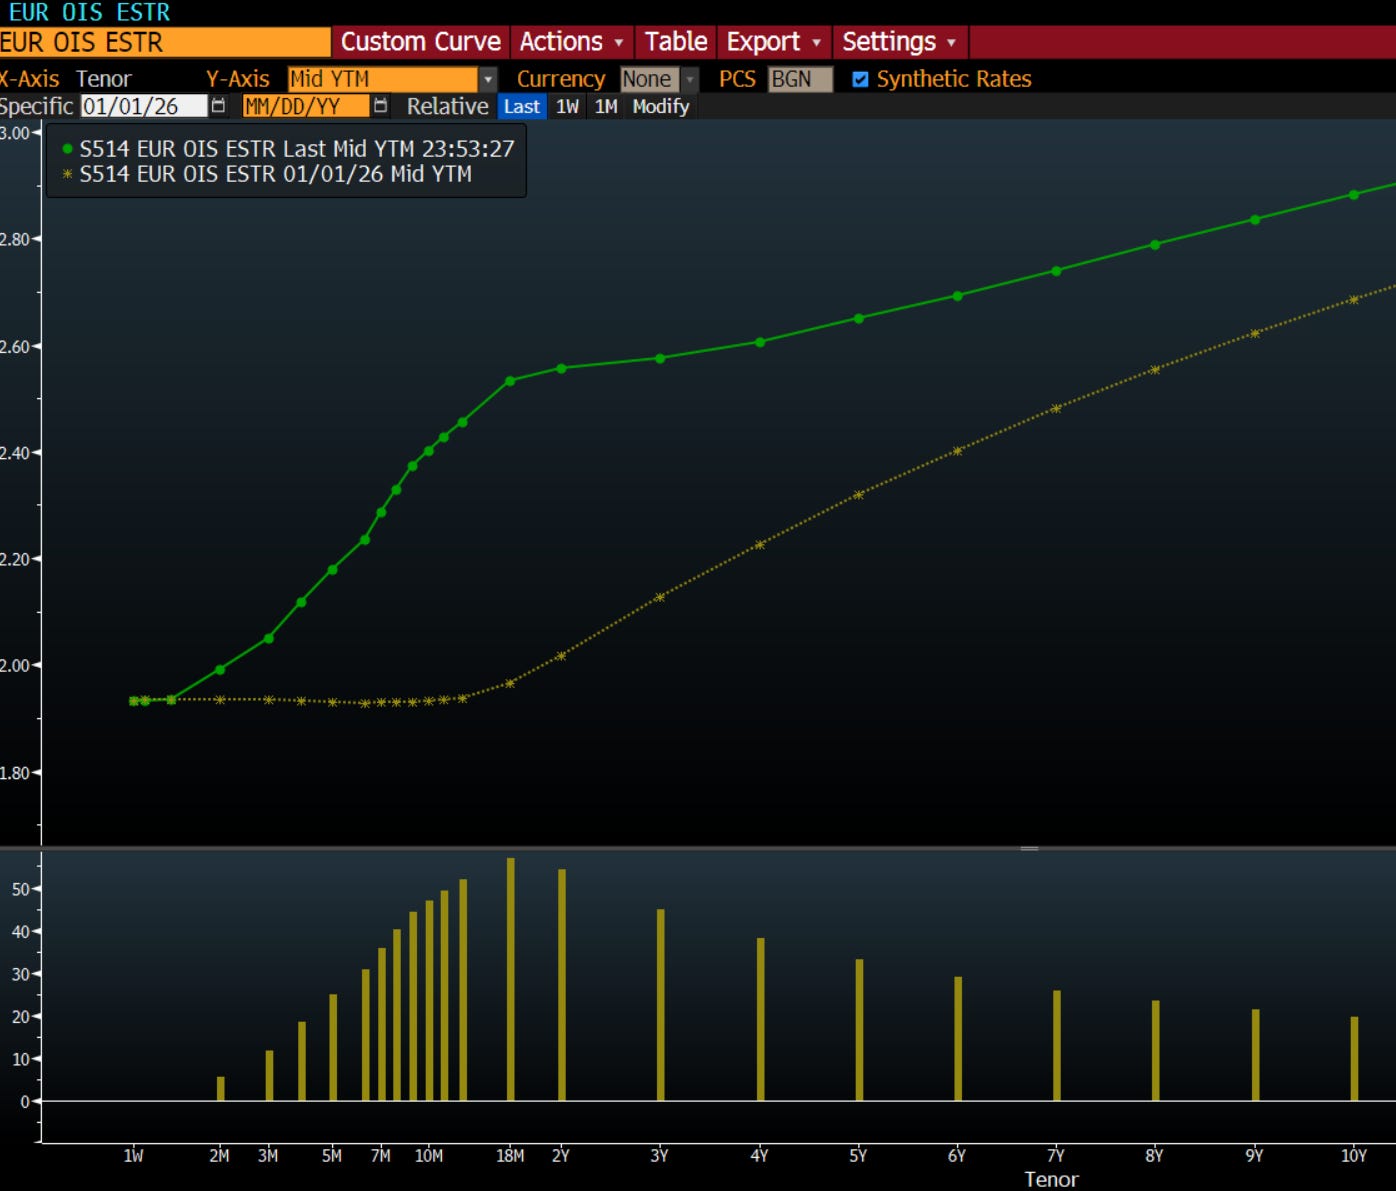
UK front-end rates are the most mispriced peace expression in DM. Europe looks most reasonable. The US has barely moved, which is why buying Treasuries is a worse version of this thesis.
What we actually bought
We wanted to buy SONIA options. Three Month SONIA futures on ICE, the instrument that sits at exactly the point on the UK curve where the mispricing lives. The Sep 96C at 0.137 per contract. Defined risk, right point on the curve, right country, no gap risk.
And then we realized our ICE Futures Europe permissions weren’t even enabled. “The machine is down,” as we say. The best trade in the world is useless if you can’t execute it. SONIA options require permissions that take 24-48 hours to approve. We submitted the request. It’s pending. We’ll try to get it on when we can.
In the meantime, we bought what we could.
Some Schatz (German 2-year bond) Sep 106 calls on Eurex, for roughly 80bps. The Schatz captures ECB repricing, which is the same thesis but the less mispriced version of it. Jason’s analysis shows European pricing is the most reasonable across DM. The UK is where the screaming mispricing lives, and we can’t get there yet.
We also picked up some intermediate US Treasuries (IEI) as a bridge. Not because the US curve is mispriced the way the UK is, but because we needed some peace hedge, and we realized the duration hedge to our short credit trade (which is the biggest in the book) had rolled off along with some expiring options. When rates rally, high yield goes up on duration alone even if credit spreads don’t tighten. The Treasury position partially offsets that. It’s boring. It’s a placeholder. It gets replaced by SONIA when permissions clear.
The net net
The old structure with equity put spreads was self-financing. This one costs about 3% of book for the full structure once SONIA is on. The tradeoff: the rate position makes money in scenarios the equity position couldn’t touch. Rates rally when growth scares central banks into pausing. Airlines don’t rally on a growth scare. The wider payoff set is worth paying for.
If you prefer the self-financing version, the equity peace wing still works. Match one cereal call with one put spread of your choosing and match the premiums. We just think the rates construction is the better trade and we’re willing to pay for it.
For those of you with an ISDA: fading the move in short term rates is likely pretty attractive here as a peace trade. Be it swaptions, selling puts on Euro 2-5Y bonds (Eurex Bobl options) or buying Bobl call spreads, it’s a reasonable peace/disinflation bet. European front-end rates gapped out on the energy repricing and would snap back violently on resolution. But the on-screen market access isn’t there for a lot of our readers.
Appendix C: The Full Map
Below is every expression we identified across the cascade. Obviously we are not doing all of these. The goal here is to lay them out in case you want to do a bit of your own research and want somewhere to start.
LONG — Underpricing war impact
We’re buying corn, wheat, and sugar. The rest of the long book is on the watchlist. We’ll add copper if the sulfur-acid chain starts to price, and energy names are already in the portfolio.
SHORT — Overpricing war or mispriced
These are sells into strength. We’ll revisit the petchem shorts and tanker fades once the equity market finds a floor and we can structure them with better timing.
PEACE WING — Long rates / sell insurance
Rates are the active leg. Equity expressions are alternatives for readers who want different structures.
MAKES MONEY EITHER WAY
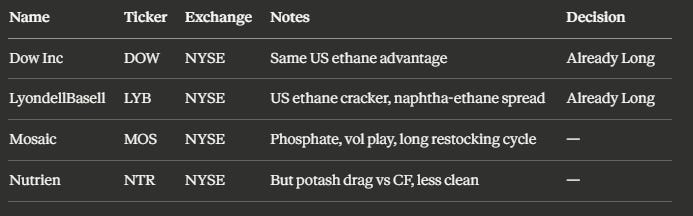
These benefit from the disruption regardless of resolution. US ethane crackers print on the naphtha spread whether Hormuz reopens or not. Phosphate restocking is a multi-quarter cycle.
EM STRESS / MACRO EXPRESSIONS
I don’t have any of these on, most have expensive carry for the time being and we will have lead time if things start to crack here. Think of this as “node 4.”
Appendix D: Commodity ETFs — Buyer Beware
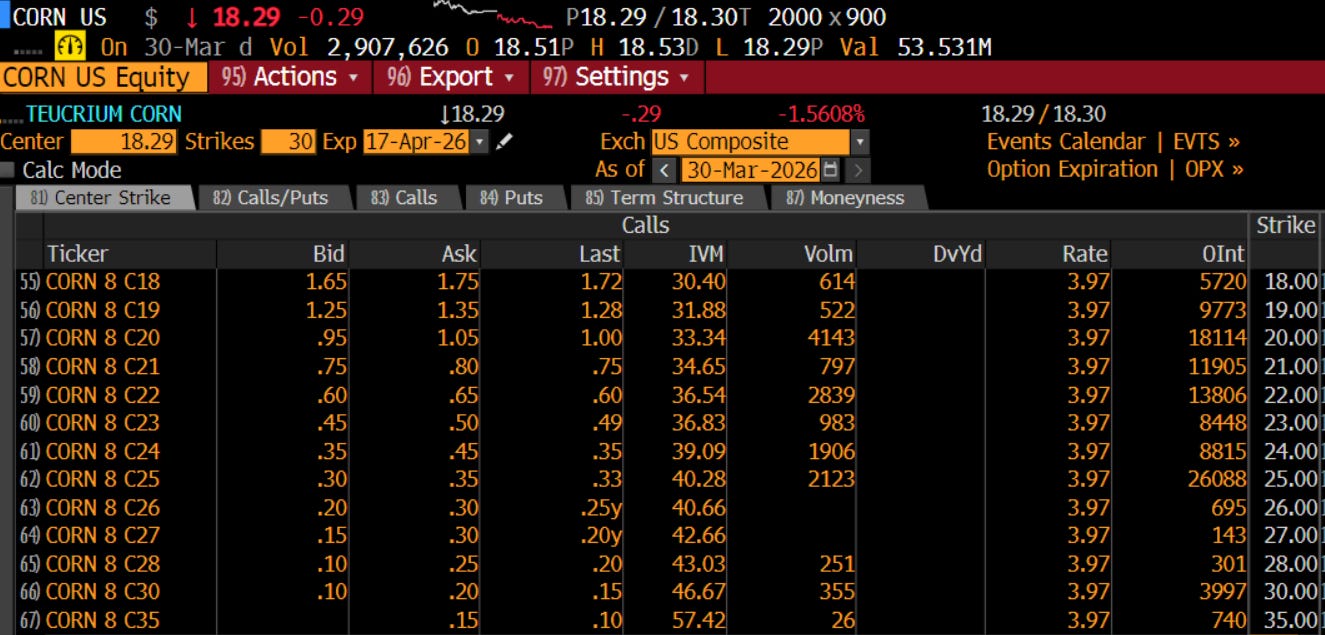
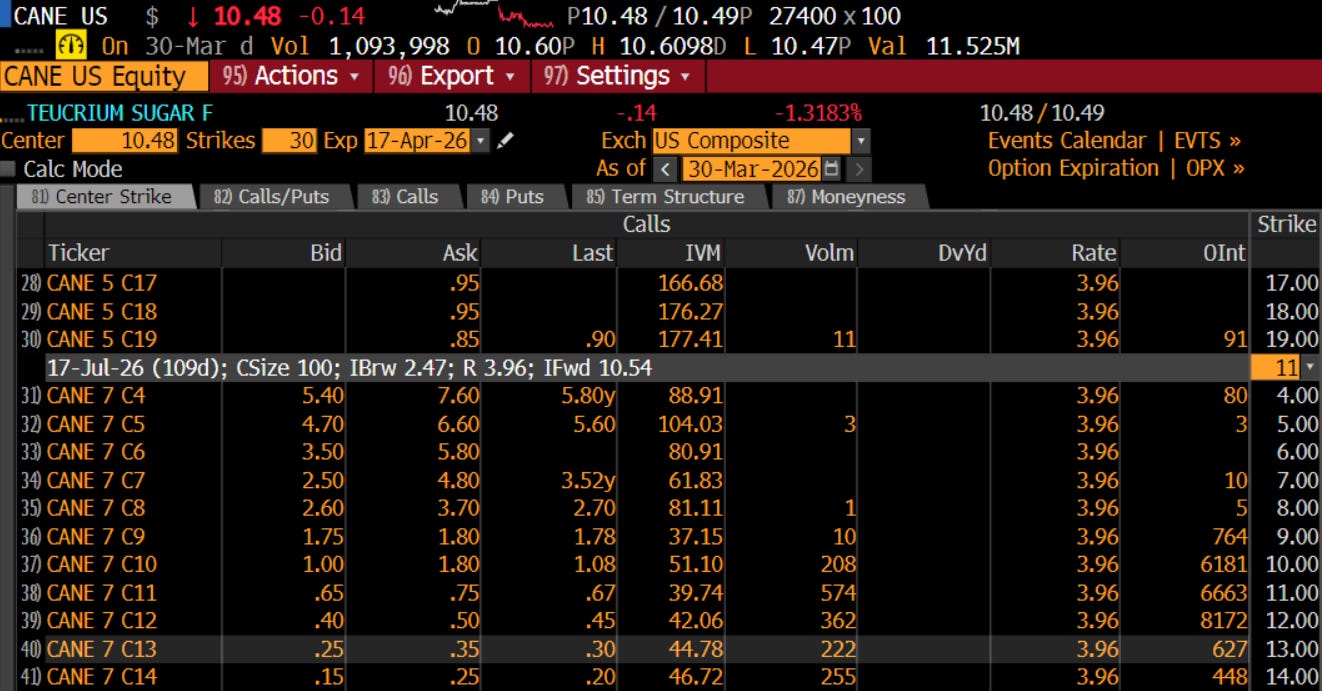
Several readers have asked about using commodity ETFs (WEAT for wheat, CORN for corn, CANE for sugar) instead of futures options. Fair question. These are accessible through any brokerage and don’t require futures permissions. But the answer isn’t the same for all three, and one of them is actively bad.
Start with the correlation chart, because it tells the whole story.
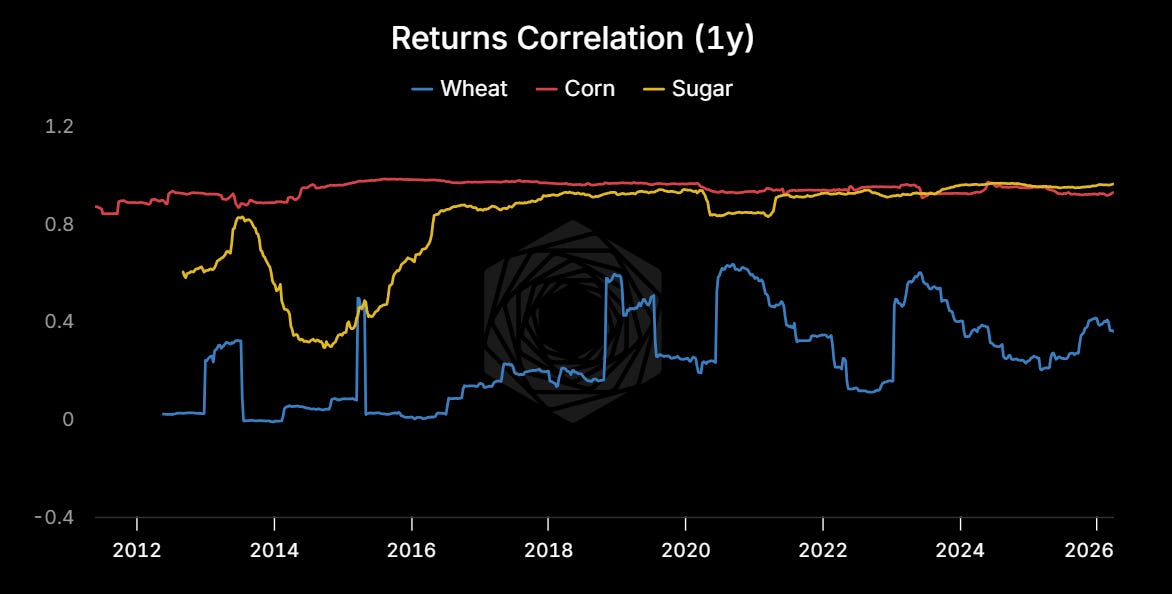
CORN (red) tracks corn futures at roughly 0.95 consistently. CANE/sugar (yellow) has converged to around 0.95 in recent years. But WEAT (blue) is a disaster. It bounces between 0 and 0.8 and currently sits around 0.5. Half the time it’s barely correlated with the thing it’s supposed to track.
Why? Wheat has the worst roll economics of the three. The wheat curve spends more time in steep contango than corn or sugar, so the rolling index (and WEAT, which rolls similarly) bleeds premium every month. The returns chart shows it visually.
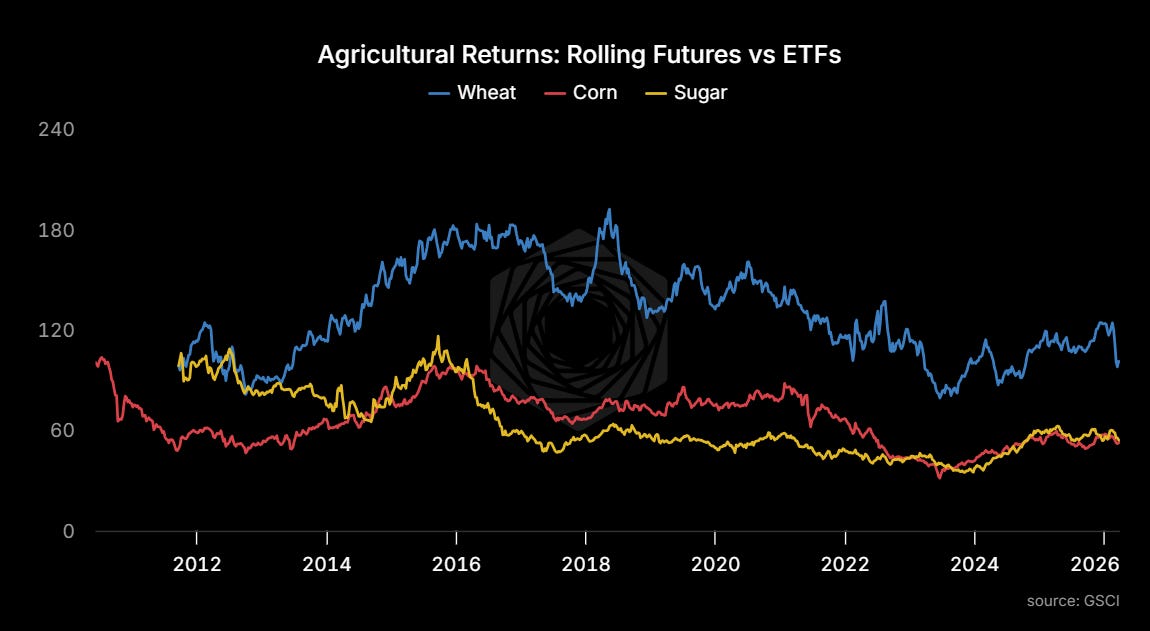
WEAT peaked at 180 in 2018 and has been grinding lower while the underlying futures have had multiple spikes. Corn and sugar ETFs track their futures much more faithfully. The divergence isn’t random. It’s structural, and it compounds over time.
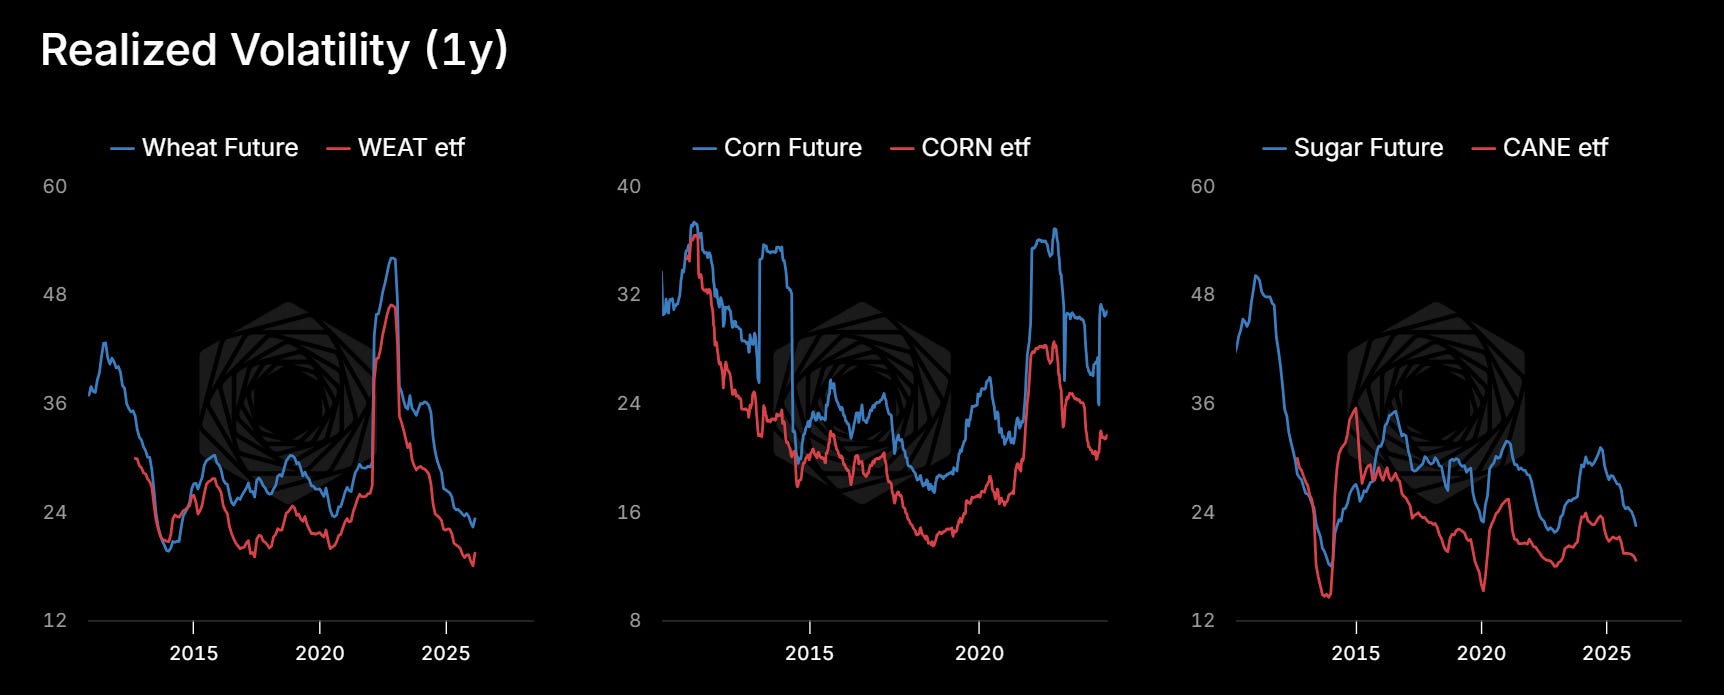
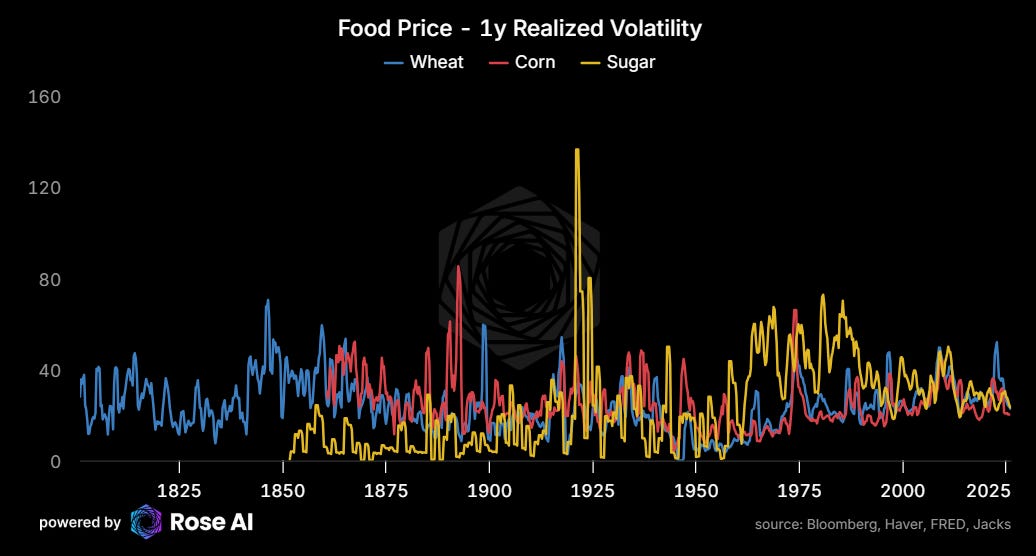
The realized vol panels confirm it. Futures consistently run higher realized vol than the ETFs across all three, but the gap is widest in wheat. That matters when you’re buying options, because the whole point of the cascade trade is convexity. Less realized vol on the underlying means less movement for your calls to capture.
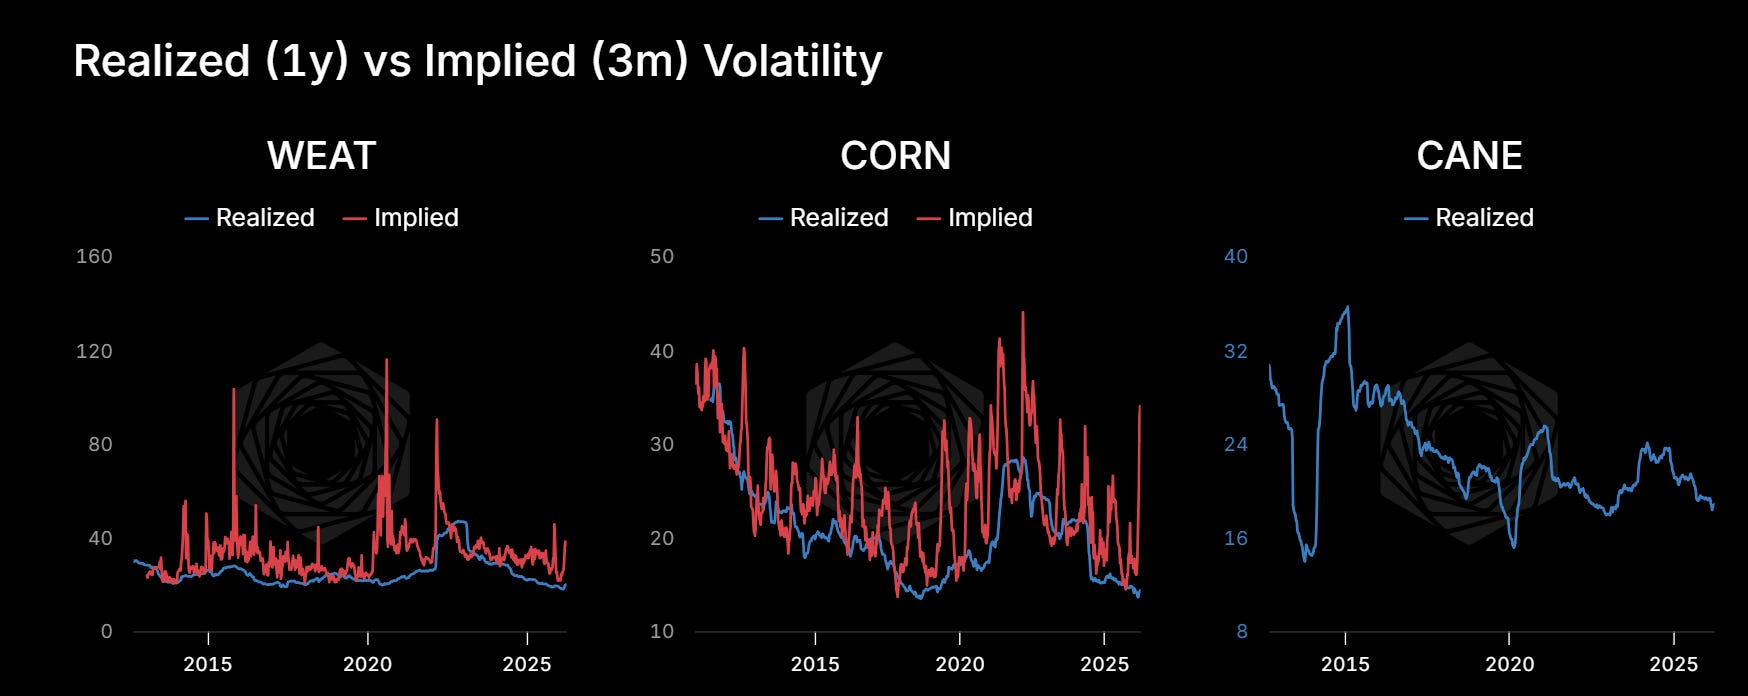
And you’re paying more for less. Implied vol on ETF options runs higher than on the equivalent CBOT contract. Thinner markets, wider bid-ask spreads, steeper vol smiles. All of that adds up to worse entry prices for the same directional bet.
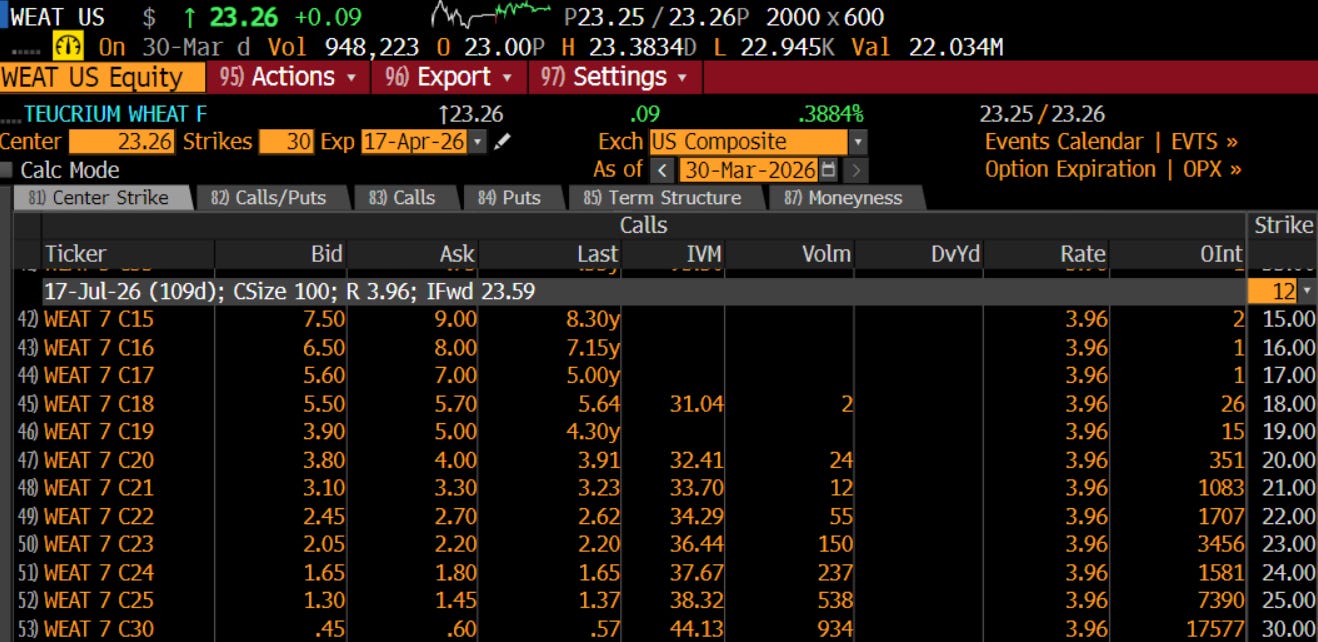
For this piece, the bottom line: CORN and CANE track their underlying futures reasonably well. WEAT does not. The wheat curve’s roll structure eats returns over time and the 1-year correlation between WEAT and wheat futures is currently around 0.5. If wheat is the grain you want, you need a futures account or you need to accept that WEAT is a diluted version of the trade.
If you can trade CBOT options directly, do that. If you can’t, CORN calls and CANE calls are reasonable proxies for the corn and sugar legs. For wheat, there is no good retail substitute. That’s just how it is.
*Correction, 3/31: One eagle eyed reader flagged pricing discrepancies in the original version. They were right. We published with stale quotes and a mismatched reference contract on corn. The trades, structure, and payoff tables above have been updated to reflect offer-side pricing from IBKR as of this morning. The thesis and strikes are unchanged. Total grain premium per set is ~$1,560.
Great write up and ideas. A wee bear case for corn: Josh Linville on X has mentioned a few times that most NA farmers had their inputs locked in prior to the war. Obviously this will be shown by the report today, but may see more corn acreage planted than imagined. that said, I'm still long via futures, with a stop.
Thanks for the shut-out. I thought we weren't supposed to admit to pesky issues like lack of permissions. So not institutional. I ran into the same the same issue with IBRK. Fast to resolve after a long delay because my LLC name was also out of date.