Where is the market for US housing going?
How "long and variable" are the lags in monetary policy?
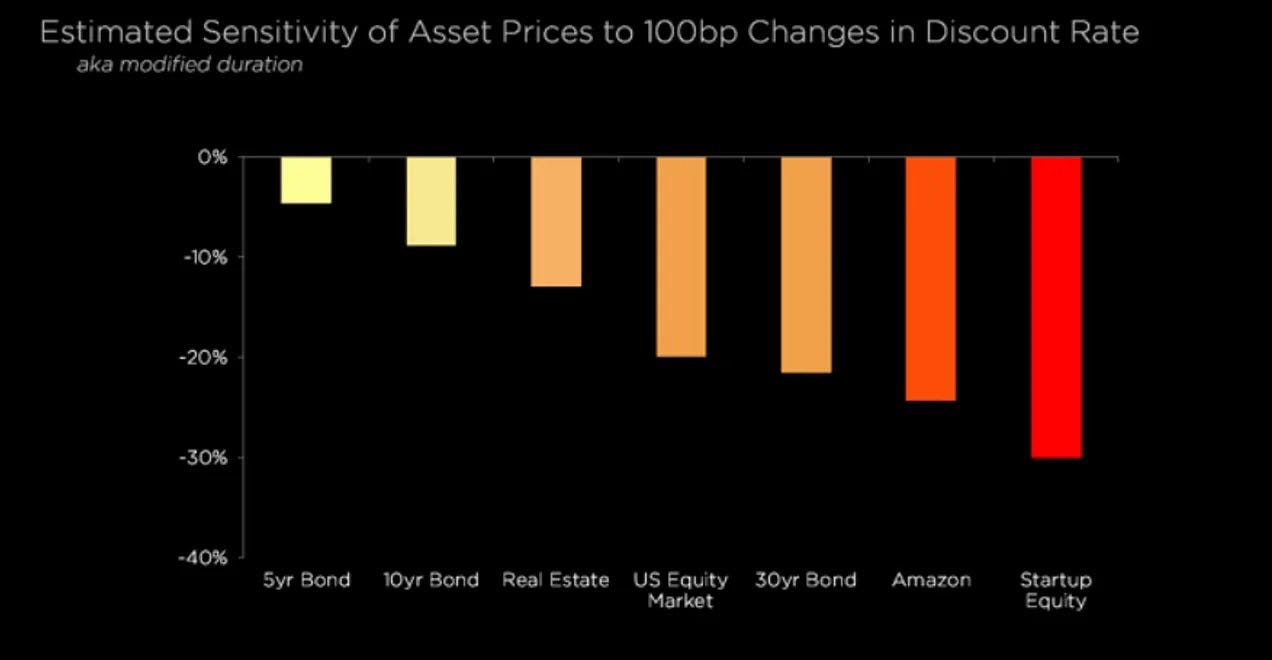
What do you think the effective duration of your home is?
Meaning, how sensitive to interest rates is the price (aka Net Present Value) of that asset?
We ask because, well, mortgage rates are up a LOT.
But then again so are American house prices!
Back in 2016 we called out this fundamental dynamic. In a piece called “Stop buying Real Estate in SF” where we laid out an argument that folks who worked in tech should diversify out of SF real estate, considering how levered the asset class was to both monetary policy (this was the era of ZIRP) and local economic conditions.
As part of a general theme to ‘diversify your life’ portfolio.
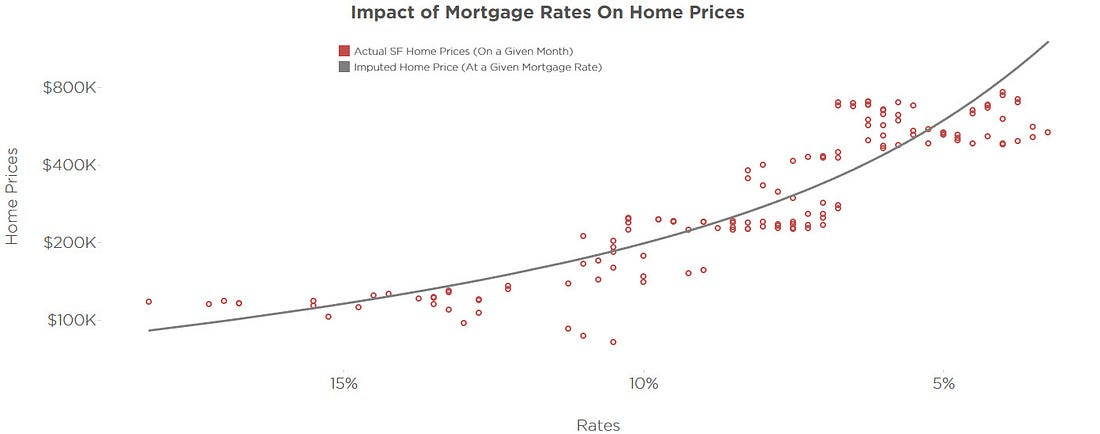
Those local economic conditions being the tech cycle, which had become more dependent on low rates than ever. (See our writings on the ‘unicorn economy’). In that SF article, we made this chart, showing the history of homes in SF and how they tracked against changes what a basic NPV calc would output from the level of mortgage rates.
It’s a fun visualization which really draws out how much interest rates are about time.
In particular, the way lower rates mechanically pull the present value of an asset up by dragging the nominal returns of an asset closer and closer to the present.
Which was relevant at a time where nominal bond yields had been driven down from 10-15% in the 80s to 0-2% in the mid 2010s.
If you imagine your home as a weird kind of bond, where the marginal financing rate for that bond is the mortgage rate, and underneath this mortgage rate is a ‘risk free rate.’ You end up thinking ‘there are bonds in the homes.’ Similar logic to ‘there are bonds in the stocks.’
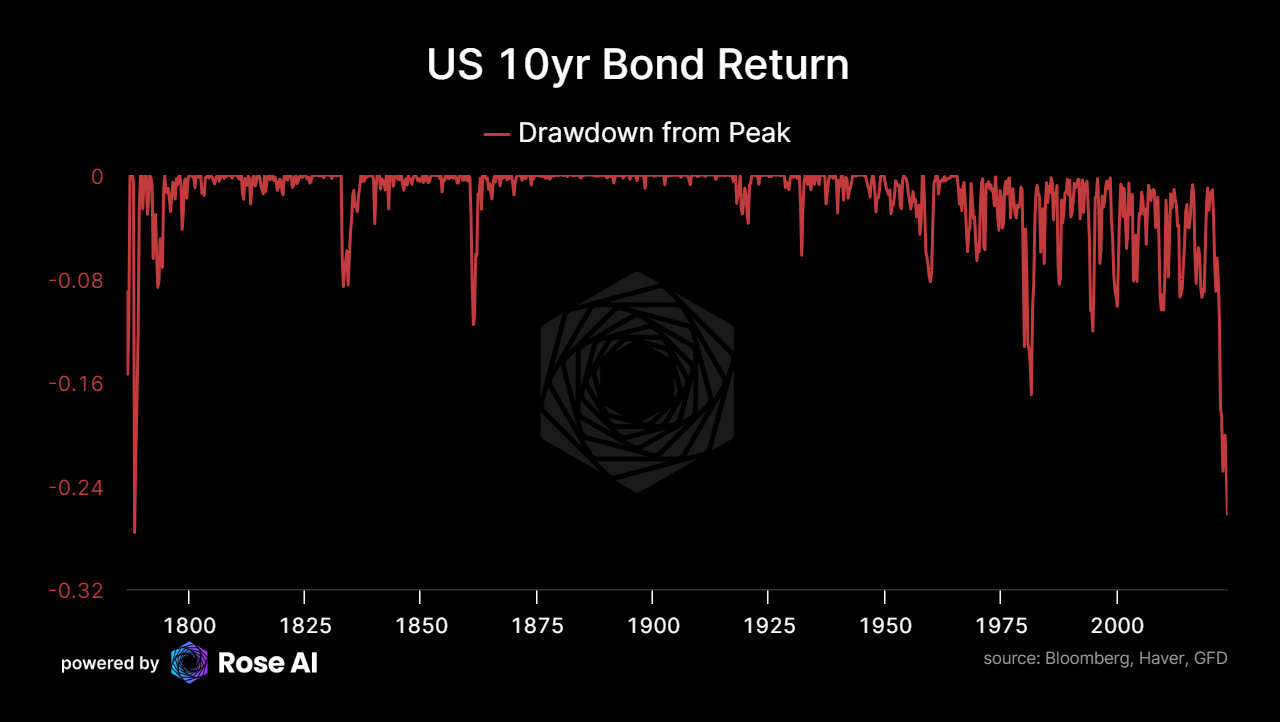
Which, all things being equal would make you bearish, especially given the drawdown in bonds (as of writing the above last fall):
Thing is, turns out home prices care are about a lot more than just national mortgage rates.
There’s actually two markets here, that interact. The market for homes and the market for mortgages. Sure the supply of credit at a national level is driven by rates, but there were local effects as well. When local incomes are higher, so are home prices. As there’s more income in the region to support mortgage payments.
In additional variations in incomes, we see housing valuations (relative to those incomes) also have strong regional differences. All the stuff like weather that leads people to be willing to pay more for the same amount of housing in California or Hawaii, even correcting for how much income they have.
So the argument was that interest rates were at record lows, and when those rates inevitably started rising again, this would likely correlated with a drawdown in tech equity and local real estate conditions at the same time. In a tightening the correlations between tech equity and SF real estate aught increase. As it did.
Which ended up being right locally, insofar as SF home prices haven’t recovered their post-covid highs.
But wrong globally!
Since we wrote that story, US home prices are up roughly 50%. SF Home prices are in drawdown, but from a much higher level when I wrote the piece.
Yet another asset I should have lifted the bid on. Add it to my pile of investment regrets along with the early Coinbase equity, not enough bitcoin, and not being loud enough about gold in the 2018-2023 era.
Anyway, bringing us back to today, you really have to wonder. At what point will higher rates flow through to weaker demand for housing and with it, lower prices?
We took a very quick look at this data, pulling a handful of indicators for demand and supply for housing. Stats like mortgage originations, sales, permits, etc. You can see below where these stats are relative to history (relative to their historic relationship with housing, positive or negative).
When you turn those stats into time series, you start to get something somewhat predictive. Meaning, you can not only see how it measures up against the subsequent changes in home prices, but actually use it to ‘trade’ that asset class. Just a simple way to backtest your logic, and one we will cover in more depth in another ramble.
We’ll follow up more in depth on both this methodology and a deeper dive into housing. Until then, let us know your thoughts, and where you think we are in the cycle. Given the Fed’s precarious dance between easing and tightening, it’s perhaps the single most important asset class for understanding the future moves in global monetary policy.
Disclaimers


I sure don't understand why home prices haven't cratered yet, other than rates must still be too low. For the longest I time I thought "they will never end zirp because if they did, prices will crater and they will all be booted out of office." So that was wrong, or the market is just Wile E Coyote running in the air well past the cliff edge. I get paid a lot, but if I type local asking prices into a mortgage calculator, it's a clear "Nope!" until I look a few hundred miles away where asking prices are about half. The UK is an interesting point of comparison vs US because we don't have 30 fixed rate mortgages, but we seem to be going with "extend and pretend"ing a 25 year tracker into a 40 year tracker. A pile of 2 year fixed mortgages are supposedly set to expire this year and refi higher so that could be interesting soon. But the only thing that has cratered here so far is UK home builder stocks, which boggles my mind when US home builder stocks are at ATHs. Please explain. Also, send help, lol.
As someone who's in the MBS space, when I did an analysis a couple months back, average coupon rate on agency MBS (weighted by notional) was 2.96. Add roughly 75 bips to get you mortgage rates and some origination since then, average mortgage rate in the country is still probably ~4%. Plus with a massive deficit in housing starts vs demand, home prices aren't going to affected until people are forced to sell (i.e. unemployment). Still a long way to go in the cycle for that to happen.