There are Bonds in the Stocks
Amongst other things...
Back in 2020, we wrote a piece called Inflation, Deflation, Bubble.
The basic idea was that we were at the end of a generational wave of disinflation and lower rates. Two trends that were unlocked by what I call the “Volcker dividend.”
Further, that after a decade of ultra low rates, investors had piled into assets with “duration” (read: exposure to long-term interest rates) at the very moment when there was reason to believe that conflict and deglobalization was about to unleash the inflationary monster.
It was quite a ramble, but with a relatively simple take away:
Maybe, just maybe, folks have way too many bonds, and not enough gold in their portfolio.
Well, turns out we were right. Inflation was right around the horizon…
Which meant that, indeed, folks had too many bonds and not enough gold.
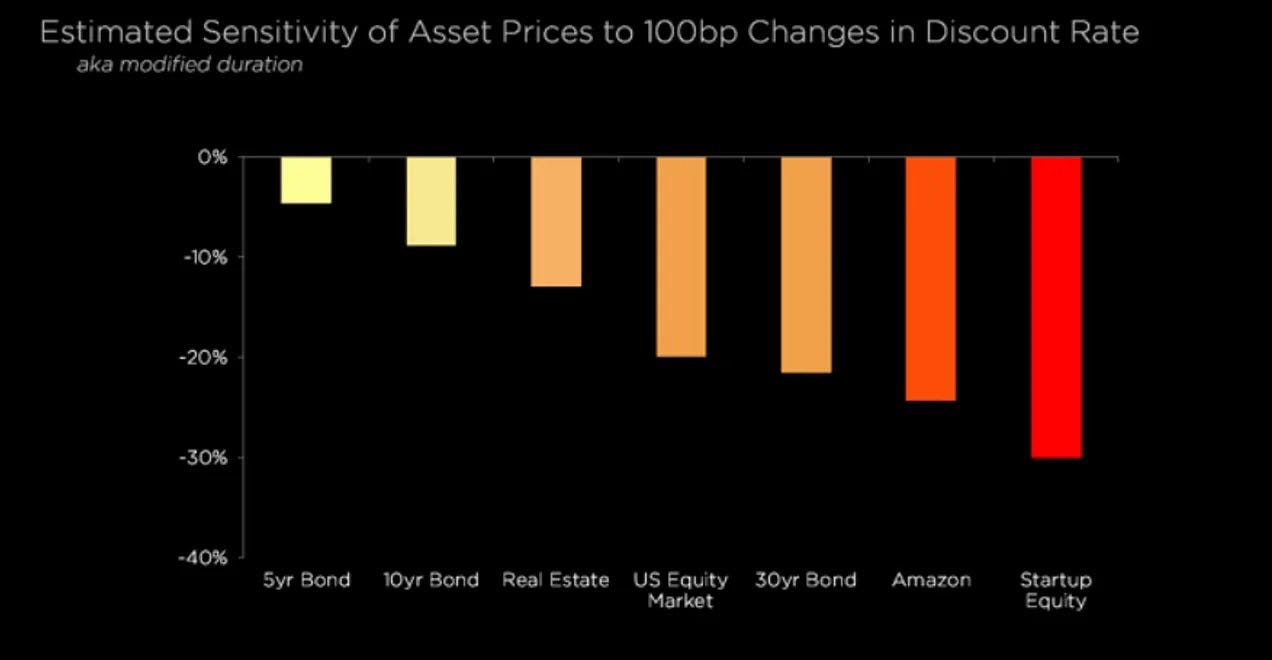
There was a second theme in the article, which was that not only had investors put too much money in fixed income assets with too much duration, but that folks didn’t appreciate how many “bonds were in the stocks.”
Most financial assets are explicitly or implicitly valued by discounting the present value of their future cash flows, and when you did the math, it turned out that many stocks actually had more exposure to interest rates than bonds.
Particularly ‘growth’ or ‘tech’ stocks where a the vast majority of the future cashflows were very far into the future (not to mention very uncertain).
When you think about the payoff to a startup like SpaceX or anything ‘deep tech’ this intuition starts to make a bit more sense. When someone is promising to lose money for 20yrs in exchange for a chance at a mega-payment at the very end, well, that starts to sound a bit like what a bond investor might call a ‘zero coupon bond.’
Which brings us to today, three years later, with yields on 10yr bonds approaching 5%, representing 400bps of tightness to financial assets.
Now stocks don’t monotonically decline when bonds sell off. In fact, since Volcker killed inflation in the 80s, financial assets became driven much more by changes in growth than changes in inflation. Shifts in growth tend to move stocks and bonds in opposite directions whereas inflation moves them in the same direction.
Strong growth is good for stocks, and bad for bonds.
Weak growth is bad for stocks and good for bonds.
Higher inflation is bad for BOTH stocks and bonds, and vice versa.
In this way, we can see a lot of the “Greenspan Put,” where monetary policymakers responded aggressively to weaker growth by cutting rates was actually a function of what I call the “Volcker dividend.” Greenspan was able to always cut in response to weaker growth because he wasn’t worried about rising inflation!
This led to a persistent negative correlation between stocks and bonds, and unlocked a host of investment strategies which relied on this negative correlation to provide ‘balance’ to portfolios. In essence convincing investors to load up on bonds, so as to hedge their stocks.
In an age of rising and volatile inflation, these strategies can no longer count on this negative correlation!
To some extent, this should be obvious to folks. It’s not just the esoteric math of discounted cash flows that drive this relationship but common sense.
With interest rates on US bonds approaching 5%, stocks now have to compete with bonds yielding 5%. These bonds are not risk free (as we are seeing, the mark to market on them can be pretty brutal), but the coupon payments basically are. If you are a dollar based investor and you sit on your bonds to maturity, you will get your 5%. That’s pretty good when a lot of stocks are promising low low dividends and are priced to perfection!
This is why, back in August, we helped some of our clients hedge their equity exposure via options. Which is a subject of another ramble.
So while we wait for the market to price out just how many bonds are in the stocks, we are left with a couple of secondary questions:
How many bonds are in the homes?
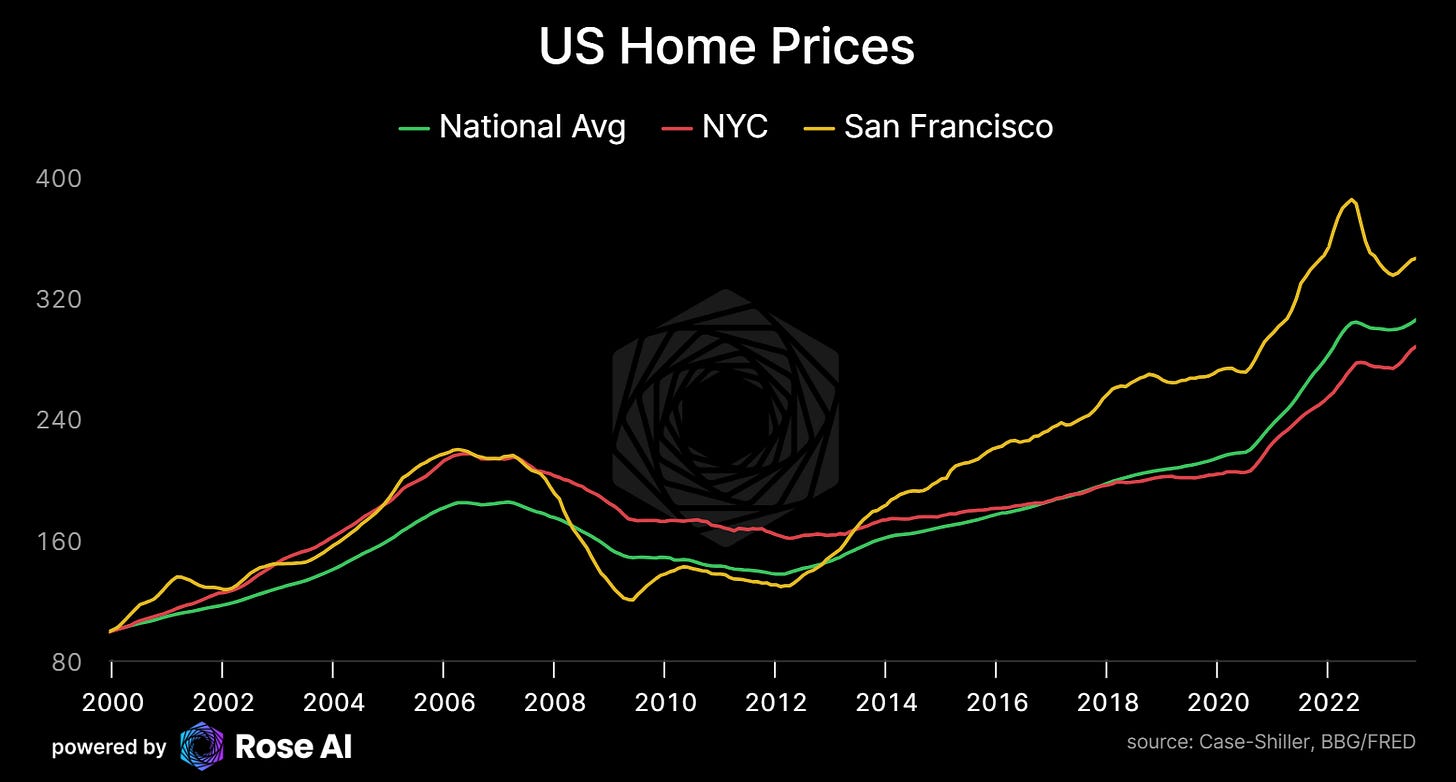
Along with the surge in rates comes a massive shift in the affordability of mortgages. The monthly payment for a $1m mortgage has gone from $4k/m to $7k/m in a little over two years.
As you would expect, mortgage applications have collapsed.
While home prices, remain strong. Begging the question of how “long and variable” the lags are between monetary policy and this particular market.
How many bonds are in the banks?
We don’t need a drawdown in real estate prices to lead to pain for the banks given the move in rates. The reality is, going into the failure of Silicon Valley bank et al late last year, American banks had a voracious appetite for duration. After a decade of “accommodative” monetary policy and regulatory support for sovereign debt (which we will get to later), many banks piled into government debt and didn’t hedge their exposure to interest rate risk.
The Fed responded to this with the Bank Term Funding Program (BTFP) essentially letting them borrow against the full principle amount of their bond portfolio at 1yr rates.
Note that these rates remain above the yield of the underlying bonds as long as the yield curve remains inverted. A problem that solves itself as bonds sell off.
Are regulators part of the problem?
In the wake of the financial crisis, financial regulators decided to ‘get tough’ on all those pesky banks.
One of the ways they did that was by trying to harmonize the way that banks accounted for the risks on their balance sheet in a regulatory framework called Basel III. In particular, via a concept called “risk weighed assets” or RWAs. RWAs work by placing a ‘risk weight’ on every asset in a bank, the idea being that complex, opaque and illiquid CDOs aught be considered riskier than say…a AAA sovereign bond.
Pretty much all developed world sovereign debt was given a risk weight of ZERO…
To a student of financial crises, this should have raised red flags.
So many financial crises result from the response by the private sector to changed in rules put for by policymakers fighting the last battle.
“The seeds of the next crisis are sown by the solutions to the last one”
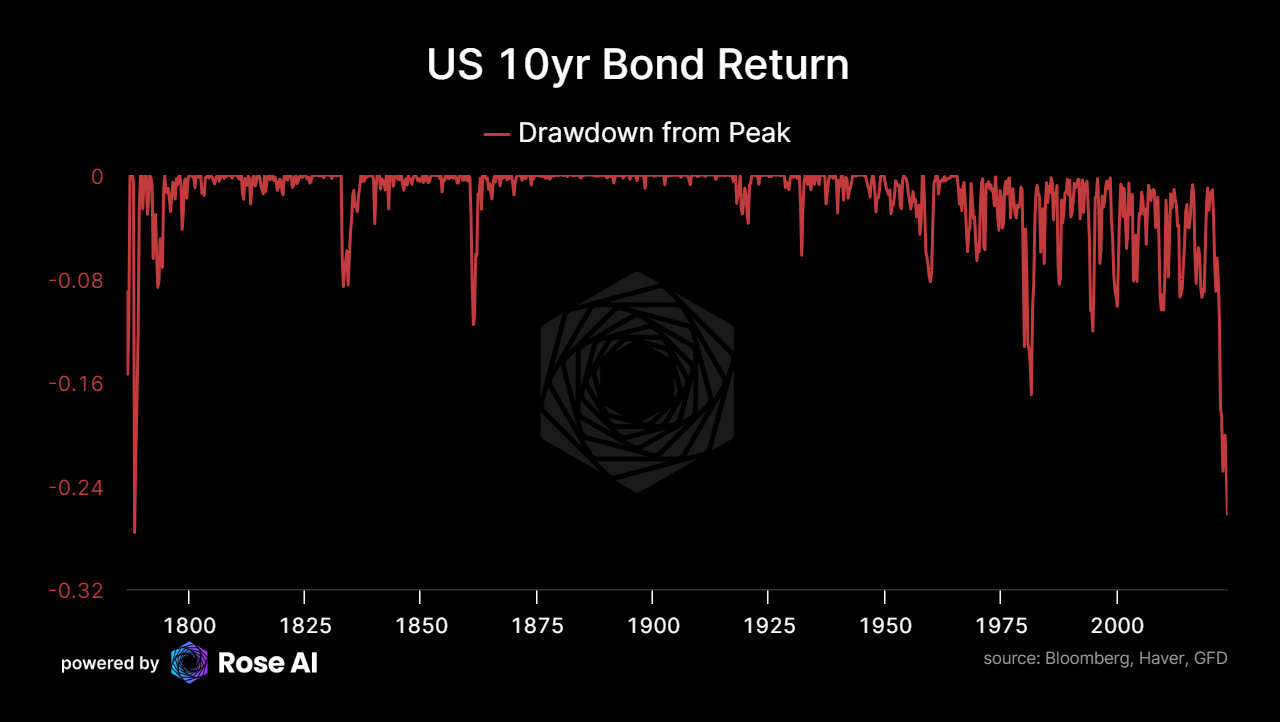
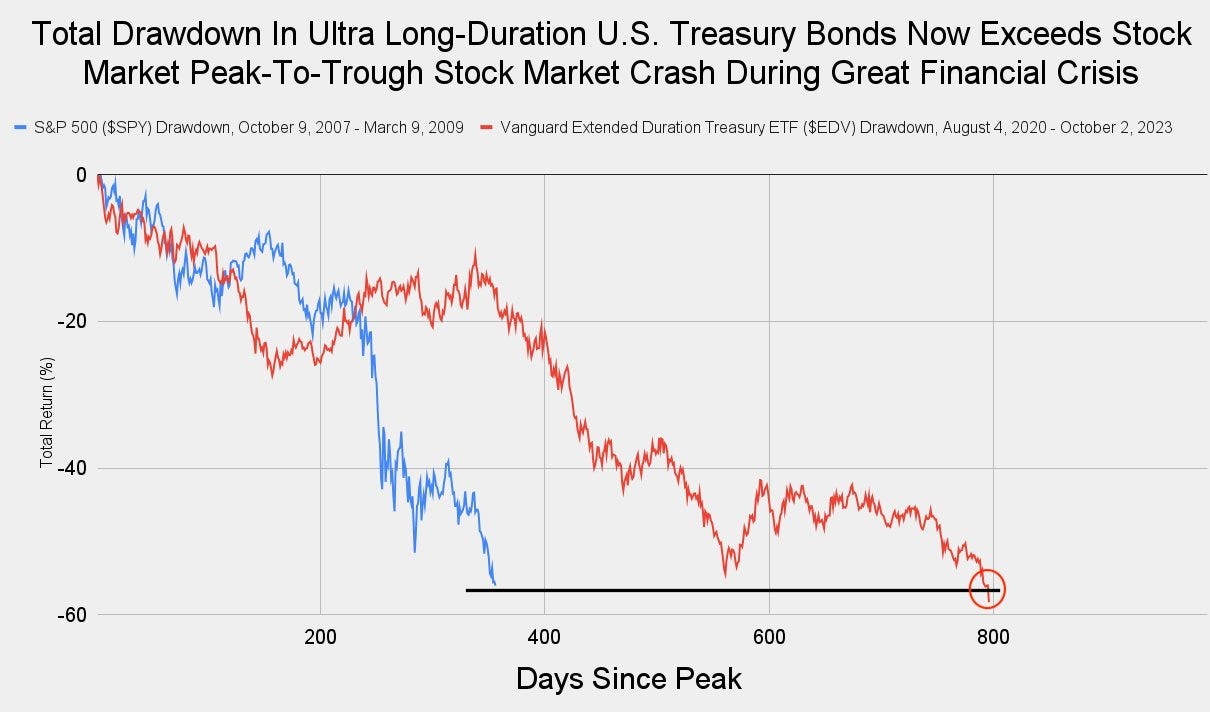
Don’t know about you, but when I see a bond down 98% (!)…
I begin to doubt whether that asset should be considered riskless.
Is anyone hedged?
One of the ironies of this situation is that while regulators may have strongly incentivized the food fight for duration, no one forced the banks to hold this interest rate risk. The global “swaps” market was literally designed for this and is one of the deepest and most liquid markets in the world.
After Silicon Valley Bank exploded, people began to ask, “did they hedge and if so how much?”
At the time, my back of the envelope estimate was that only 1/3rd of bank treasury/agency portfolio was hedged with swaps, and the vast majority amongst the bigger banks.
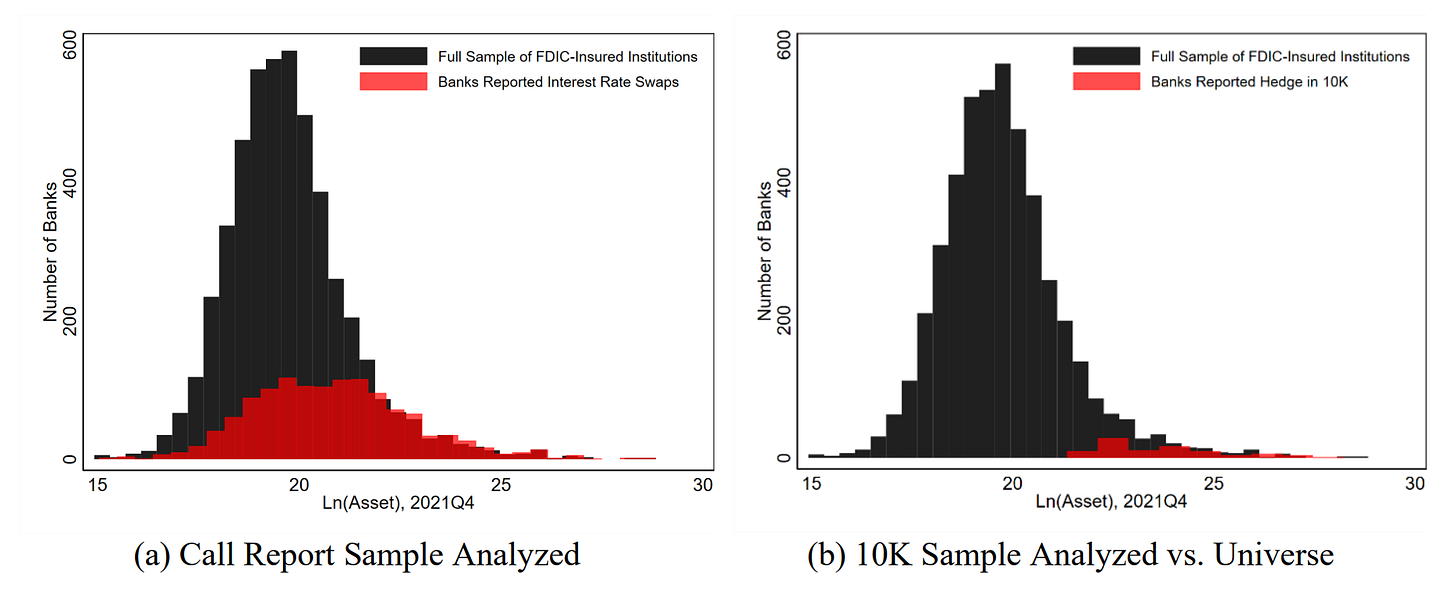
Since then, academics have looked into the question and found results consistent with this, if a bit worse. Estimating that only 6% of aggregate US banking assets were hedged with interest rate swaps, and that riskier banks not only hedged less before the move in rates, but reduced their hedges during the tightening. Meaning smaller, riskier banks effectively doubled down on their underwater books as rates rose.
No wonder credit spreads in US banks have started to widen again.
What about the rest of the world?
This piece has been primary concerned with US monetary and financial conditions, but there’s reasons to believe these problems may be even more acute abroad.
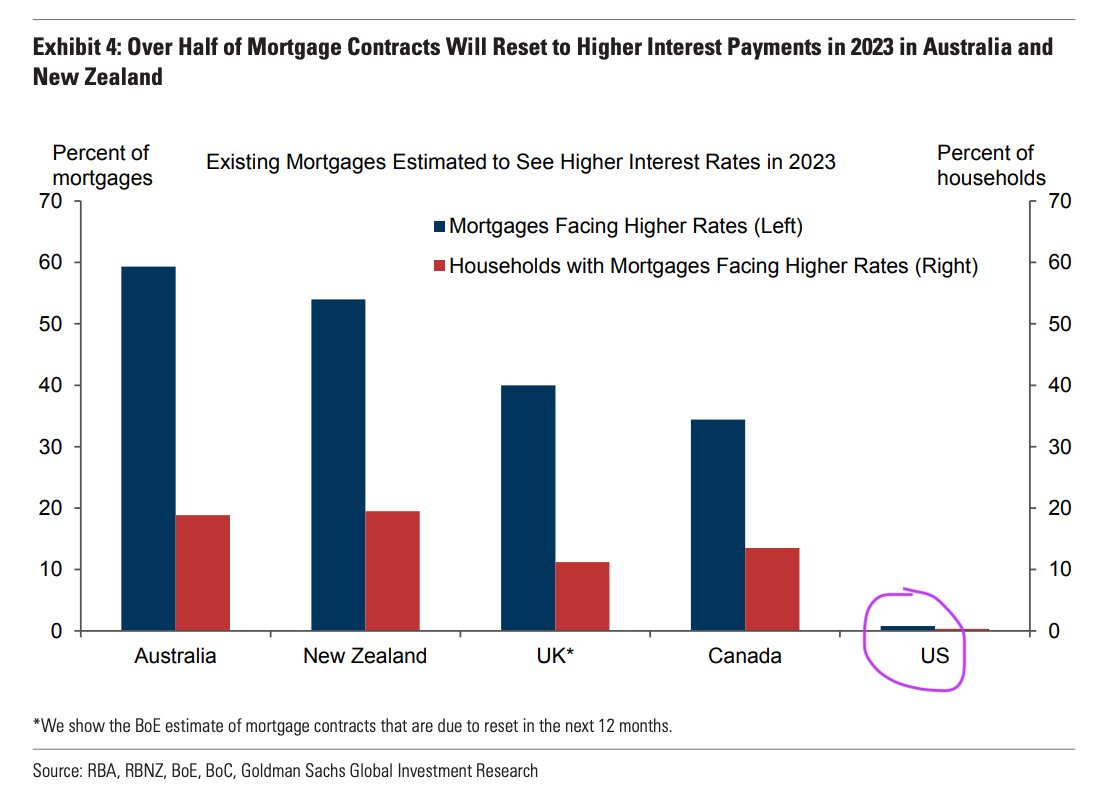
In particular, economies like Canada with variable rate mortgages. In contrast to the US where the majority of folks take out fixed rate, fixed term mortgages, economies with variable rate mortgages transmit monetary tightness directly to borrowers.
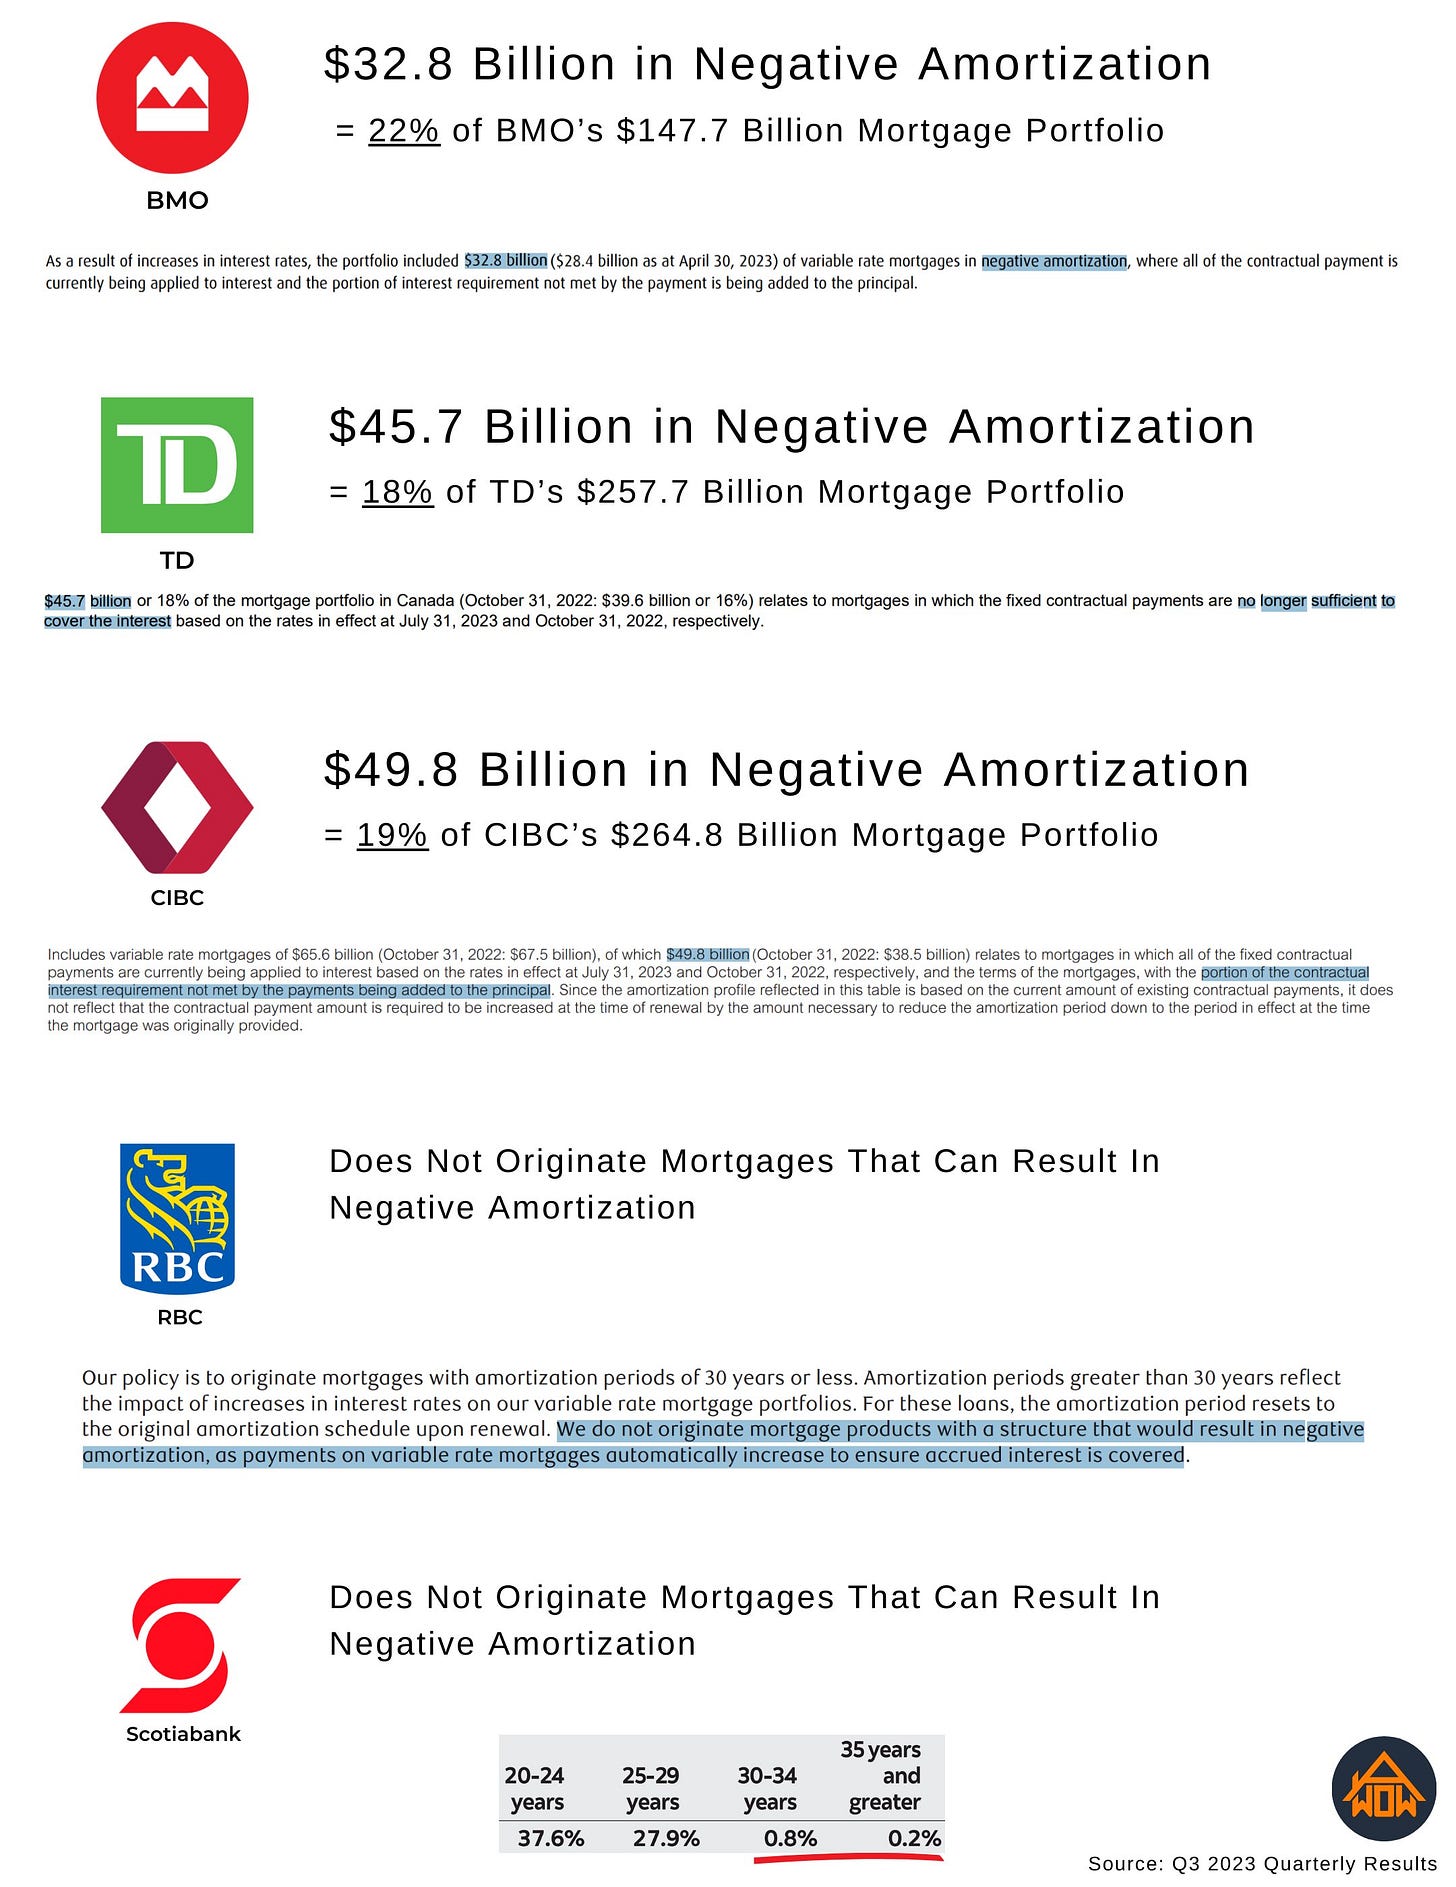
Leading to what will be considered (in retrospect) the most predatory financial product in real estate history: the negative amortization mortgage. Basically a mortgage where rather than increase variable payments along with market rates, bank capitalize the difference between the old rate and the new rate by adding the difference to the principal of the loan (or in some cases, automatically extending the life of the loan). Not all banks in Canada do this, but it represents about 20% of the residential mortgage portfoio for those that do.
Putting new meaning behind Warren Buffet’s “Weapons of Financial Armageddon” phrase.
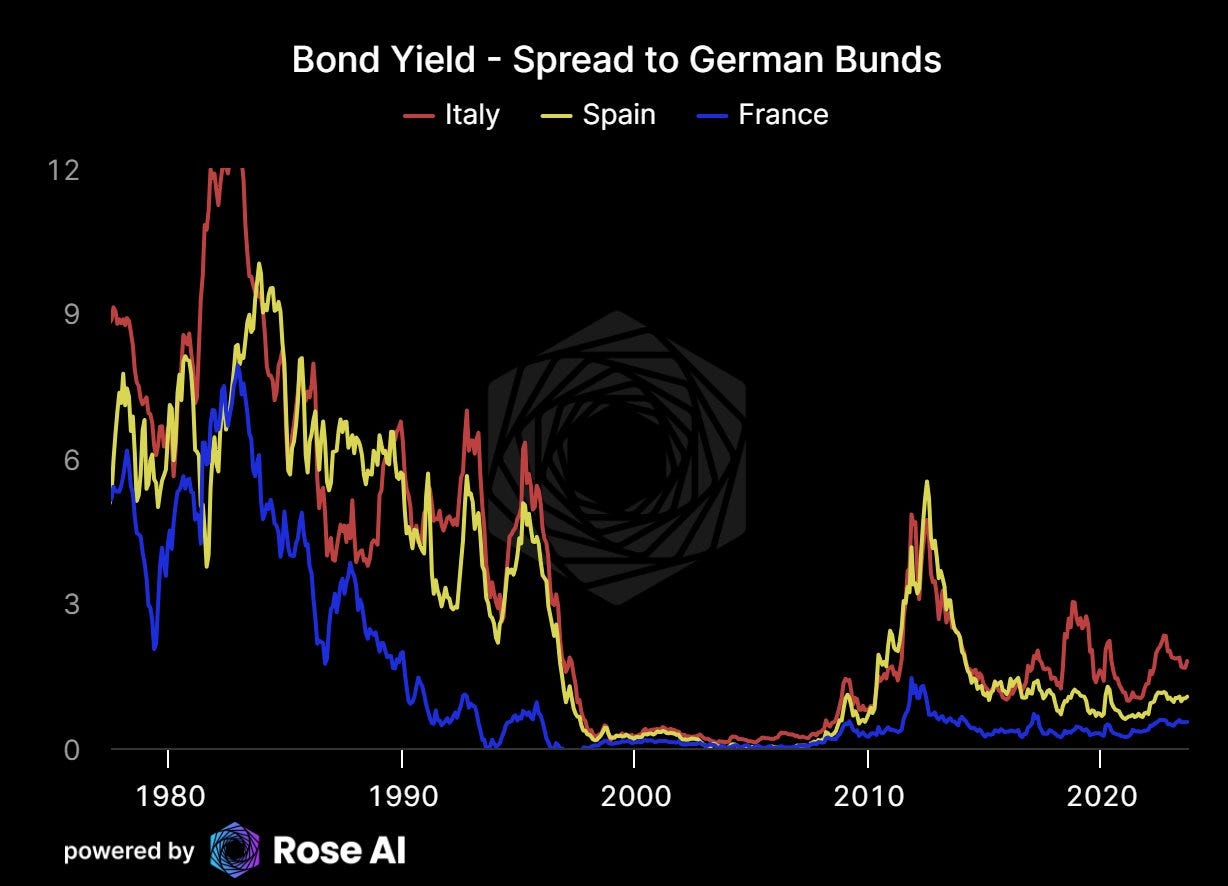
The second place we are worried is Europe. Where not only have they had recent trouble with large financial institutions (hi Credit Suisse!), but where the peripheral economies have benefits from low and falling inflation to help unify borrowing costs across the continent. As debt service costs for the “PIGS” escalates, we expect to see a divergence between the creditworthiness of the peripheral sovereigns.
Finally, Asia. Where not only is China currently in the midst of a collapse in real estate (historically the single best forward indicator for a financial crisis), but where policymakers seem almost existentially committed to an ‘extend and pretend’ strategy that only works when everyone is able to roll their debt, and when there’s no mark to market.
Finally Japan, where the last time US rates where where they are now, rates were 150bps higher.
Good luck out there.
Disclaimers











Residential real estate seems to have the longest lag but looks like it’s finally getting real now. Next six months should be pretty interesting
Great ramble! Hope to read more like this.