

The Strip vs. The Strait
Is this the end of the cycle?


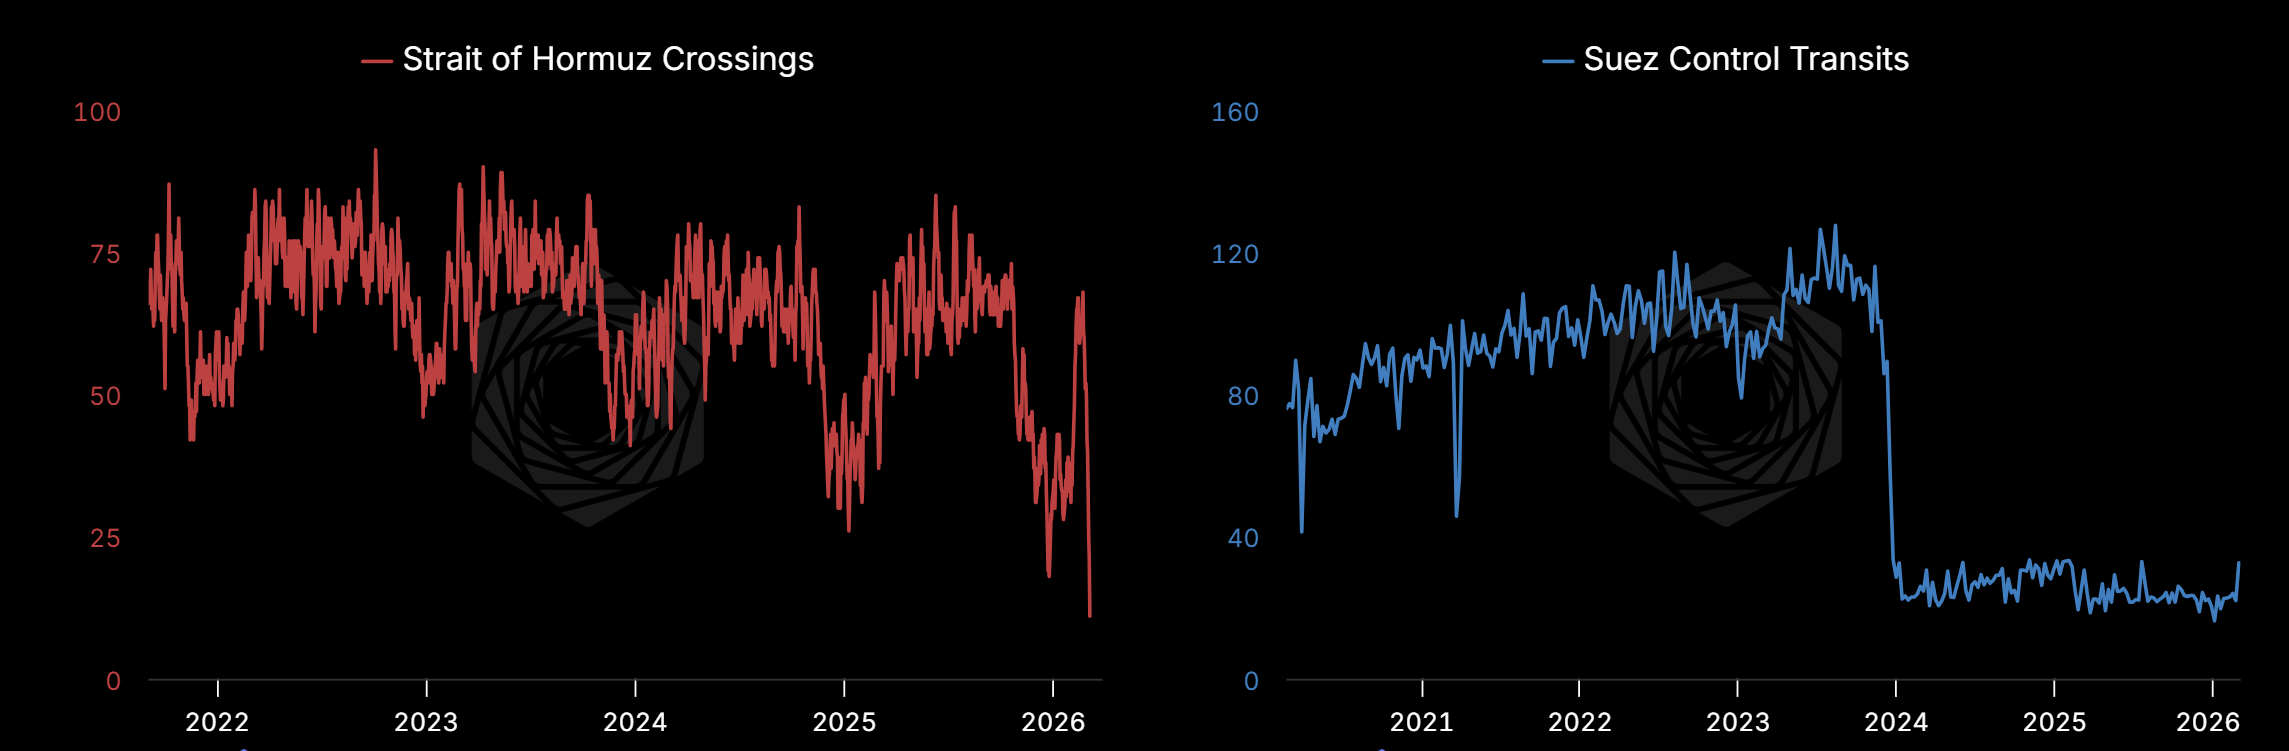
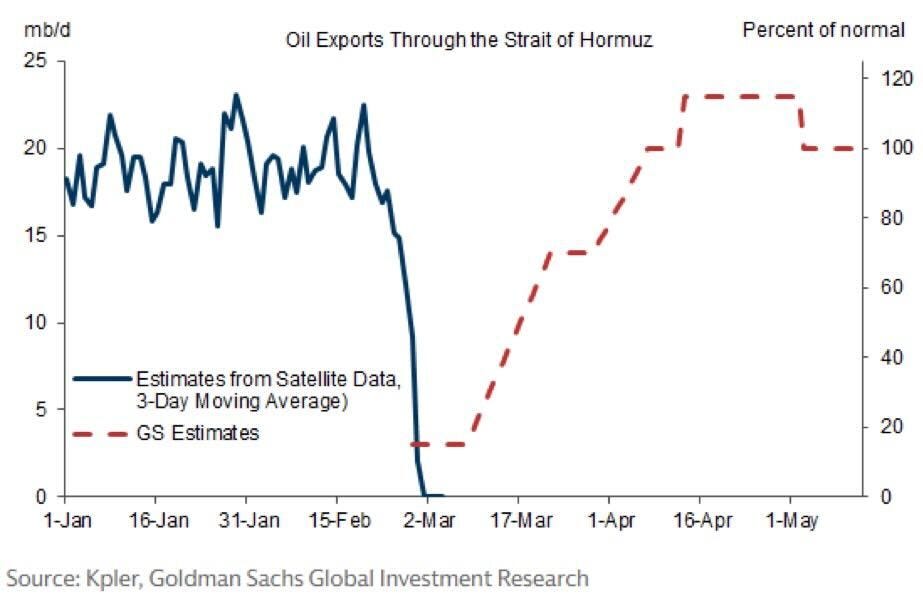
The strait is basically closed.
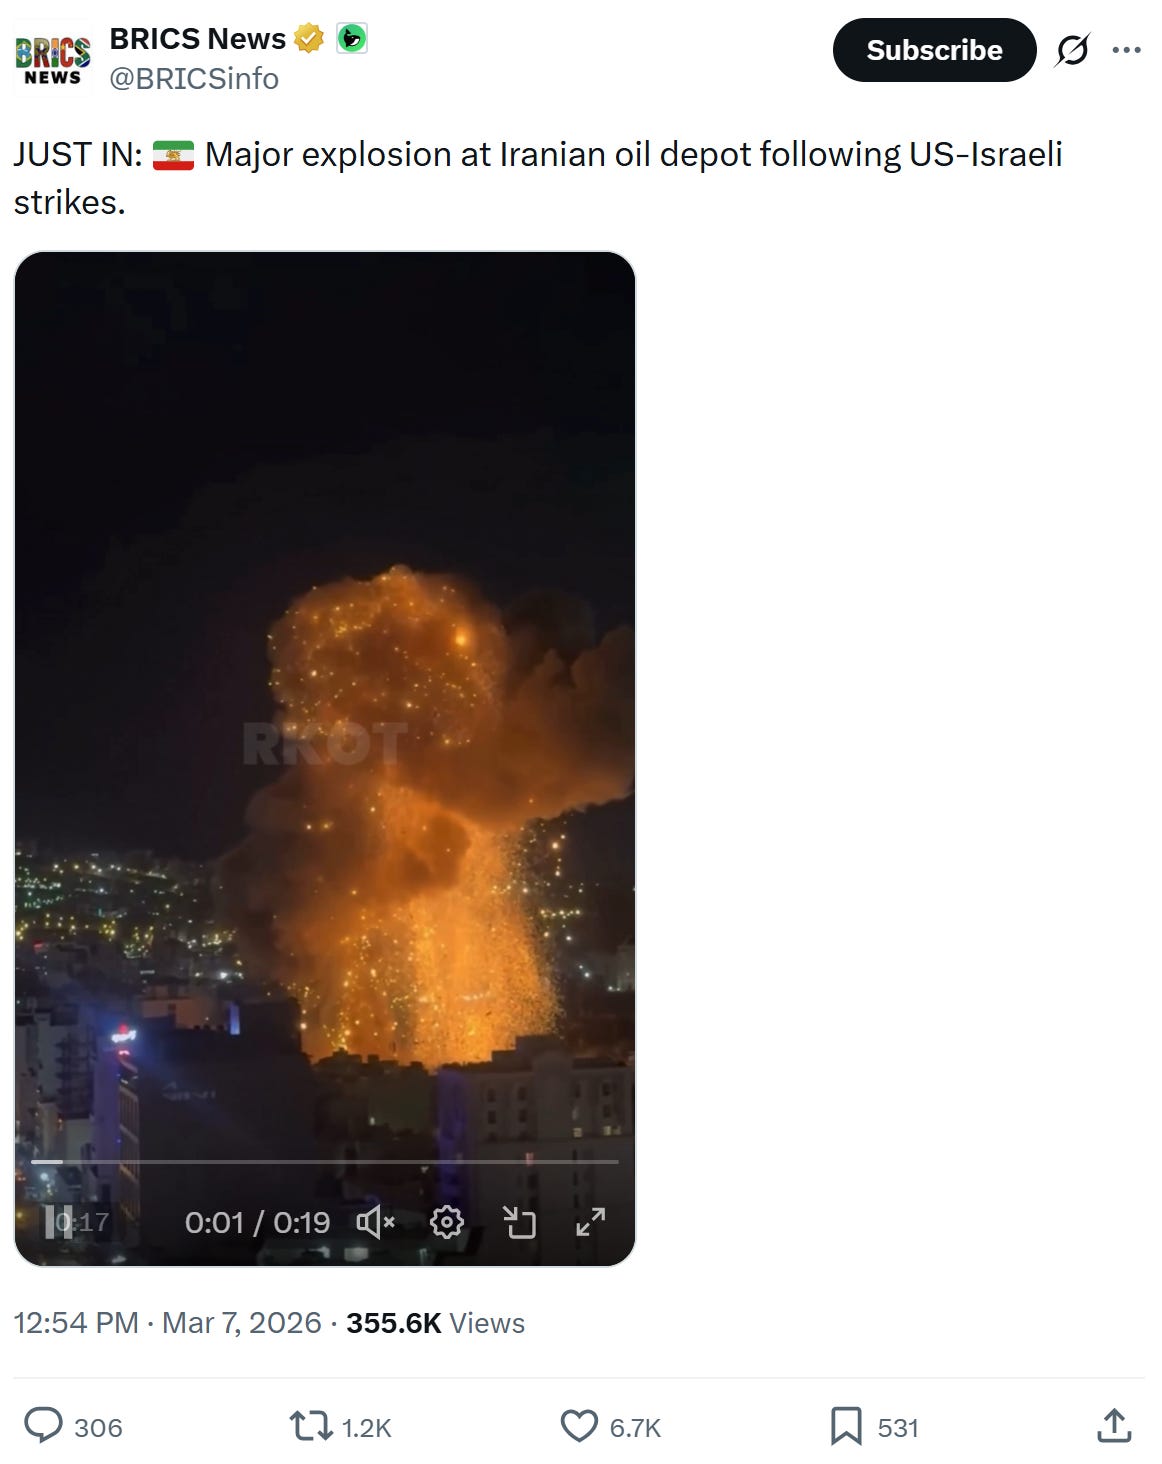
The refineries and depots are on fire.
The regime fights on without clear leadership or command and control. Water desalination plants have started to come under attack as the target set moves from military to economic to humanitarian.
We are at war.
The tit-for-tat dynamics we laid out two years ago have fully transitioned to a negative-sum conflict that has sucked in regional players without many clear offramps. Iran lacks any real leadership that could come to the table for a brokered peace. The emerging rimland coalition continues to grow and attempt to strangle the regime. Over the weekend, as the logic of escalation continued to unravel, crude rallied further while equities looked to trade lower. We expect this to continue.
Iran’s strategy of threatening its neighbors, while good on paper, inevitably hardens them. Rather than forcing submission, targeting the water supply of the UAE and Qatar reveals that Iran is willing to deploy the sword of Damocles it had previously only alluded to. For their leadership, the picture is now clear: submit and continue to live under implicit coercion, or lean into the western alliance structure the US has spent decades laying into the region. By attacking the infrastructure that underwrites their economic, social, and financial systems, Iran is making the choice for them.
Equity markets appear to be in a state of semi-denial about the havoc that a sustained squeeze in energy can do to growth, margins, and liquidity. Spot prices for crude and its many derivative products exploded last week, though the move was concentrated in the front end of the futures curve, pricing a rapid return to normalcy. Equities bounced around as if the chaos could be contained to the energy sector.
We are not so sanguine. Over the next week we expect markets to catch on to the following dynamics:
Sustained tightness in energy markets, which had previously priced in a short spout of disruption. As goes energy, goes inflation: higher commodity prices in the materials that take energy as a large input (aluminum, steel), in the intermediate goods coming through the strait like fertilizer (wheat), and in the sulfur-dependent processing chains (copper, nickel). This inflationary impact will put downward pressure on sovereign bonds through higher breakeven inflation.
Energy stocks, which were flat last week because they price off the full curve and not just the front end, should move higher as the entire curve reprices with the destruction of infrastructure and the likelihood of sustained chaos in Hormuz. Lower growth for the states that import material Middle East energy: India, China, East Asia. Central banks paralyzed and behind the curve as breakeven inflation drives yields higher, forcing a choice between easing into inflationary pressure (risking a repeat of 2021) or holding firm while the labor market deteriorates.
Under-appreciated is the reduction in Gulf state current account surpluses that are normally recycled into US dollar assets. The cut in these flows alone will put pressure on previously high-flying stocks.
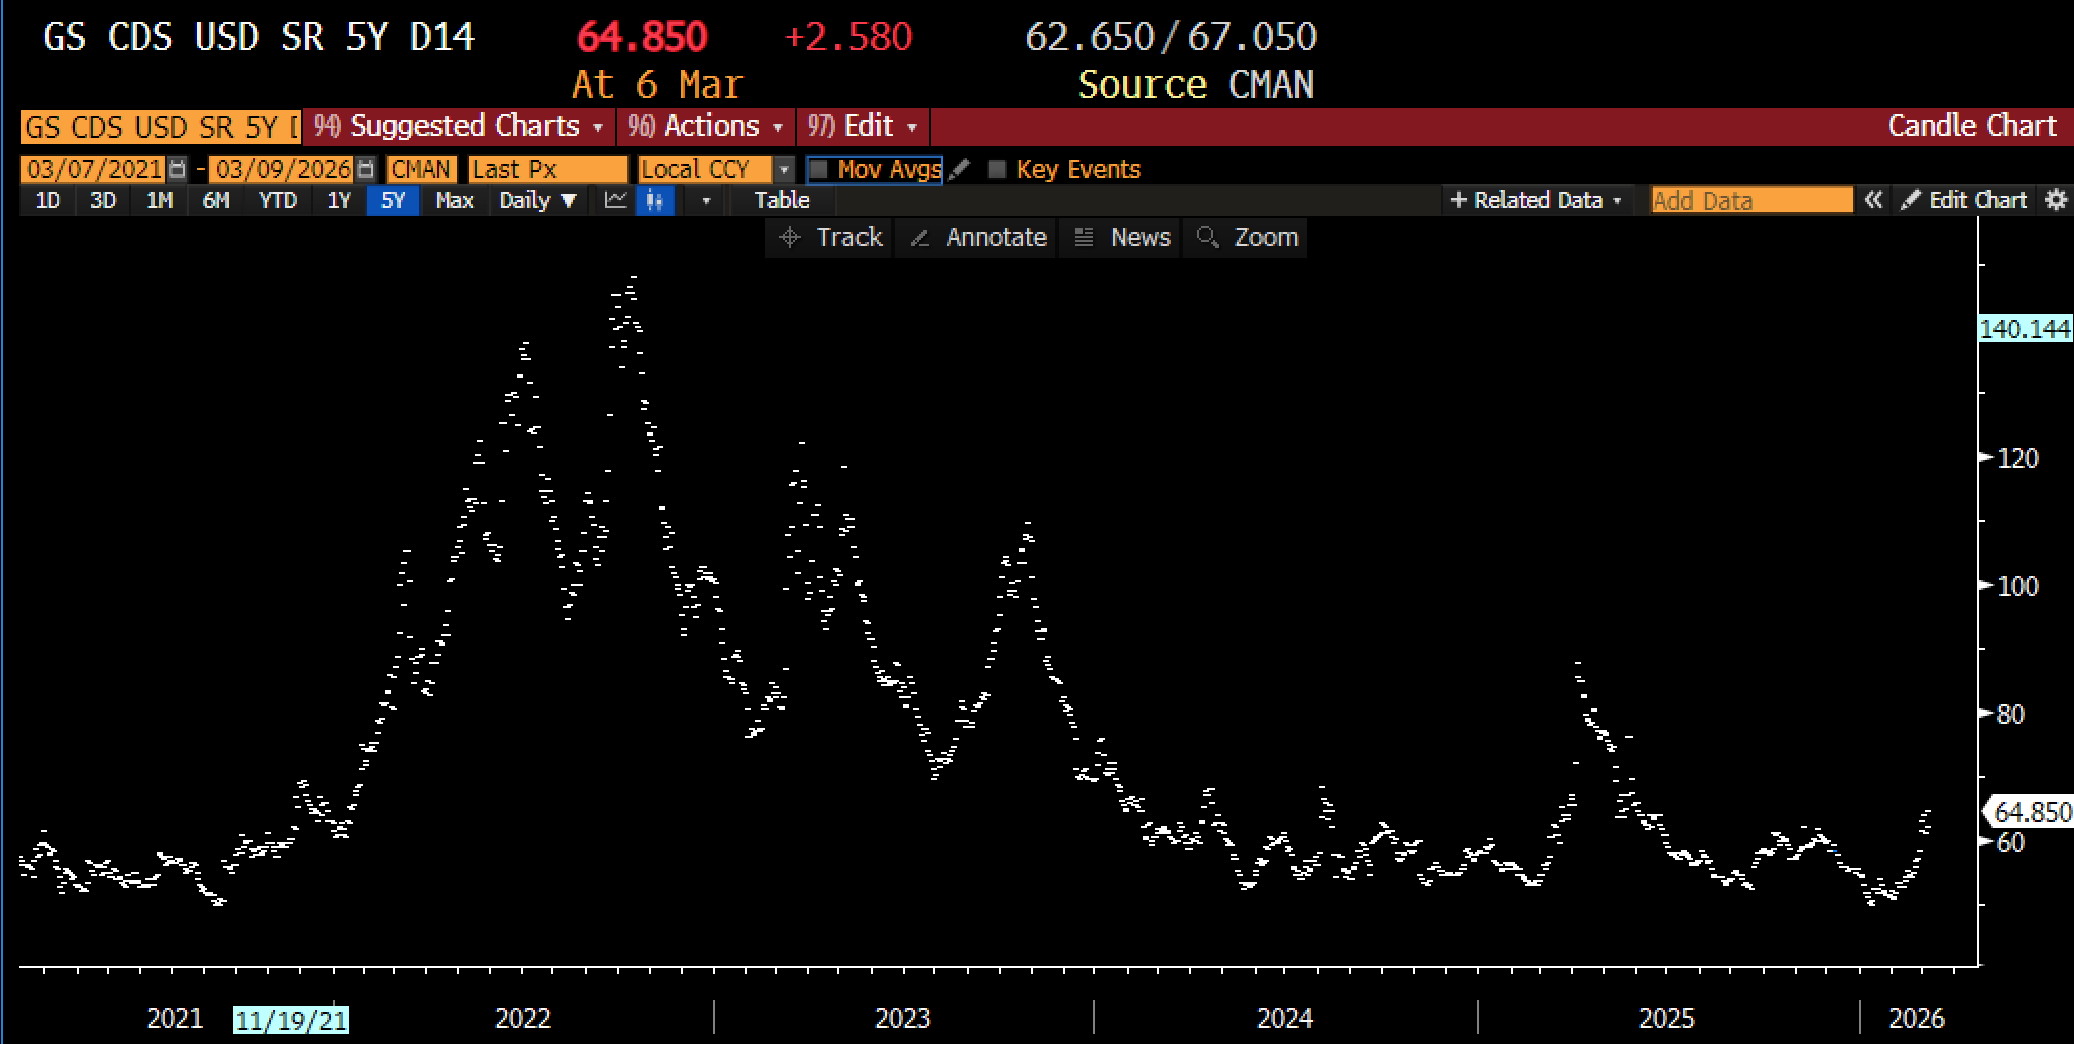
And credit. As we have said ad nauseam for the past six months: watch credit. The combination of tighter liquidity, lower growth, and higher inflation expectations will put strain on energy- and inflation-sensitive corporates, making it harder for them to roll. This will lead to further deterioration in private credit, which has already shown real weakness in the past couple of weeks. The evaporation of Gulf surpluses adds a second risk-off impulse to this space, threatening to bleed out to the broader market and cut into the aggressive capex plans for data centers.
What follows is our attempt to lay out the mechanics of each link in this chain.
The Oil Tightness Is Real
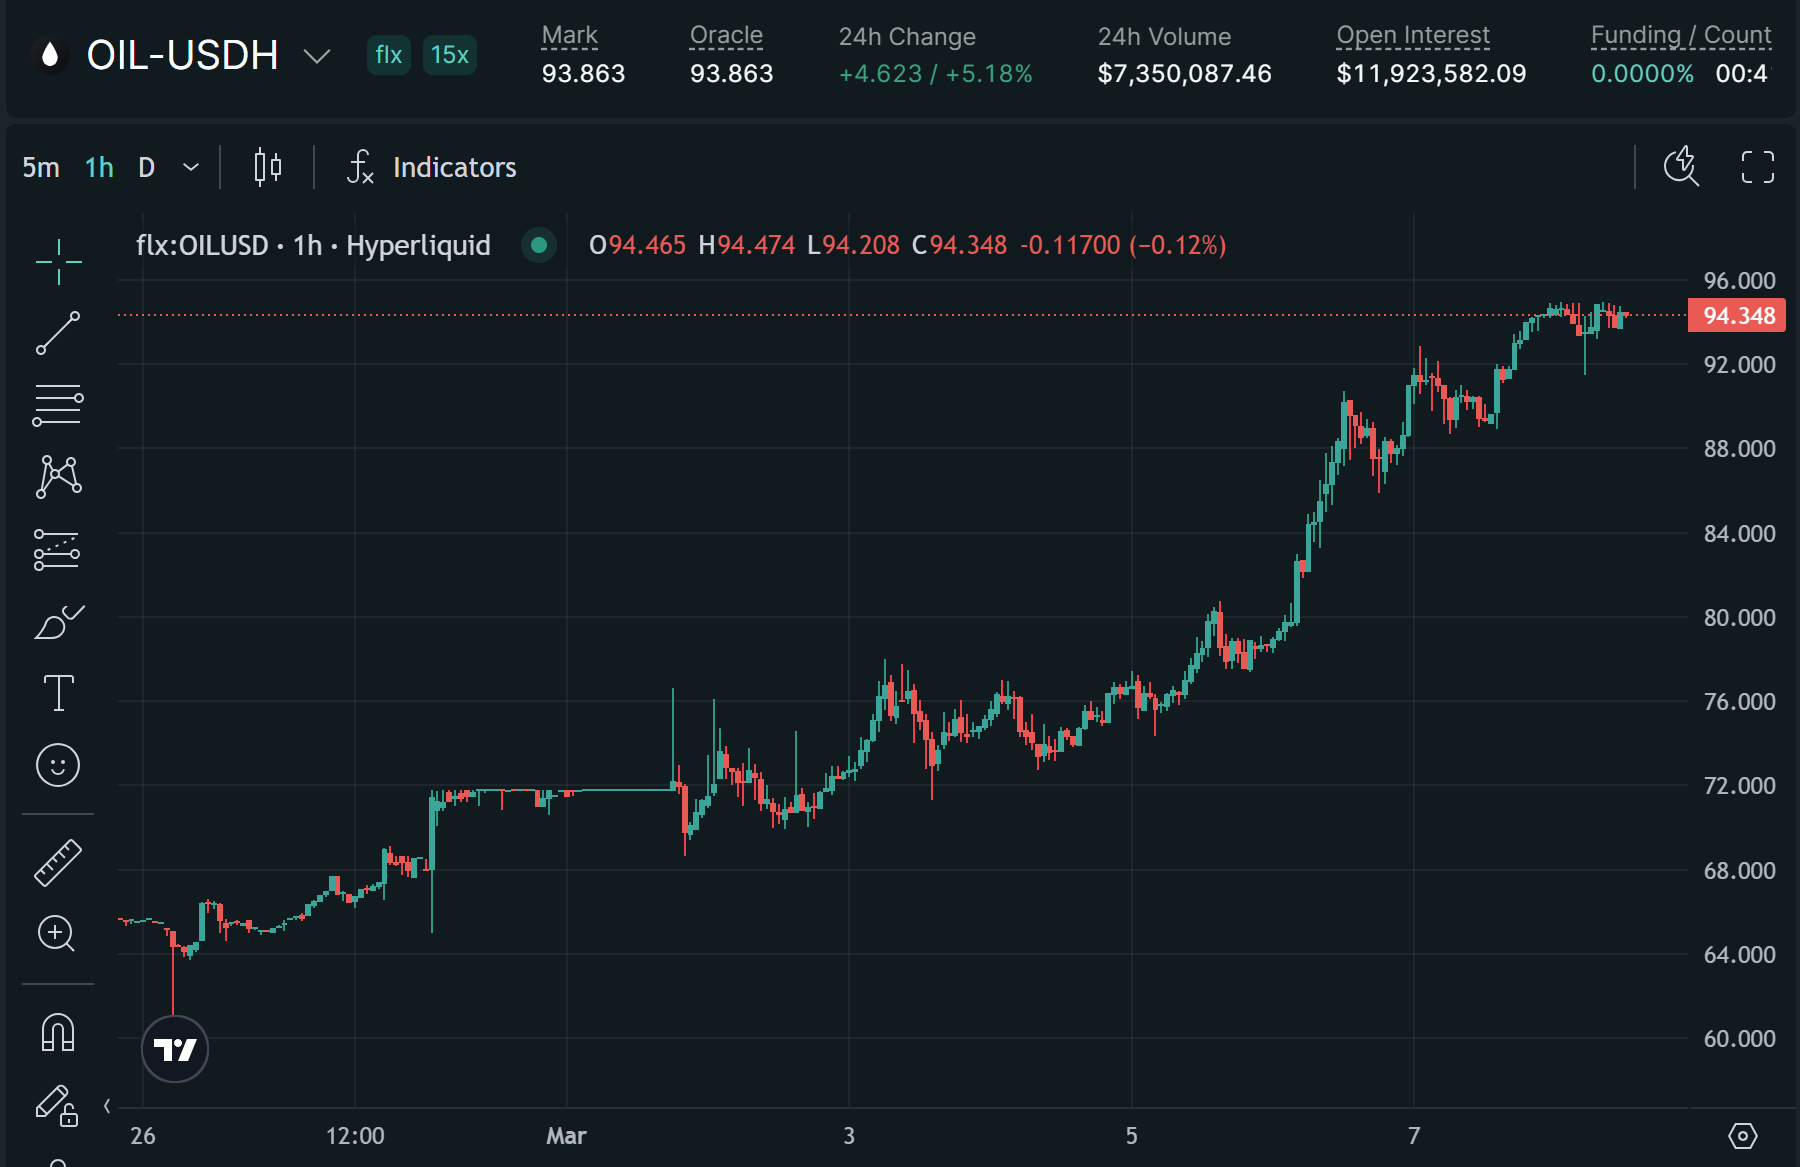
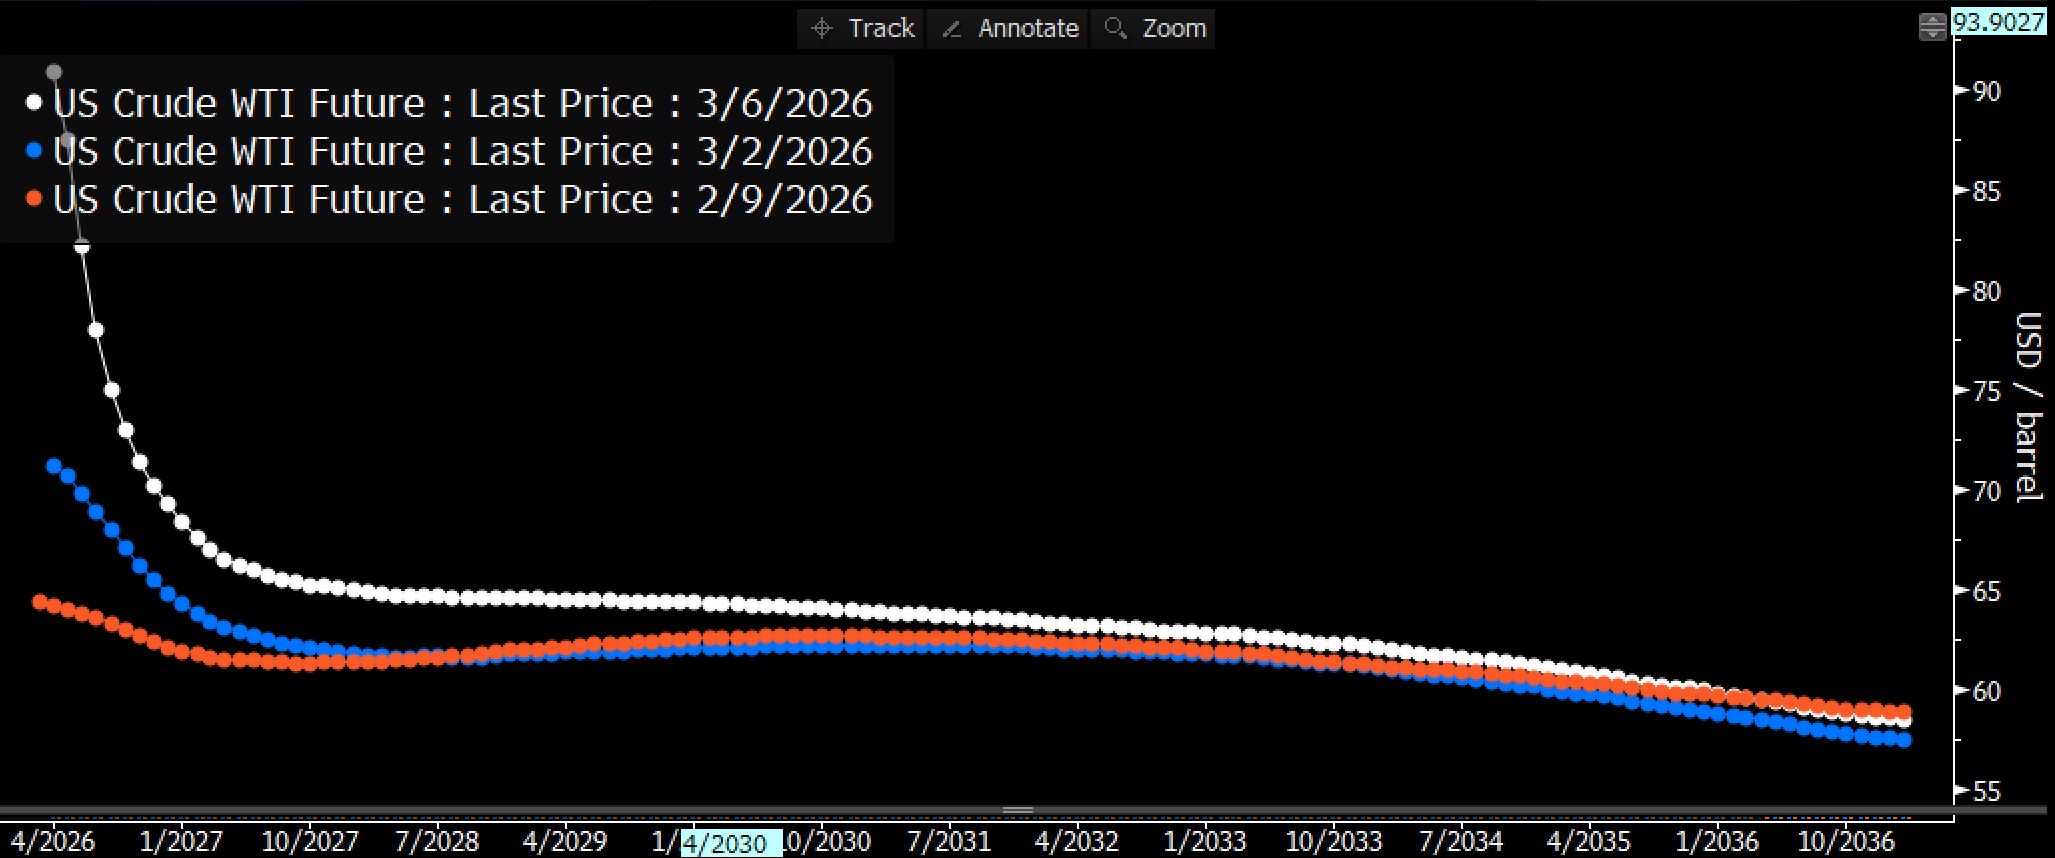
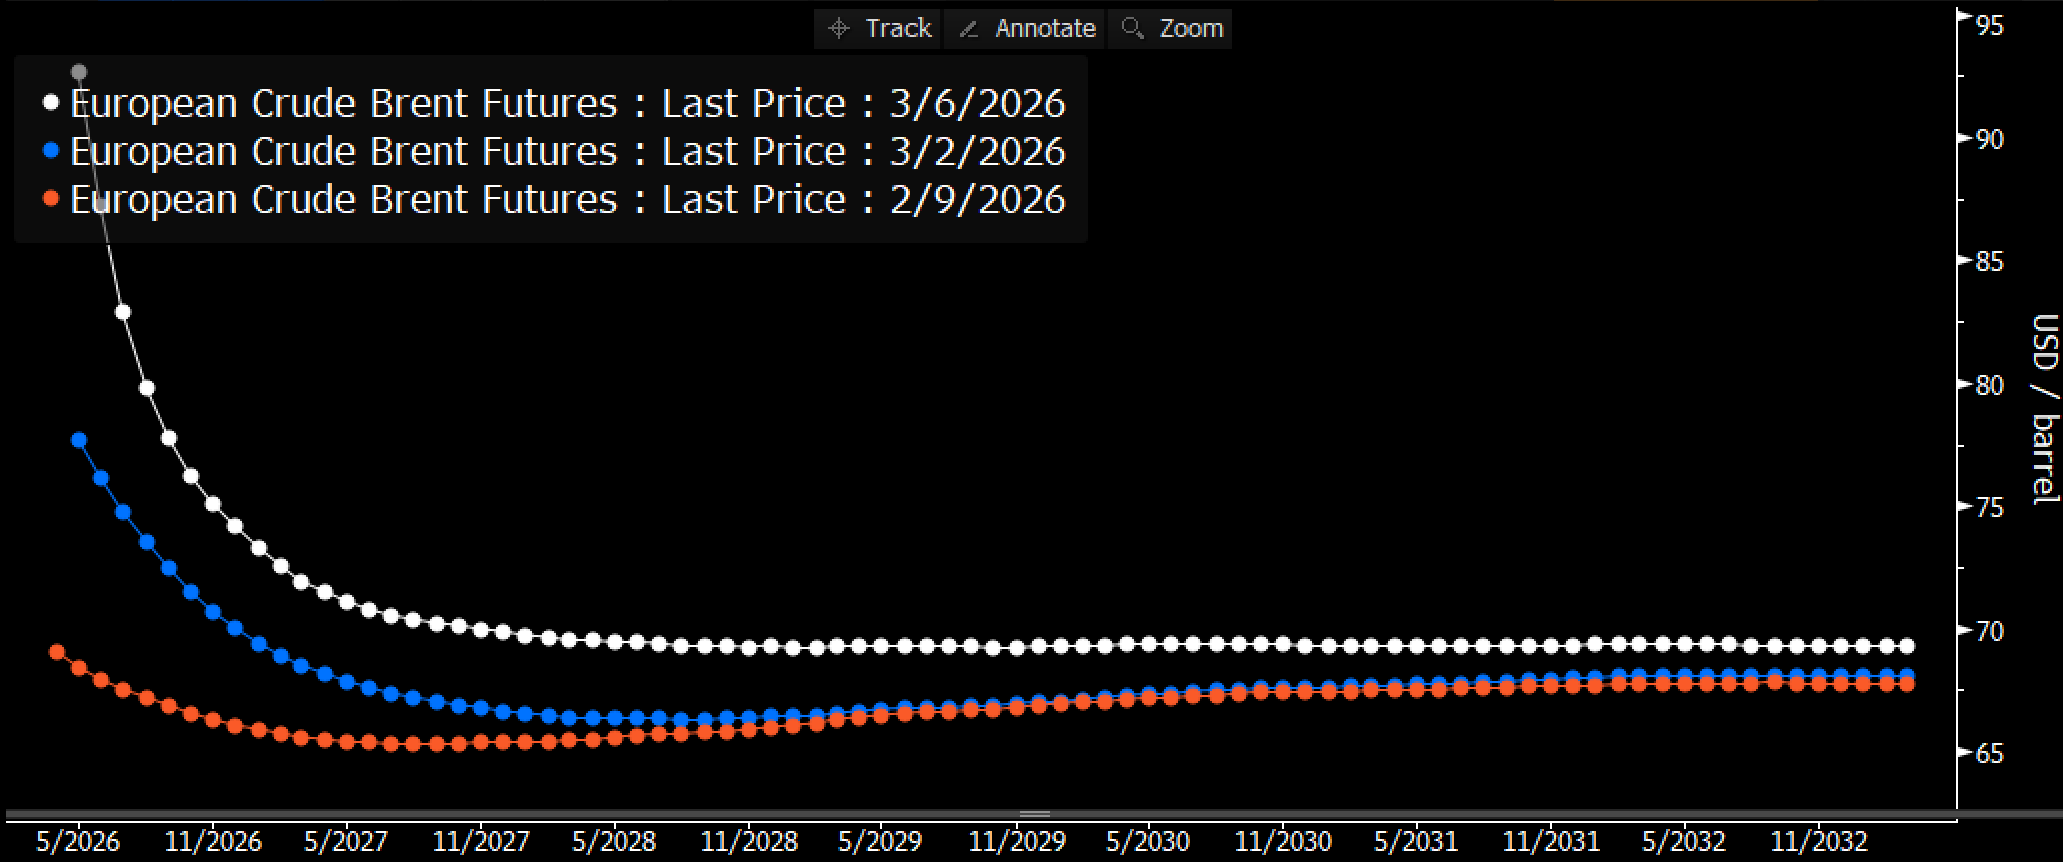
Oil had its biggest weekly gain since WTI futures were first listed in 1983. WTI closed Friday at $91. Brent at $93. Dubai, the benchmark that actually prices the disrupted Gulf barrels, hit $99. The Strait of Hormuz is functionally closed. Ras Tanura halted after a drone strike. Qatar's Ras Laffan LNG facility paused after a direct hit. Iraq is shutting in Rumaila because storage is full and tankers can't leave. Bahrain's Sitra refinery took an Iranian missile Thursday and is burning. Refineries are being targeted. Infrastructure is being destroyed.
Energy stocks don’t trade on spot. They trade on the 12-to-24 month strip — the average price a producer will realize over the coming year, net of hedges. Airlines work the same way in reverse, pricing the jet fuel curve against tickets already sold. When XLE finishes the week flat while WTI runs 56% from its January start, the equity market is making a bet: this is a spike, the strip won’t follow, realized prices won’t change.
That bet was reasonable on Monday. By Friday, refineries are on fire.
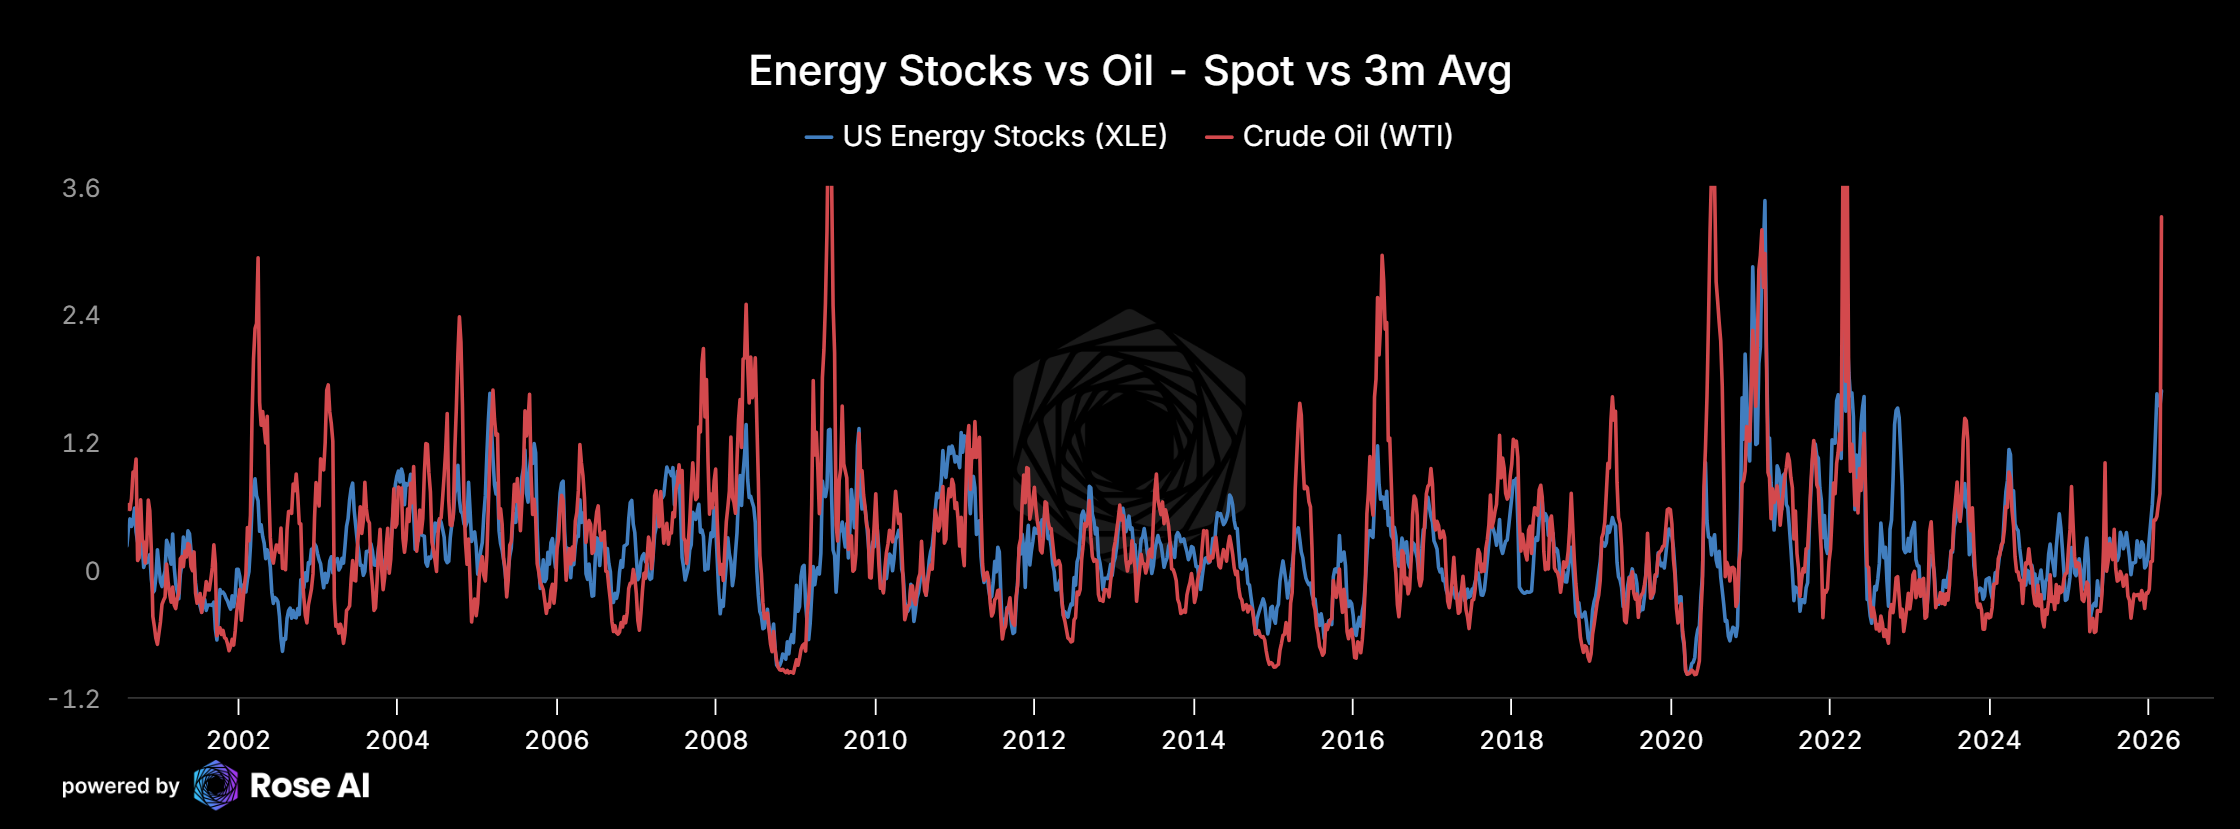
The curve flipped from contango to steep backwardation. Producers rushed to lock in forward sales at the Sunday open. Nearly a quarter of major hedging clients were standing by. Energy stocks had already captured some of the move. Oil ran from $57 to $70 on building tension before the strikes, and XLE rode that anticipation. But the pre-positioning leg and the physical destruction leg are different animals. The first priced risk. The second priced loss.
The benchmark hierarchy confirms it. Dubai at $99, Brent at $93, WTI at $91. The closer a benchmark sits to the disrupted barrels, the higher it trades. Physical scarcity. The Brent-WTI spread compressed today not because Brent weakened but because Asian buyers who can’t get Gulf crude are lifting US barrels as substitutes, pulling WTI up from below. When buyers start rerouting physical procurement, you’ve moved past the risk premium phase.
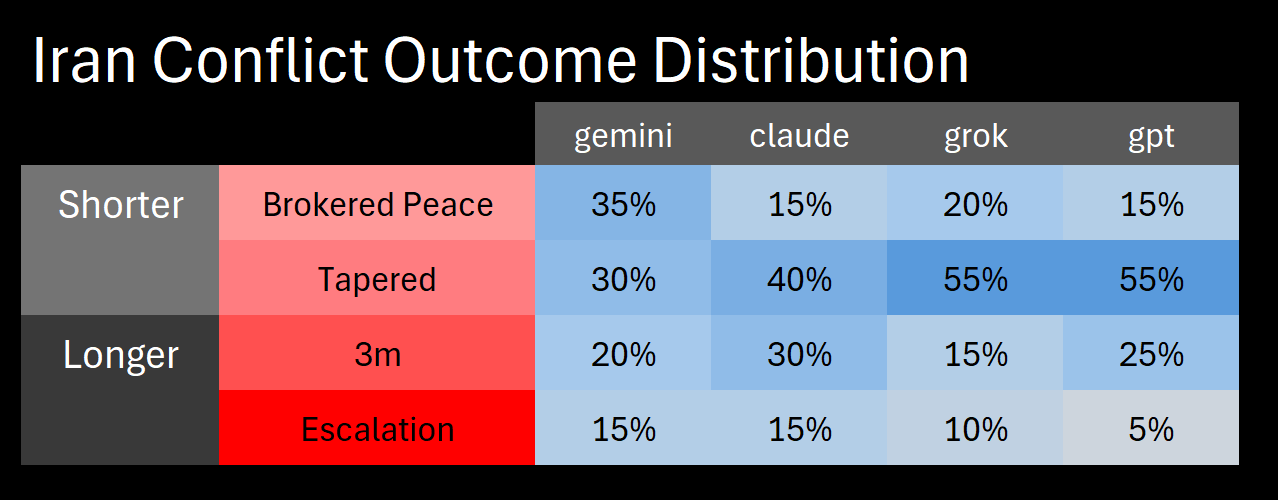
Goldman estimates a $14/bbl war premium, roughly a four-week halt with pipeline bypass.
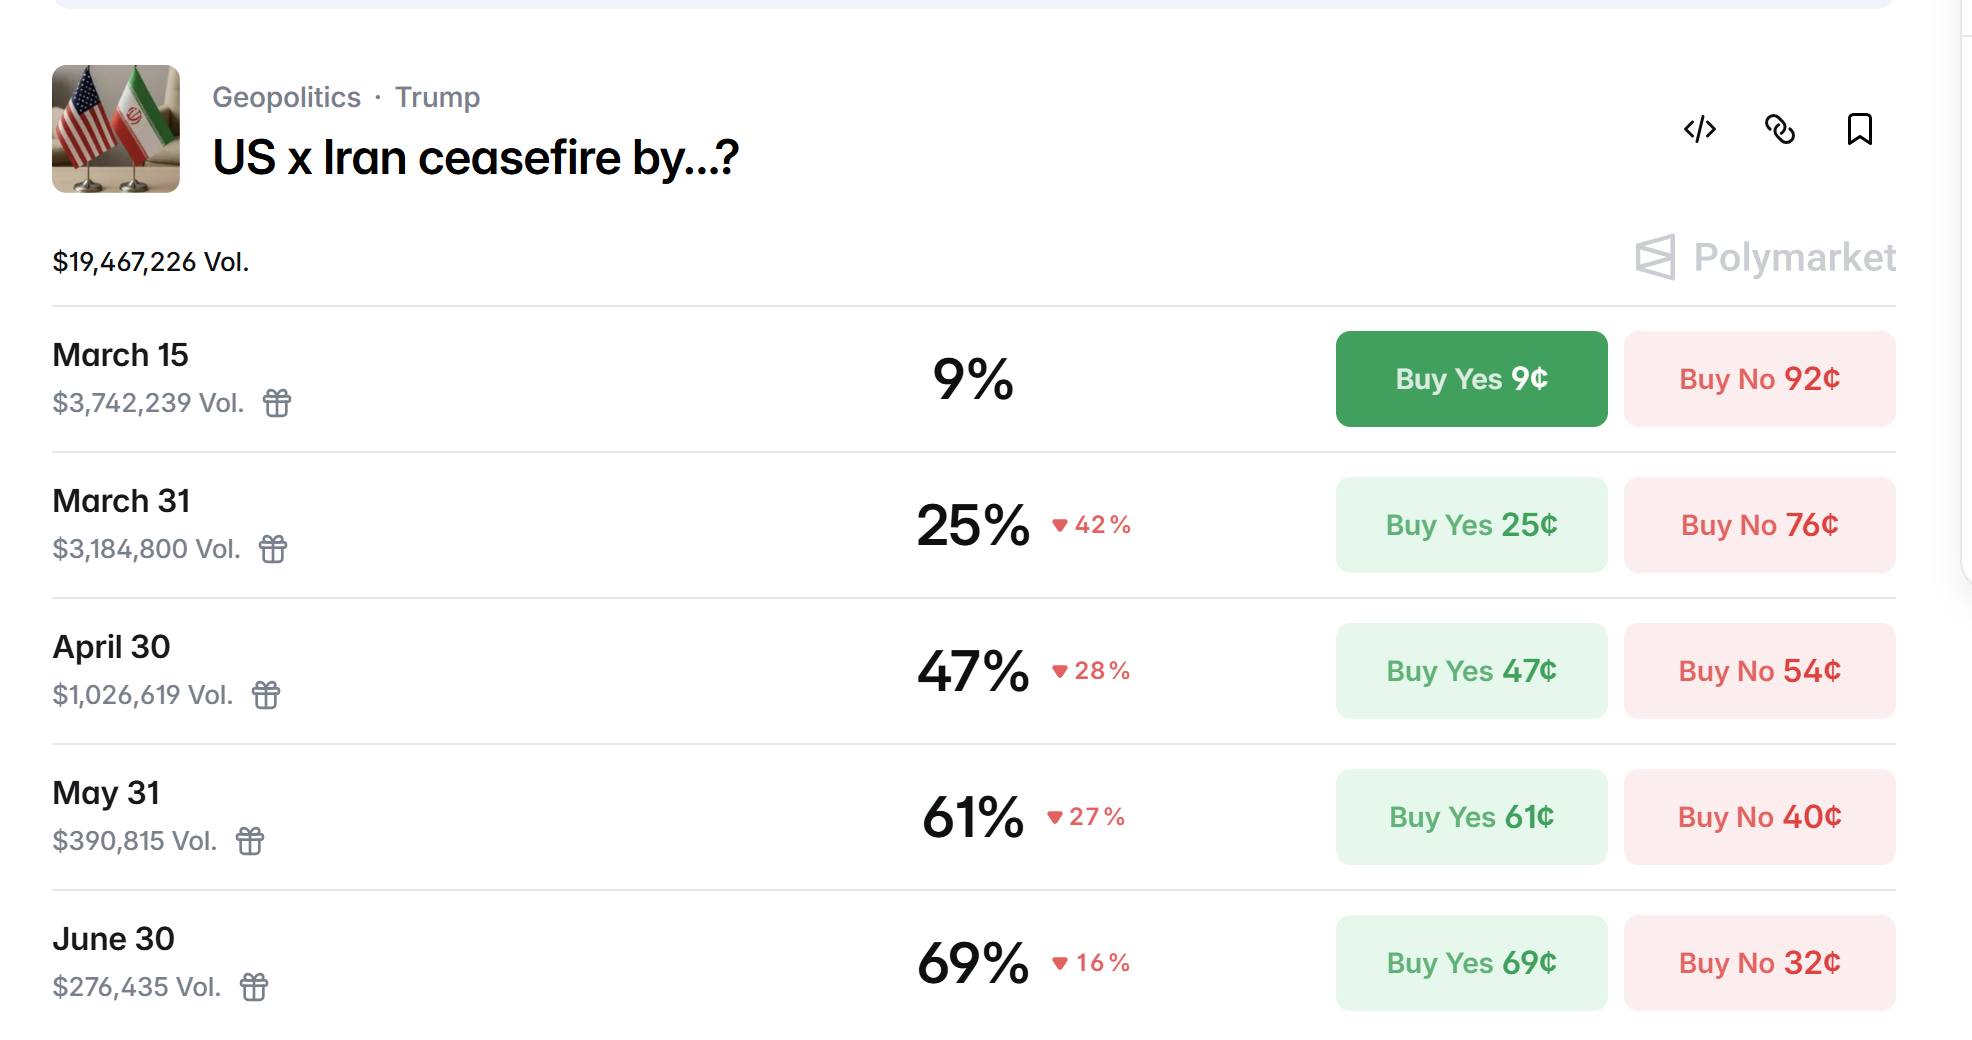
JPMorgan has Brent at $120 if the conflict extends past three weeks and storage fills. Deutsche Bank has $200 if Iran deploys mines. Polymarket has a ceasefire by April 30 at 48%.
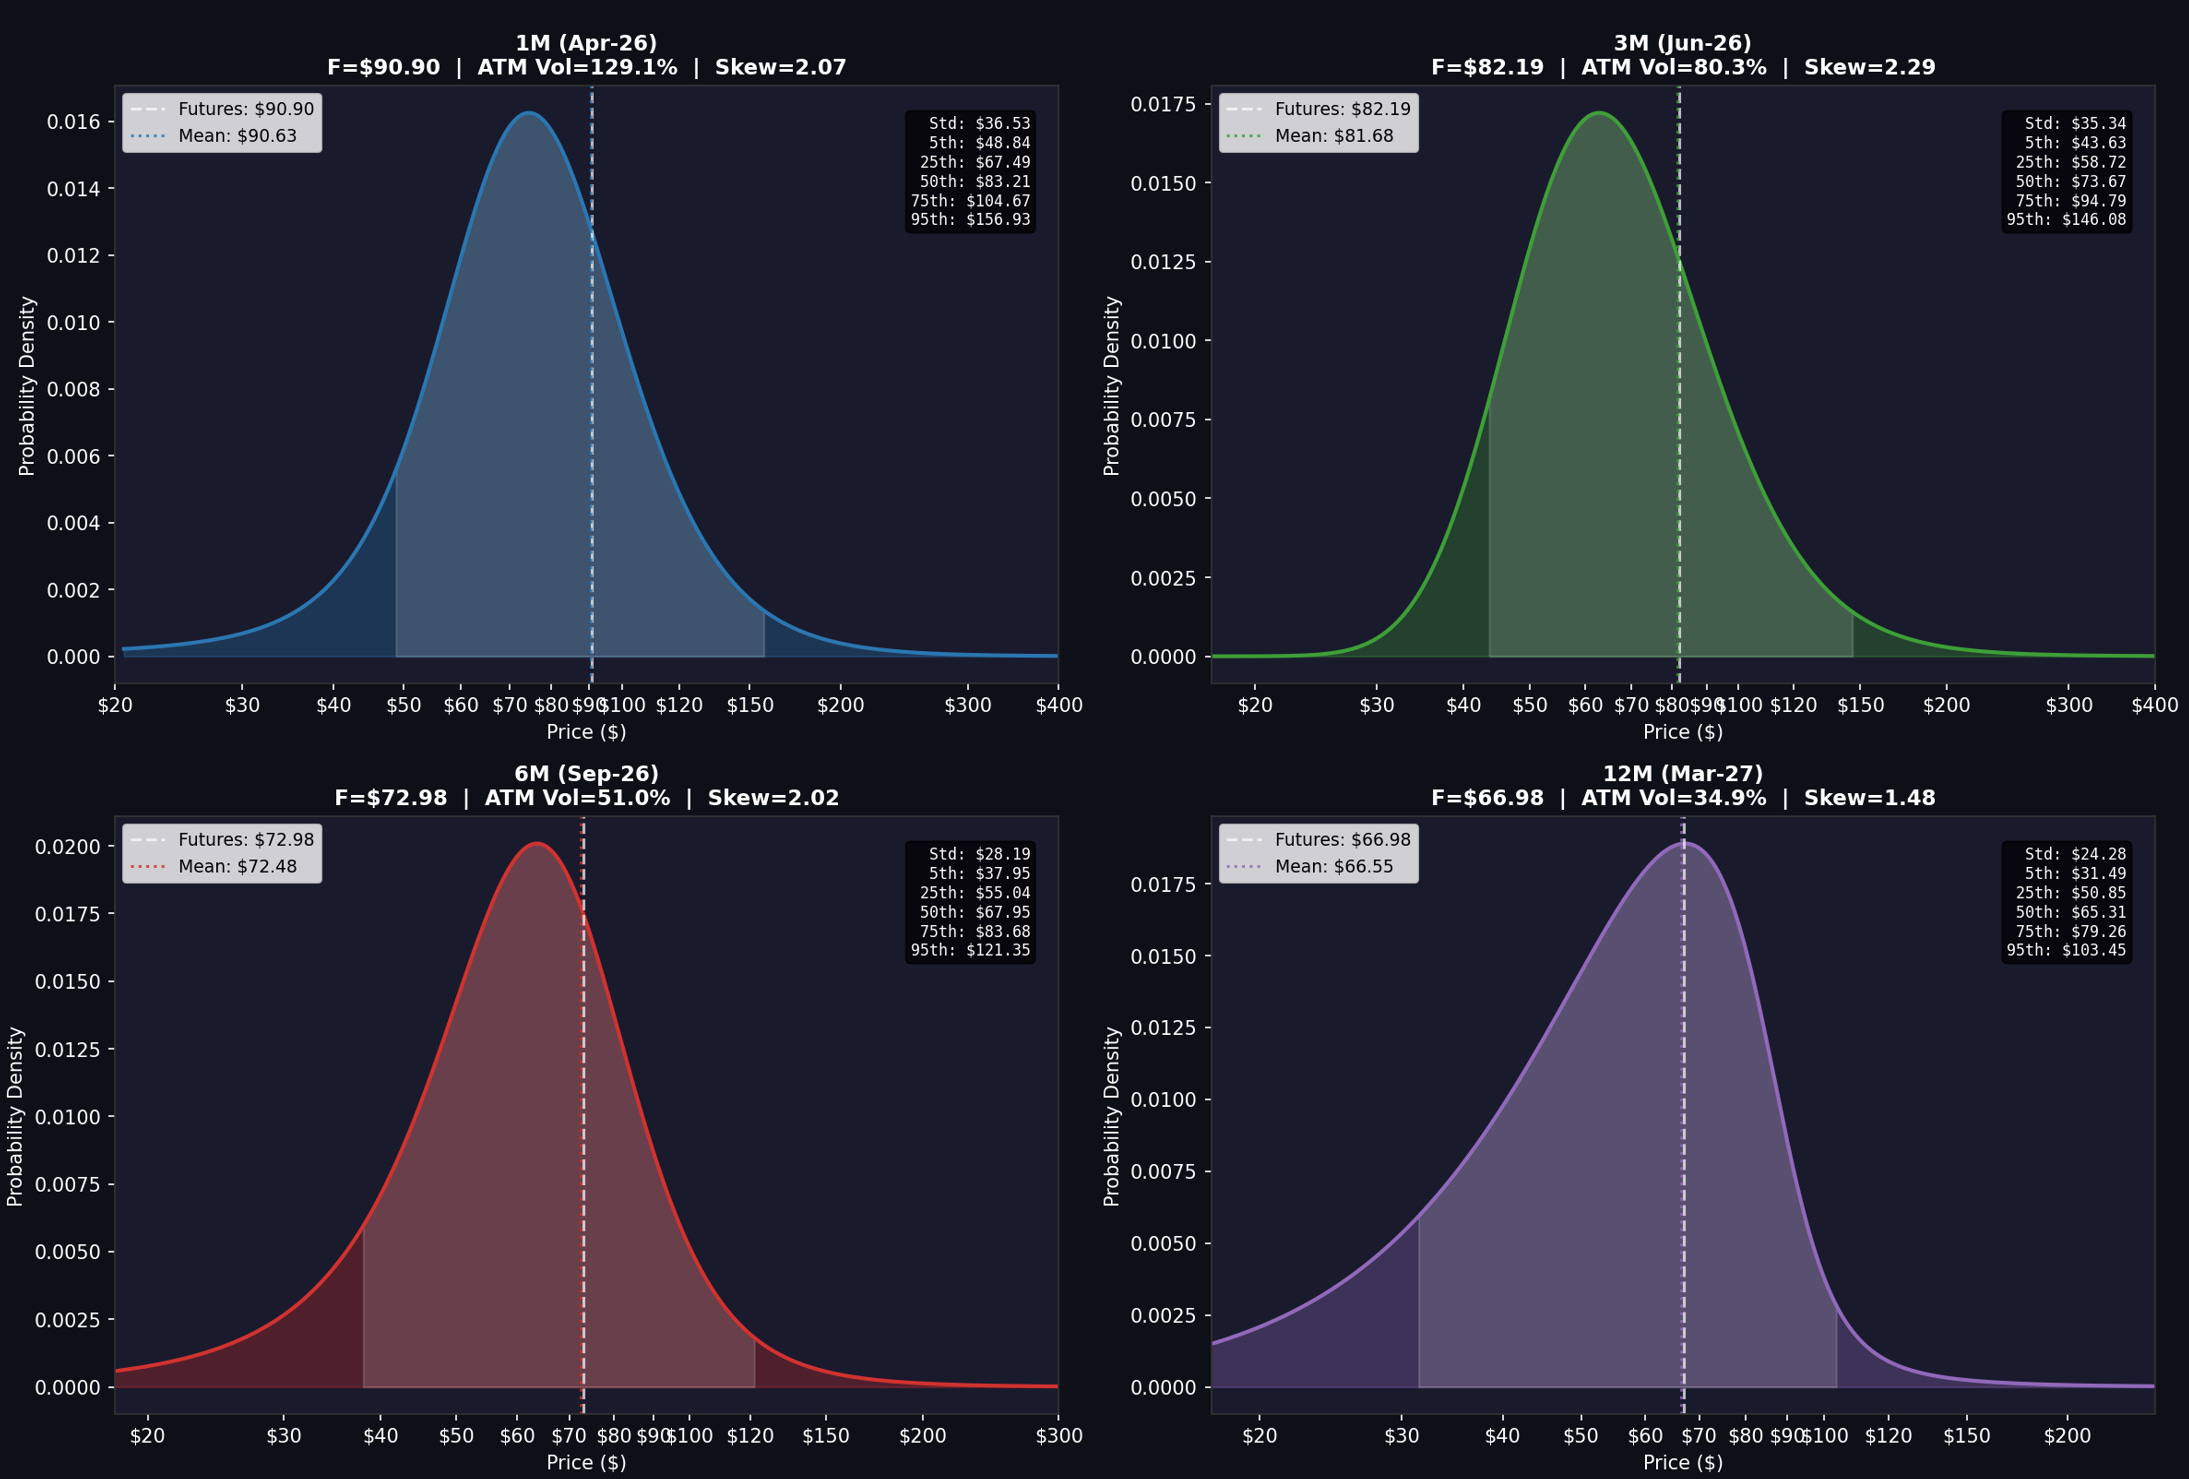
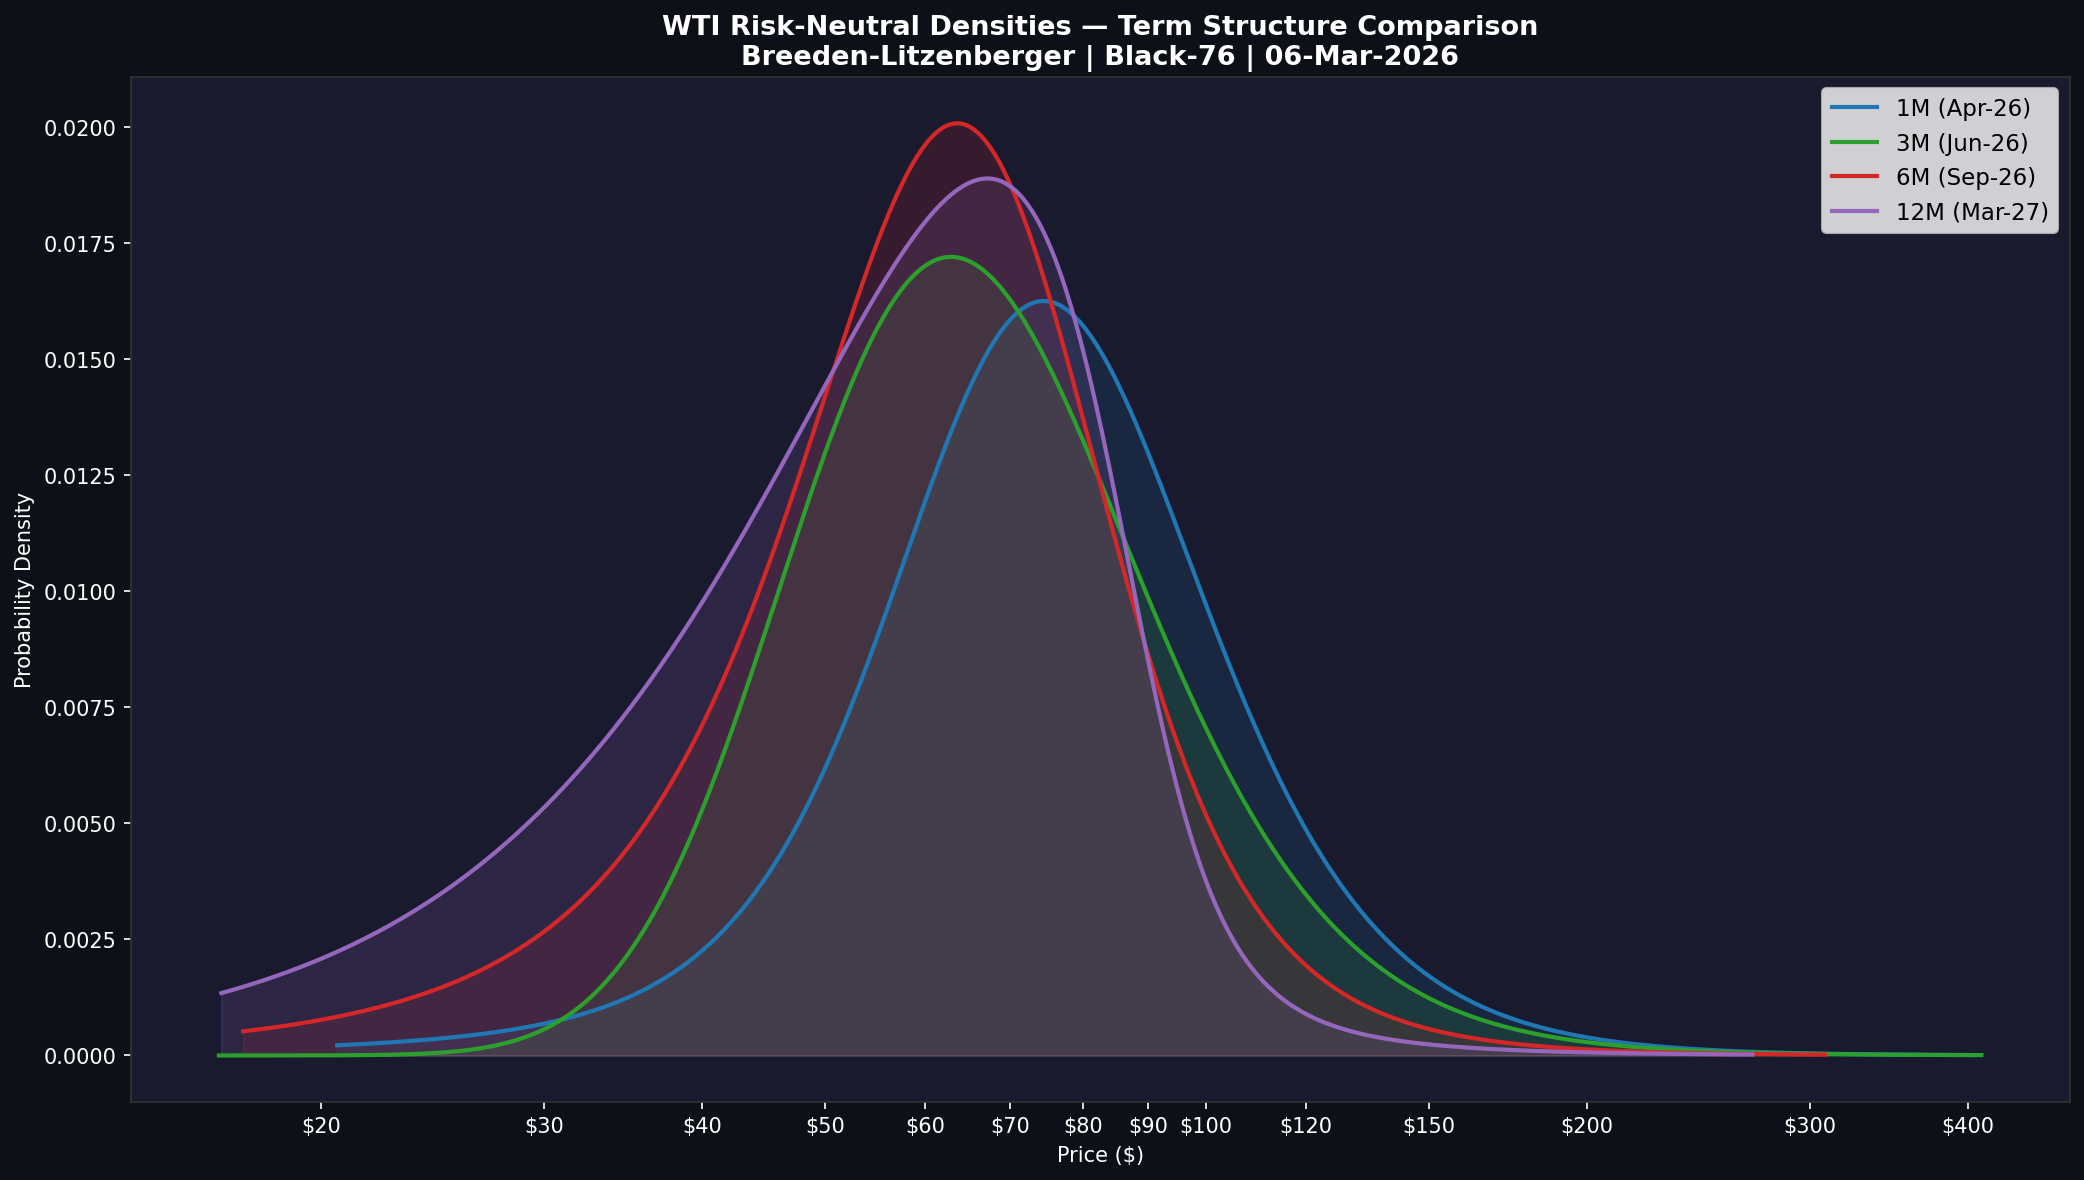
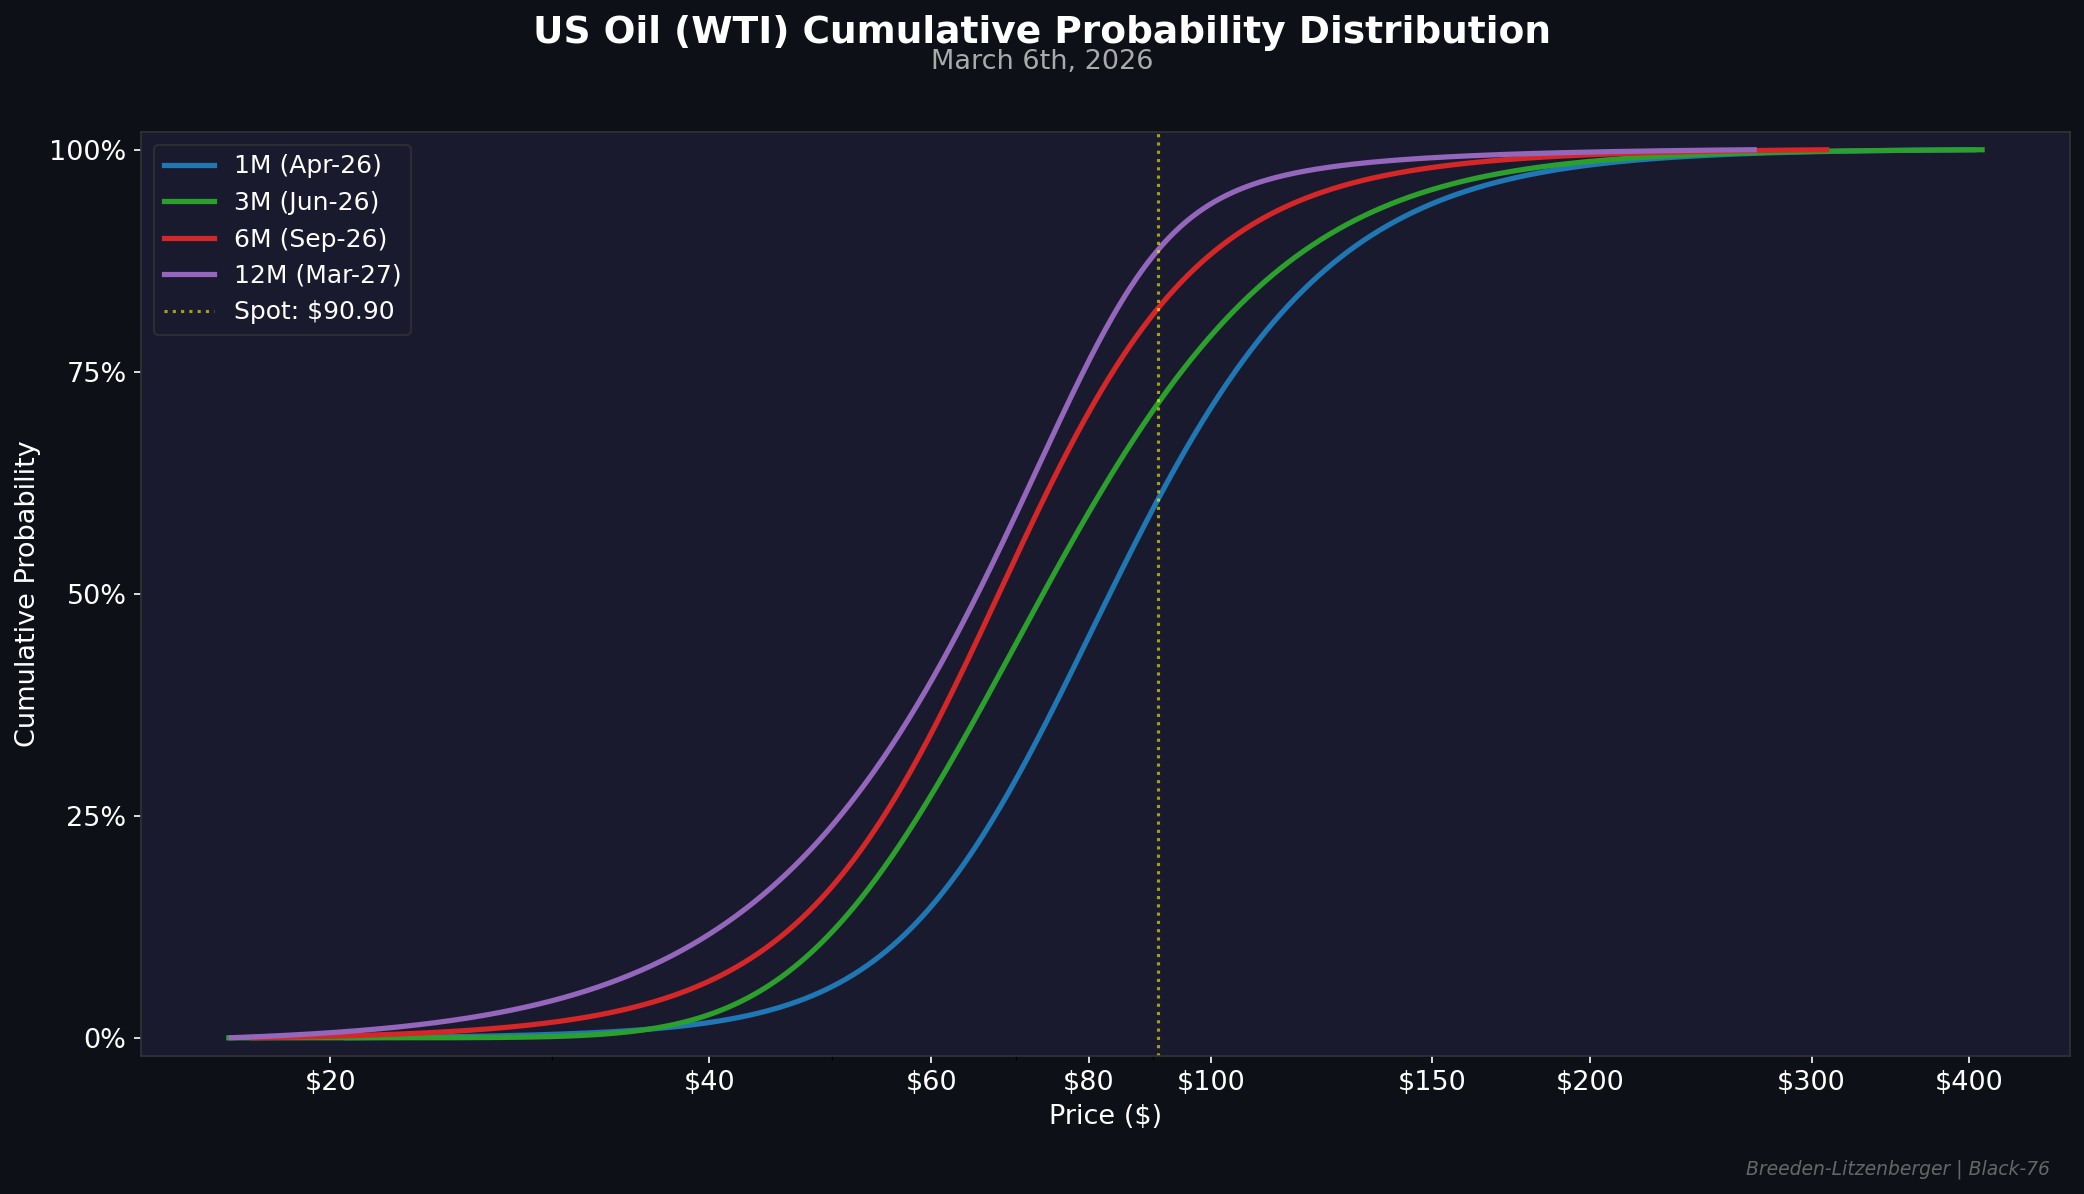
The options market tells the same story as the futures curve, but with more precision. The risk-neutral density extracted from WTI options shows the 1-month distribution (April) is flat and wide, with 129% ATM vol, a 95th percentile at $157, and roughly a coin flip that oil stays above $90. The 3-month distribution (June) is already tighter and centered around $82. By 6 months (September) and 12 months (March ‘27), the distributions have collapsed to tight peaks around $67-73 with the 95th percentiles back below $120. The further out you look, the more certain the market is that oil comes back down. The strip is pricing reversion. We think the strip is wrong.
Production that shuts in doesn't restart when a ceasefire is signed. Refineries that go cold take weeks to bring back. Infrastructure that takes missile damage takes months. Goldman's four-week framework assumed a transit disruption. What's happening is destruction.
This Is How the Cycle Ends
The economy was already rolling over before any of this.
Nonfarm payrolls fell 92,000 in February against expectations of +50,000. December was revised from +48,000 to -17,000. The last six months averaged zero net job creation. Healthcare — the single consistent driver of payroll growth for the past year — went negative on a Kaiser strike. Federal employment fell 10,000 for the month, down 330,000 from its October 2024 peak. Manufacturing shed 12,000. Information services kept declining.
This was the February report. It does not reflect the Iran conflict at all. March will.
So the starting position was a consumer under pressure, a labor market producing nothing, and an economy that had already posted five months of negative payrolls in 2025 for the first time since 2010. That was the setup before oil went to $91.
Now run the transmission.
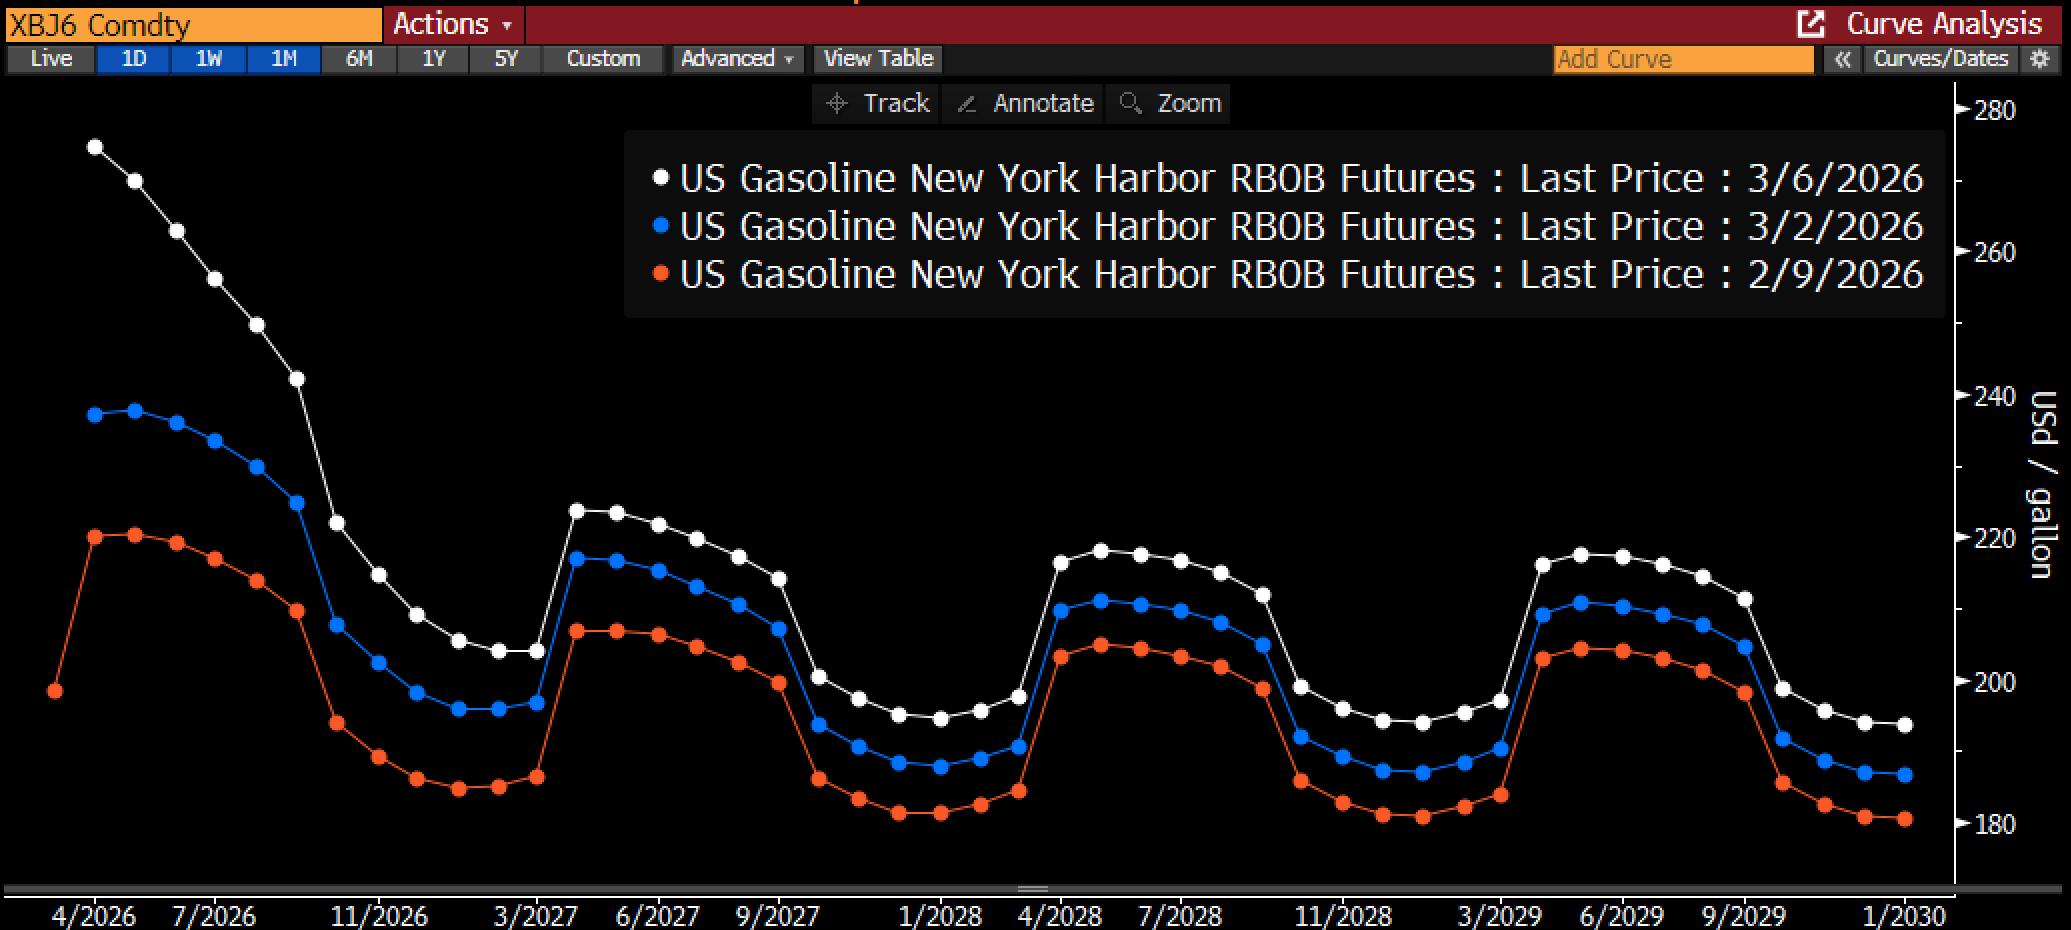
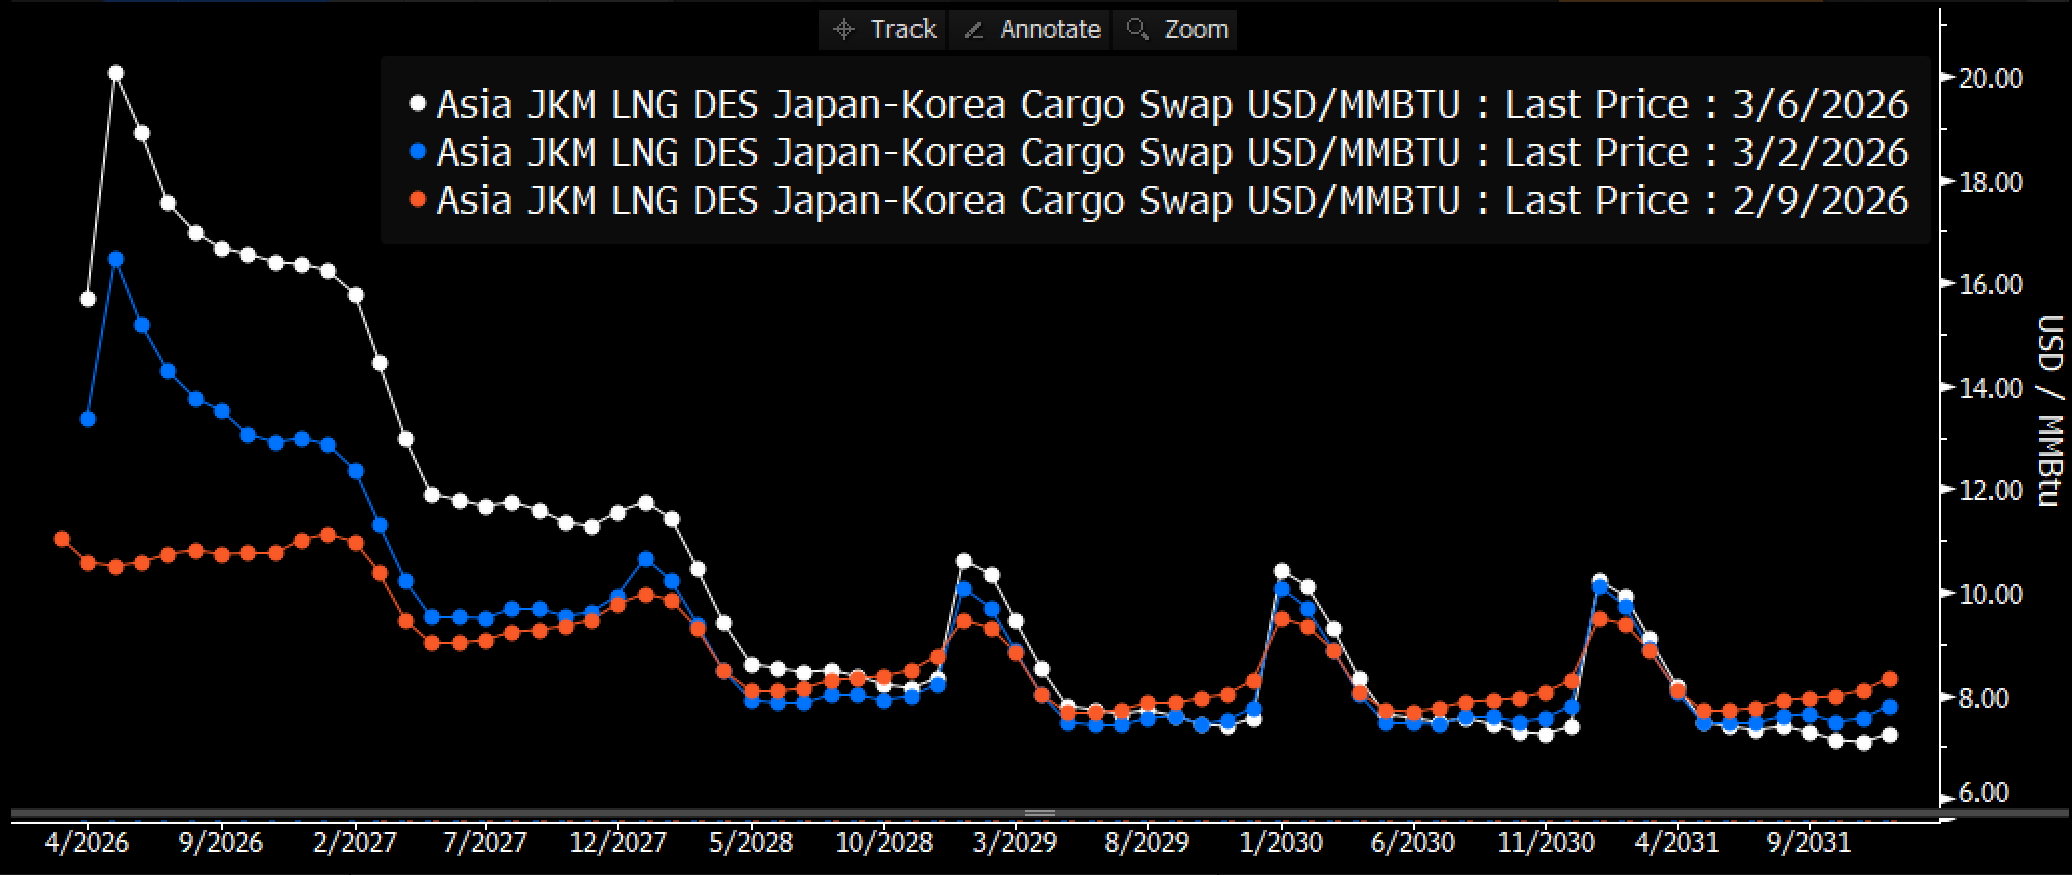
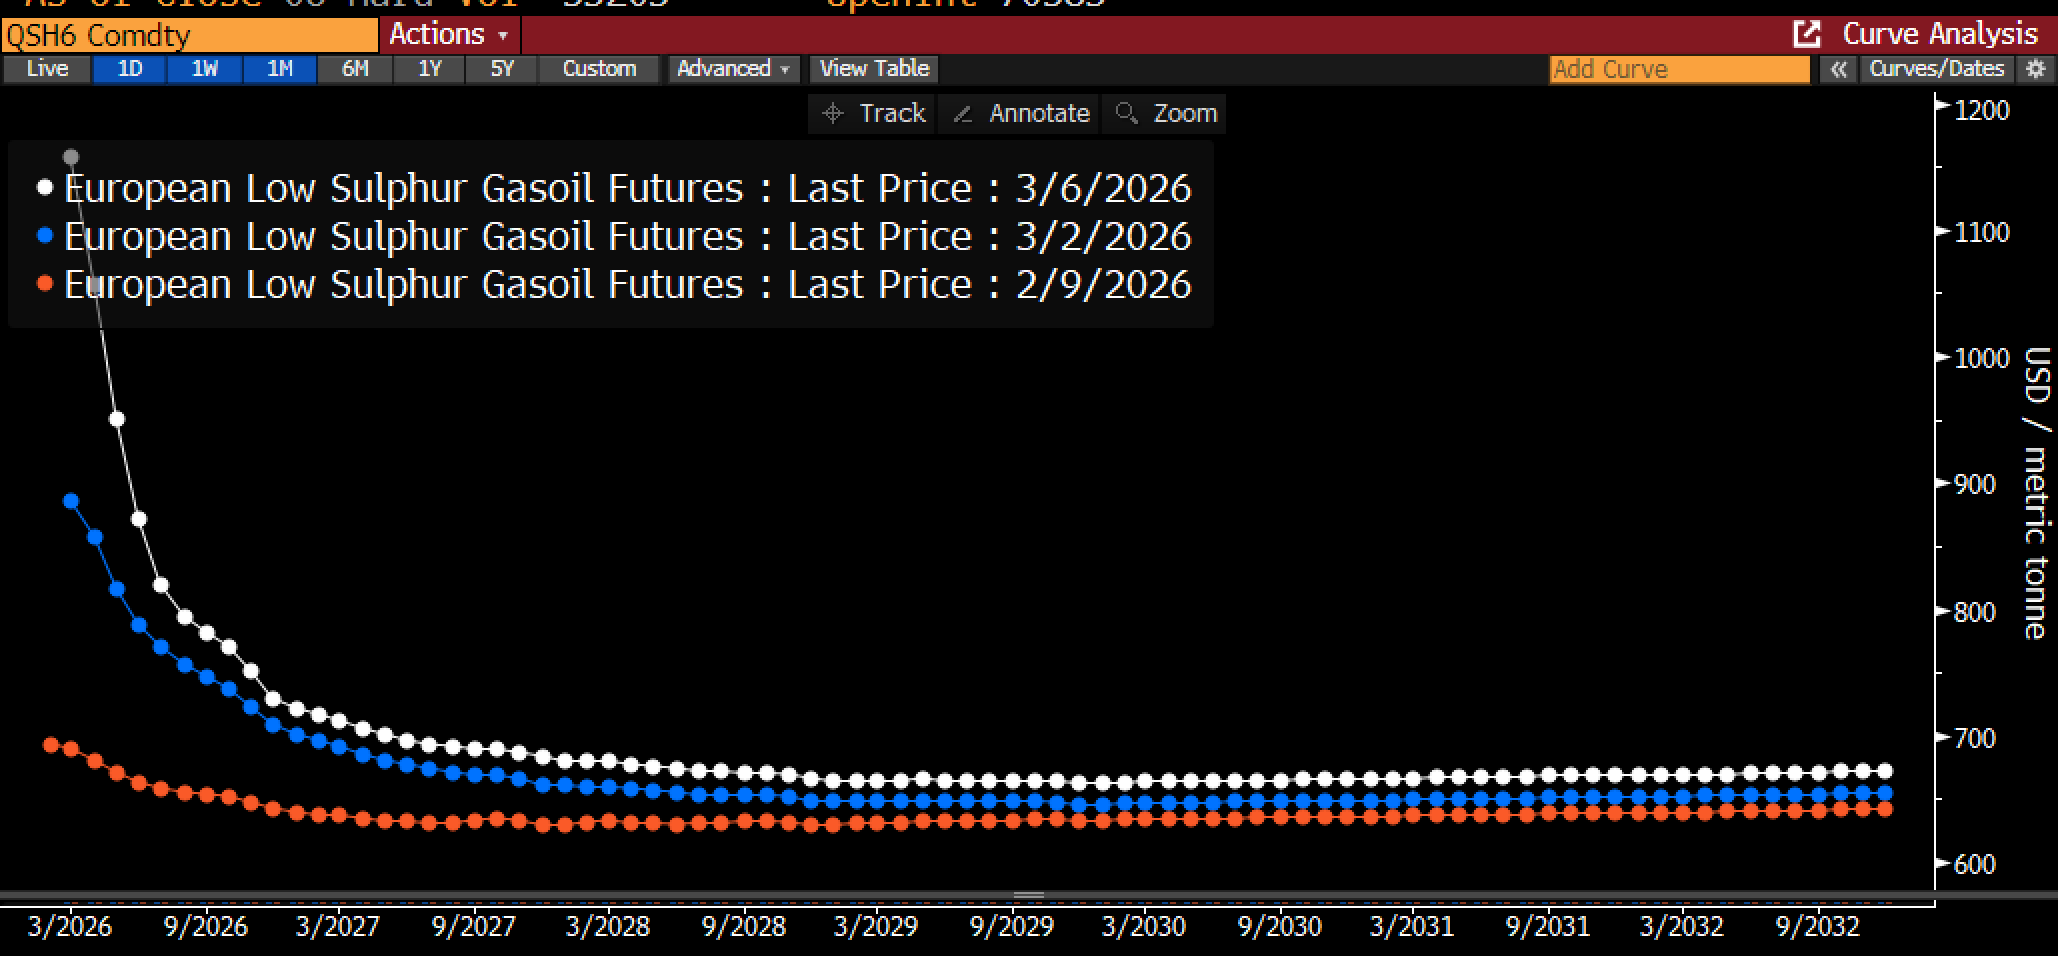
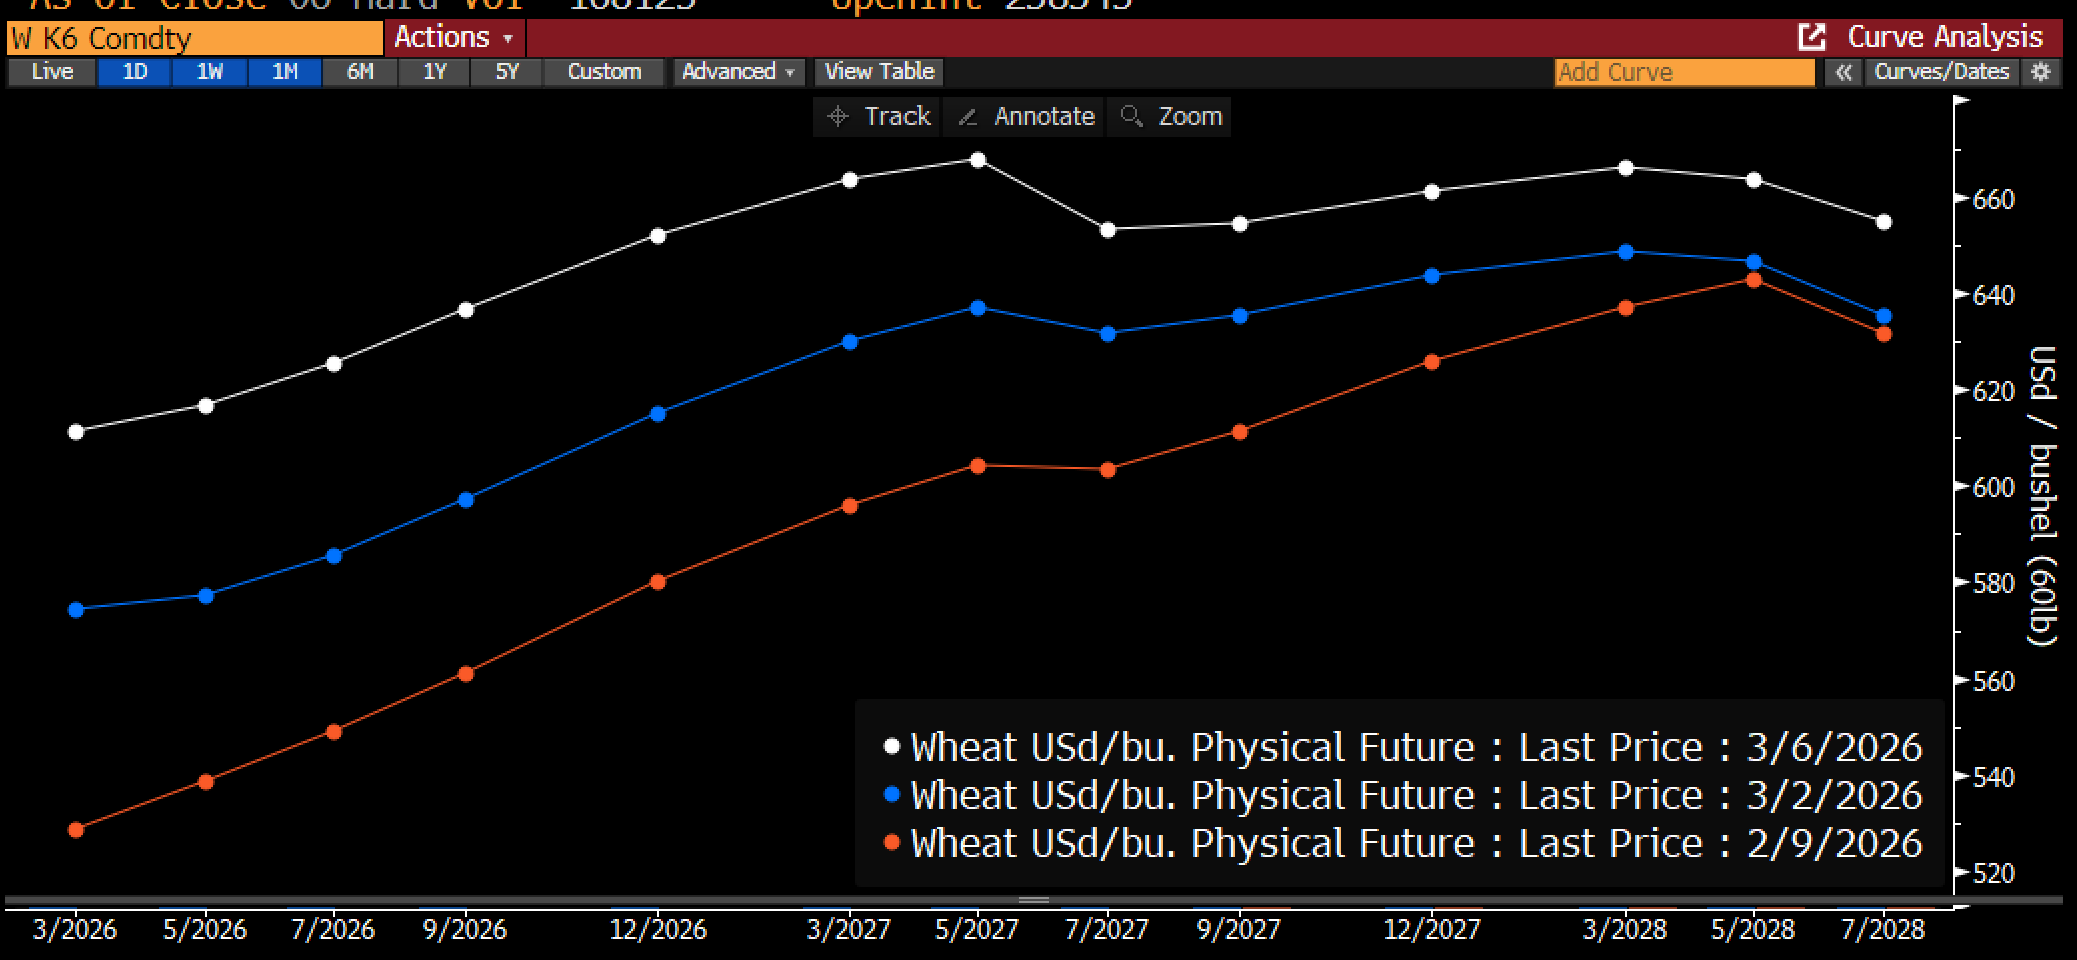
Inflation is about energy. Energy is about oil. Oil moves through transportation costs, manufacturing inputs, agricultural production, and petrochemical feedstocks. When oil moves 56% in ten weeks, nothing in the cost structure of the real economy is immune. And it isn't just crude. RBOB gasoline futures spiked across the full forward curve. European gasoil moved violently. Asia JKM LNG surged to multi-year highs after Qatar halted production. Singapore jet kerosene hit levels last seen during the 2022 Russia shock. Wheat is up. Copper is up. Aluminum is up. Every commodity that uses energy as an input or transits the Persian Gulf is repricing simultaneously.
None of this has printed in the inflation data. The lag is 6-12 weeks. The oil move started in late February. The first CPI print that captures it will be April, reported in May. But gasoline prices are already up 30 cents a gallon since Sunday and rising. American drivers feel it before the BLS counts it. For a consumer already spending a larger share of income on non-discretionary items, every dollar at the pump is a dollar not spent at a restaurant or a retailer.
On the corporate side, input costs won’t show up until Q2 earnings. Margins compress across manufacturing, logistics, agriculture, chemicals, and retail. Companies absorb the first wave through inventories. The second wave hits the P&L. Earnings estimates for the back half of 2026 have not been revised to reflect $91 oil, let alone $100 or $120.
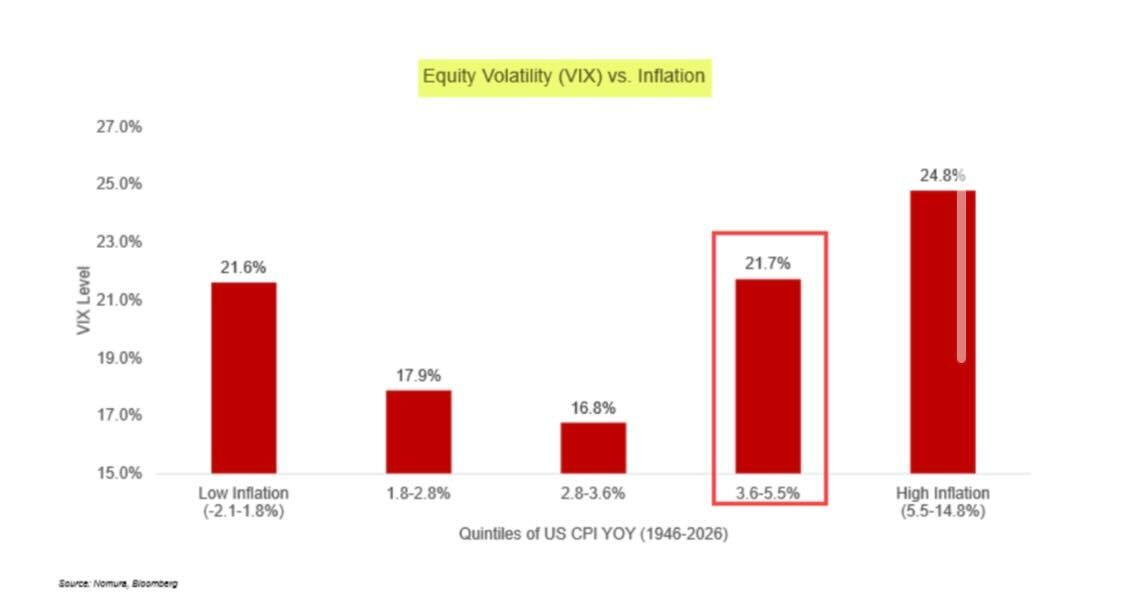
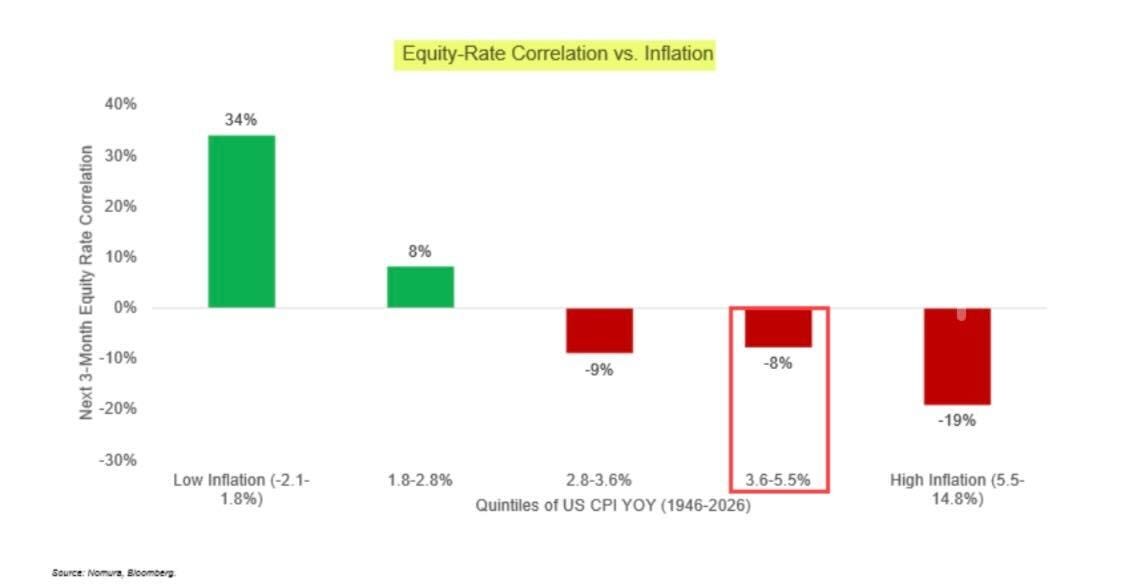
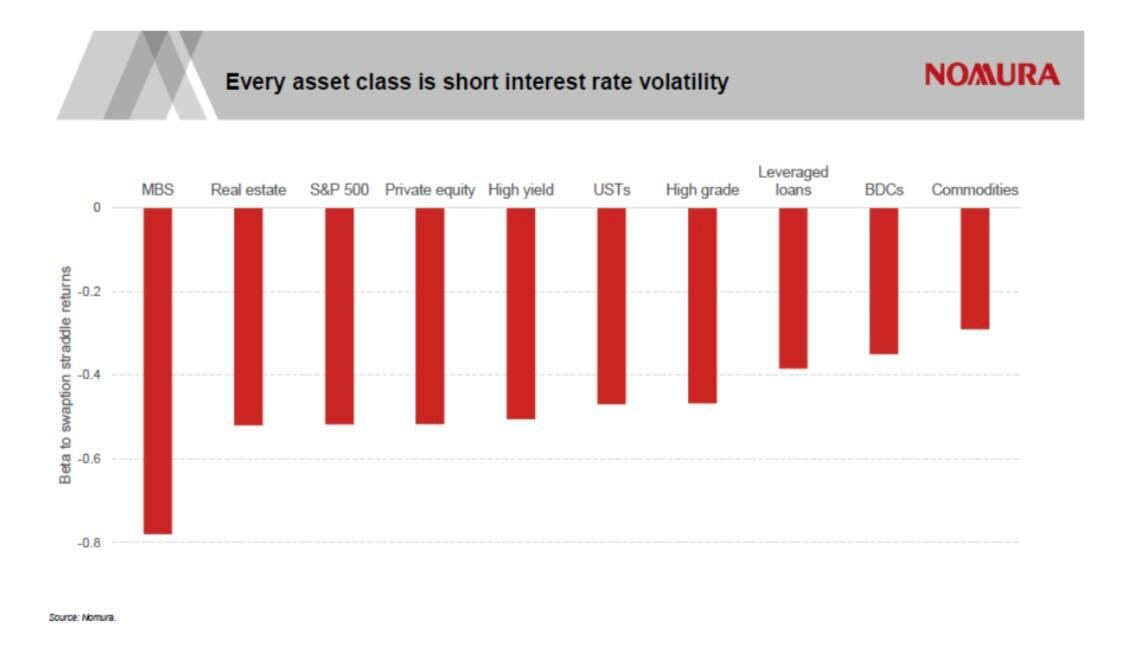
Here is the part the equity market hasn’t internalized: stocks do badly in high inflation. Nomura’s data going back to 1946 shows that when CPI runs above 5.5%, the average 3-month equity return is -19%. When inflation is low (below 1.8%), average returns are +34%. The relationship between equity-rate correlation and inflation flips sign: in low inflation, stocks and bonds move in opposite directions, giving portfolios a natural hedge. In high inflation, they move together, and both go down. The 60/40 portfolio stops working. Every asset class becomes short interest rate volatility at the same time.
This is the sequence: energy shock hits consumer spending first through gasoline, hits corporate margins second through input costs, and shows up in the inflation data third. By the time the Fed sees it in the prints, the damage to the real economy is already two months old. And when it shows up, the equity-bond correlation flips, the vol surface reprices, and the diversification that every institutional portfolio relies on stops functioning.
The Fed Is Trapped
Bonds are not rallying. That is the tell.
Bonds are not rallying.
In a normal growth scare, Treasuries go bid. The 10-year falls. The Fed has room to cut. That channel is closed. The 10-year moved above 4.1% Thursday, the 30-year above 4.75%, and the average 30-year mortgage hit 6.13% — rising into a weakening labor market.
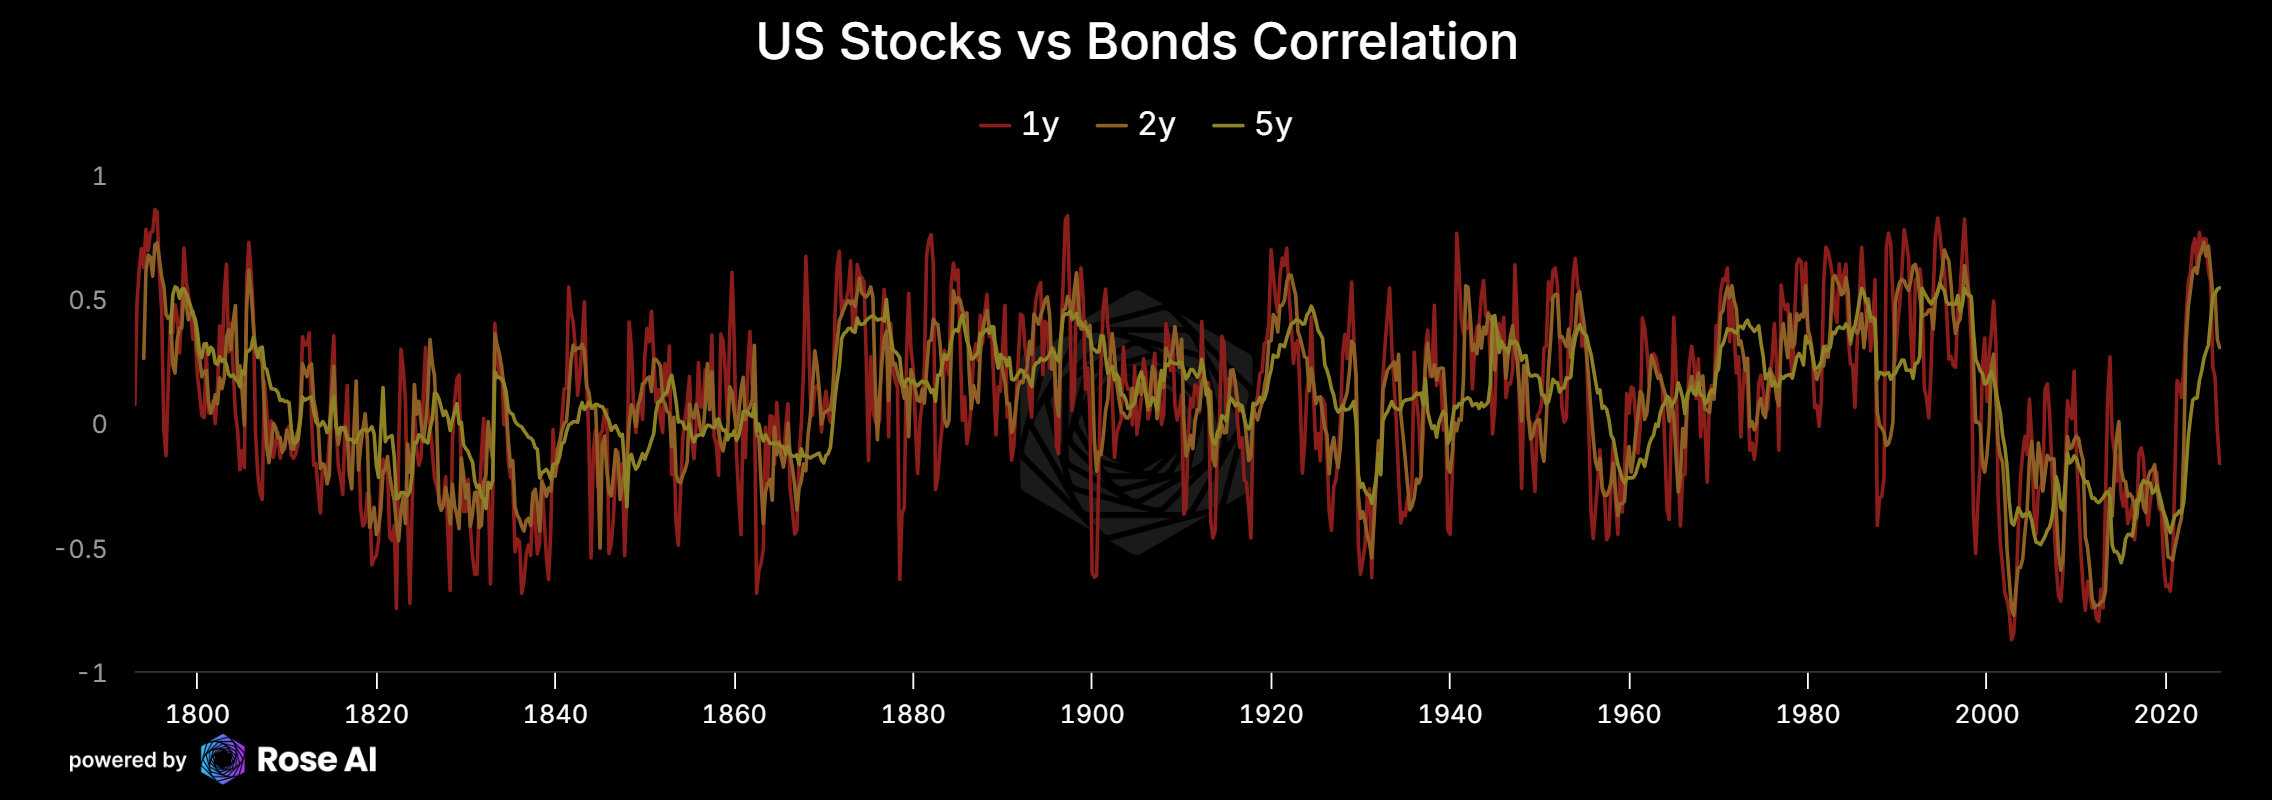
The stock-bond correlation has been drifting positive for two years. In an inflation regime, stocks and bonds sell off together because both are responding to the same force: higher rates and rising prices. The traditional safety trade of rotating from equities into Treasuries doesn’t work when the reason equities are selling is the same reason bonds are selling.
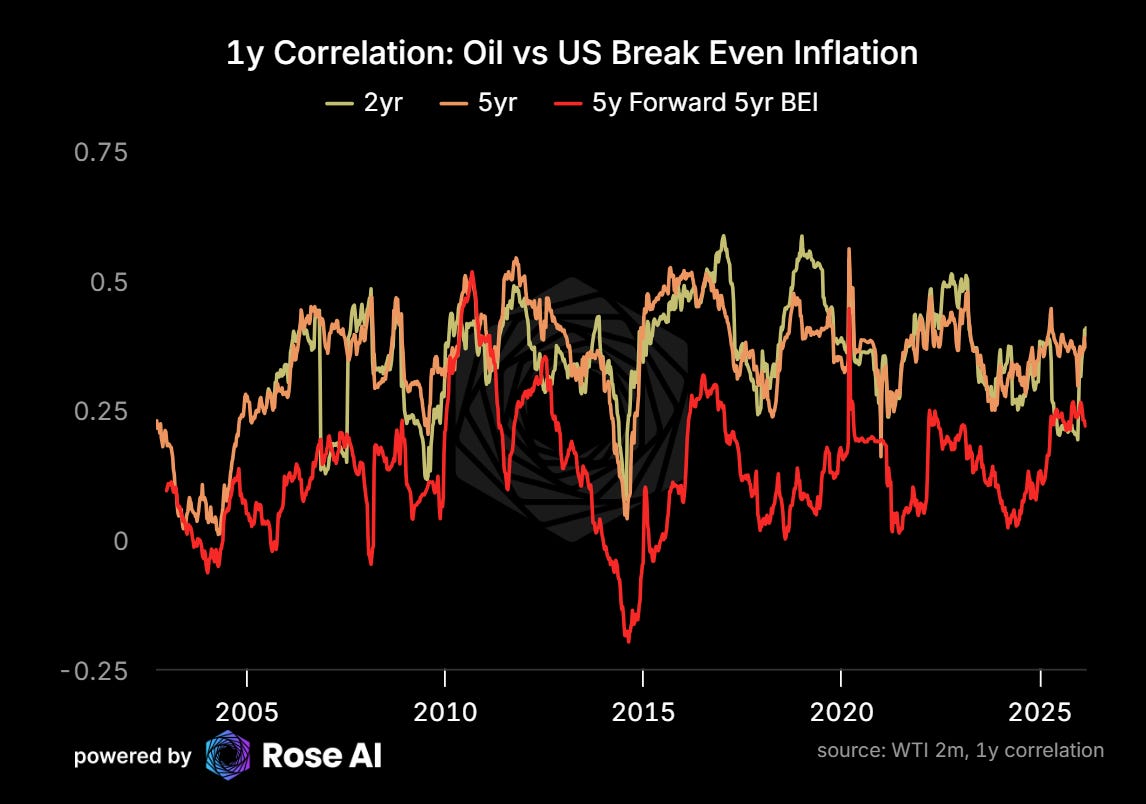
Oil is a reliable lead on breakeven inflation, and the bond market knows it. The 1-year correlation between oil and breakeven inflation across the 2yr, 5yr, and 5y-forward tenors has been persistently positive for two decades and is strengthening now.
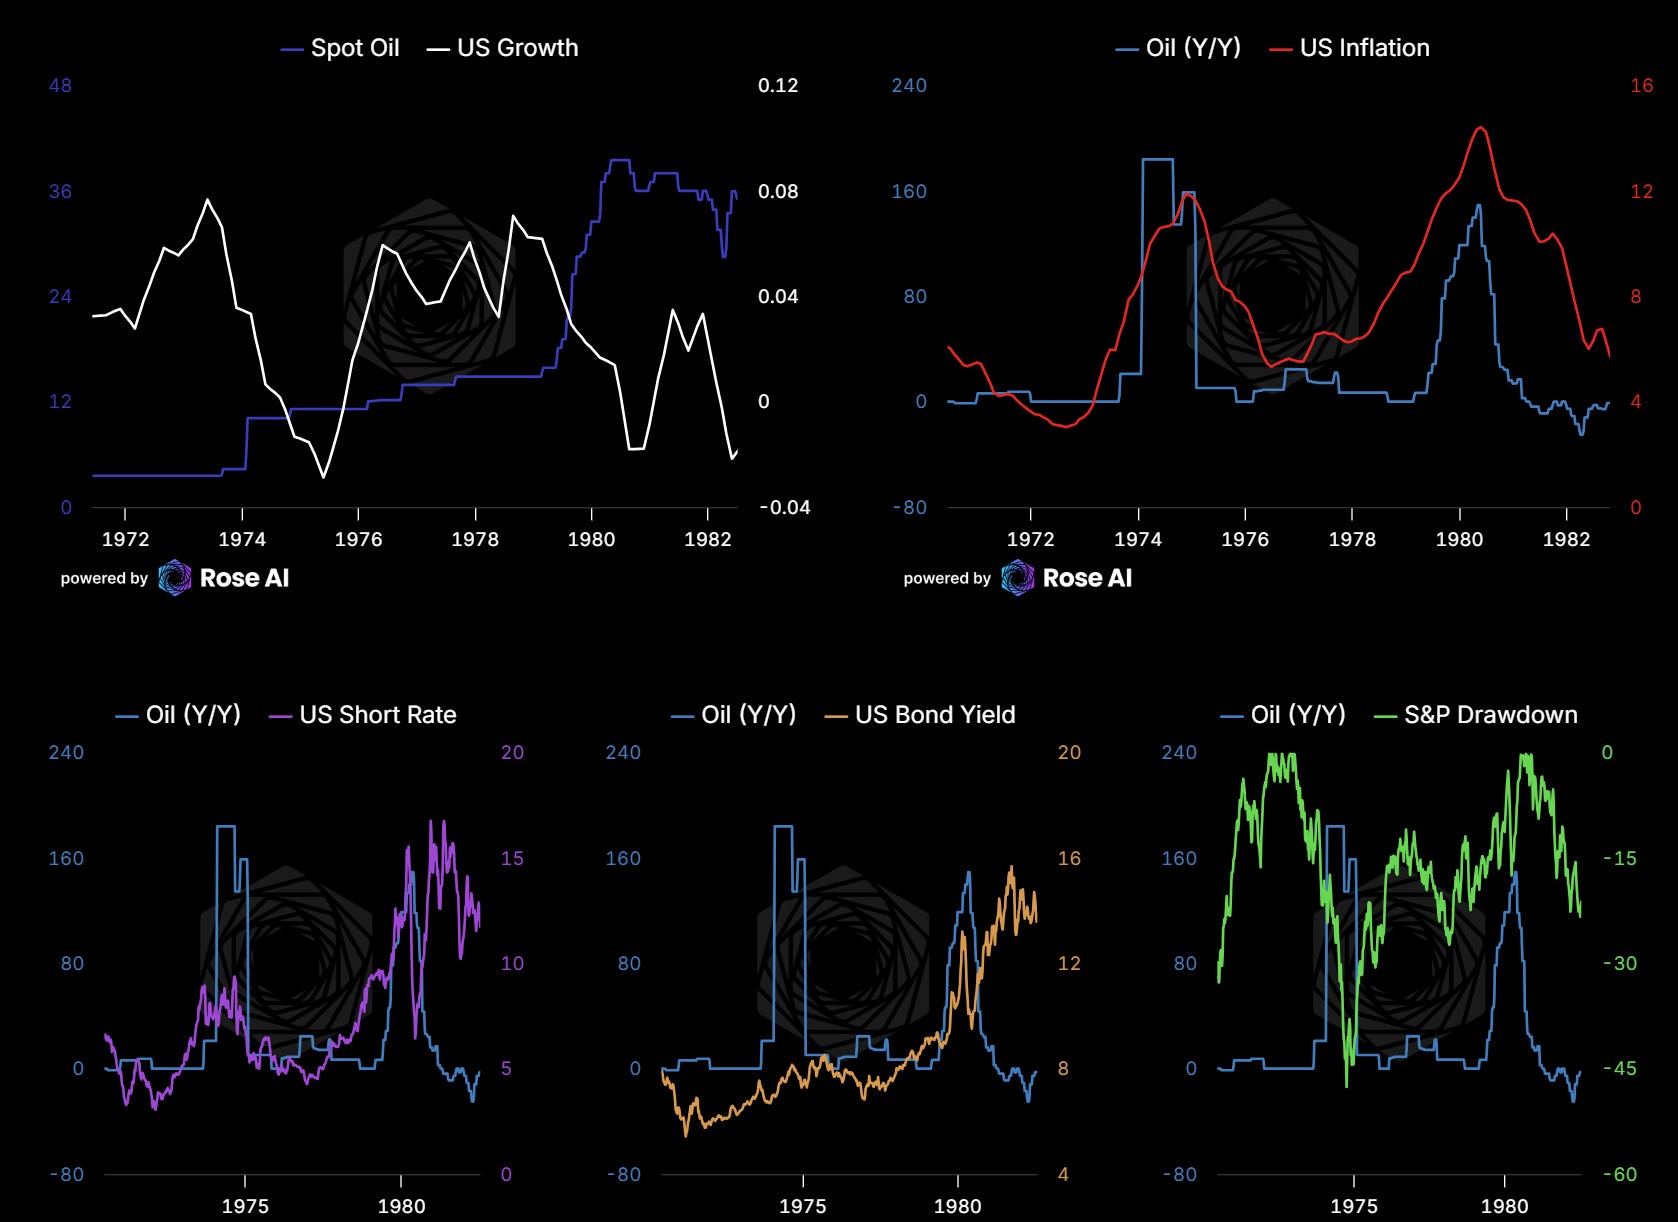
The 1970s parallel is inexact but the structure is familiar. External supply shock. Inflation expectations start to slip. The central bank caught between a weakening economy and rising prices. The policy mistake is easing too fast, validating the inflation, and having to destroy the economy to fix it later. The Fed already has one 2021 on its record. It will not risk another.
Mary Daly at the San Francisco Fed said it the other morning: “We have inflation printing above target and oil prices rising. Both of our goals are risks now.”
The market is pricing the first cut in July. That calendar assumes the conflict resolves quickly, energy prices retreat, and the March and April data don’t confirm the deterioration that February started. If the strip reprices, if CPI prints hot in May, if the next two jobs reports confirm what February showed — the July cut is gone and the Fed is sitting on its hands while the labor market deteriorates and mortgage rates tick up. That’s stagflation. Not the theoretical kind. The kind where people lose their jobs and groceries cost more in the same month.
Watch Credit
Recessions don’t start because of vibes. They start because of credit cycles.
The Fed being trapped is a necessary condition for the cycle to break, but it isn’t sufficient. What actually kills an expansion is the moment corporate funding costs reprice and companies that were relying on cheap refinancing discover the window is closing.
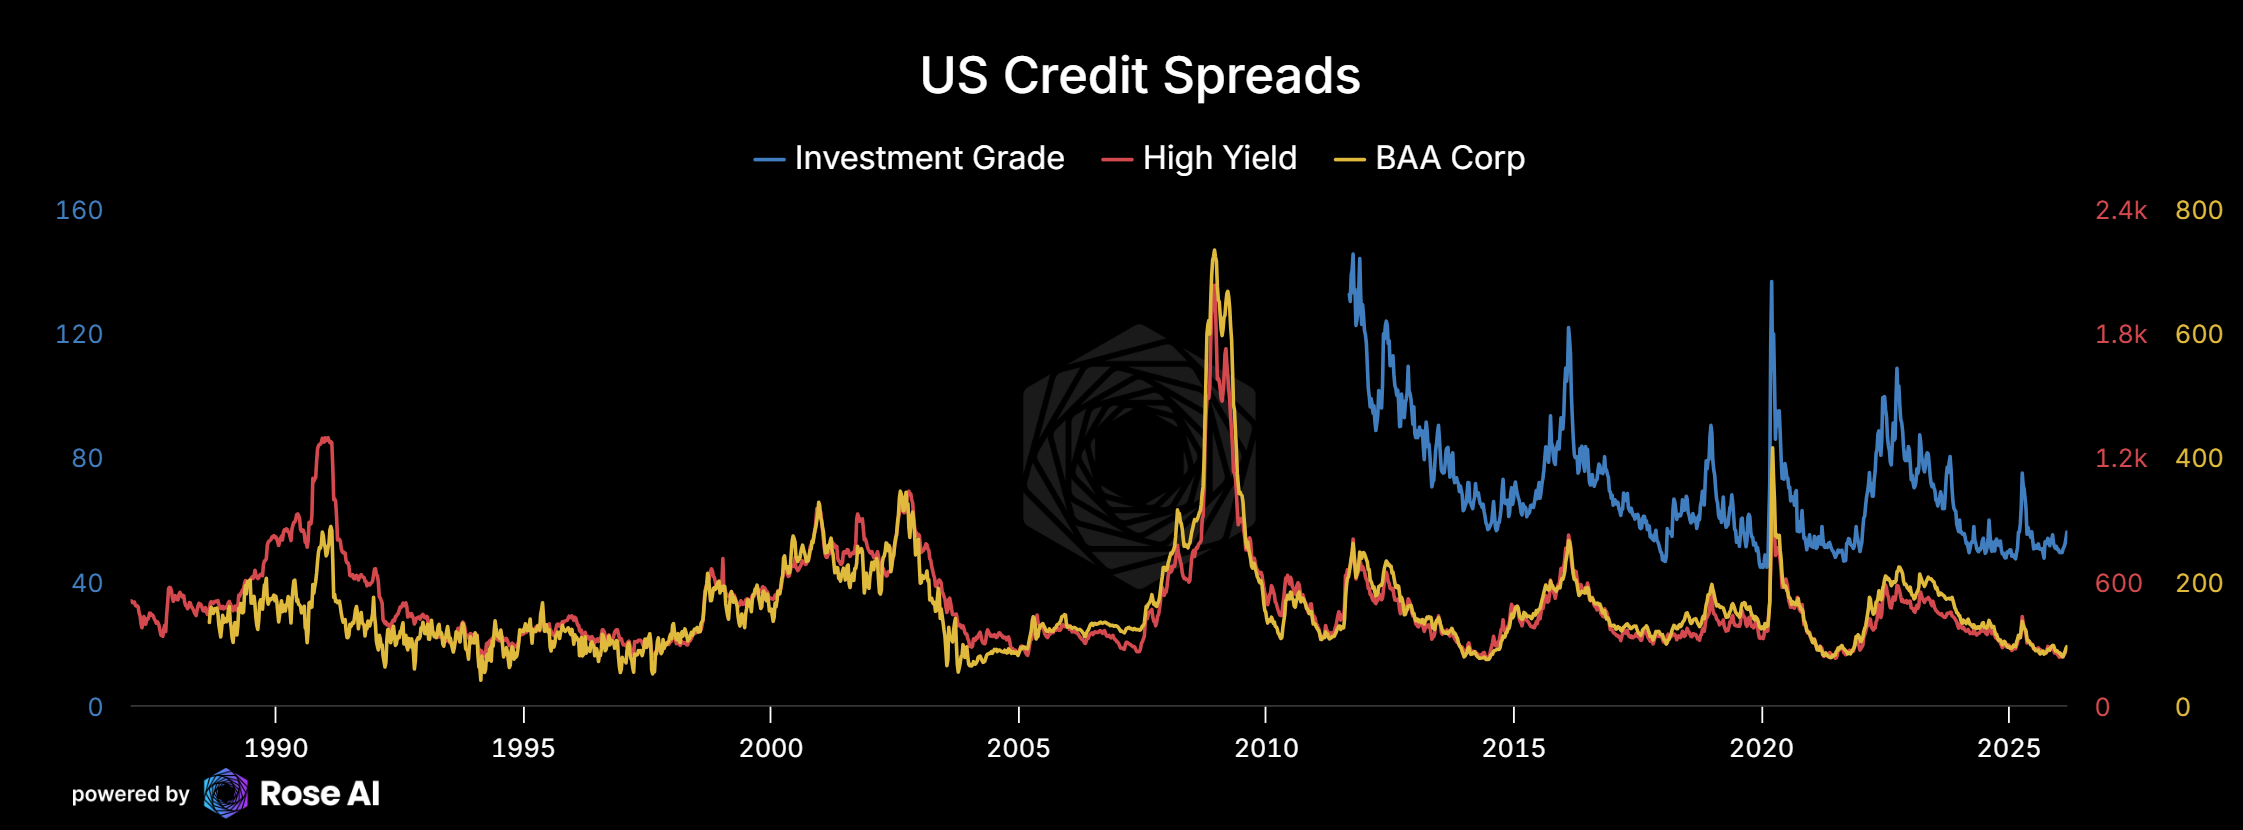
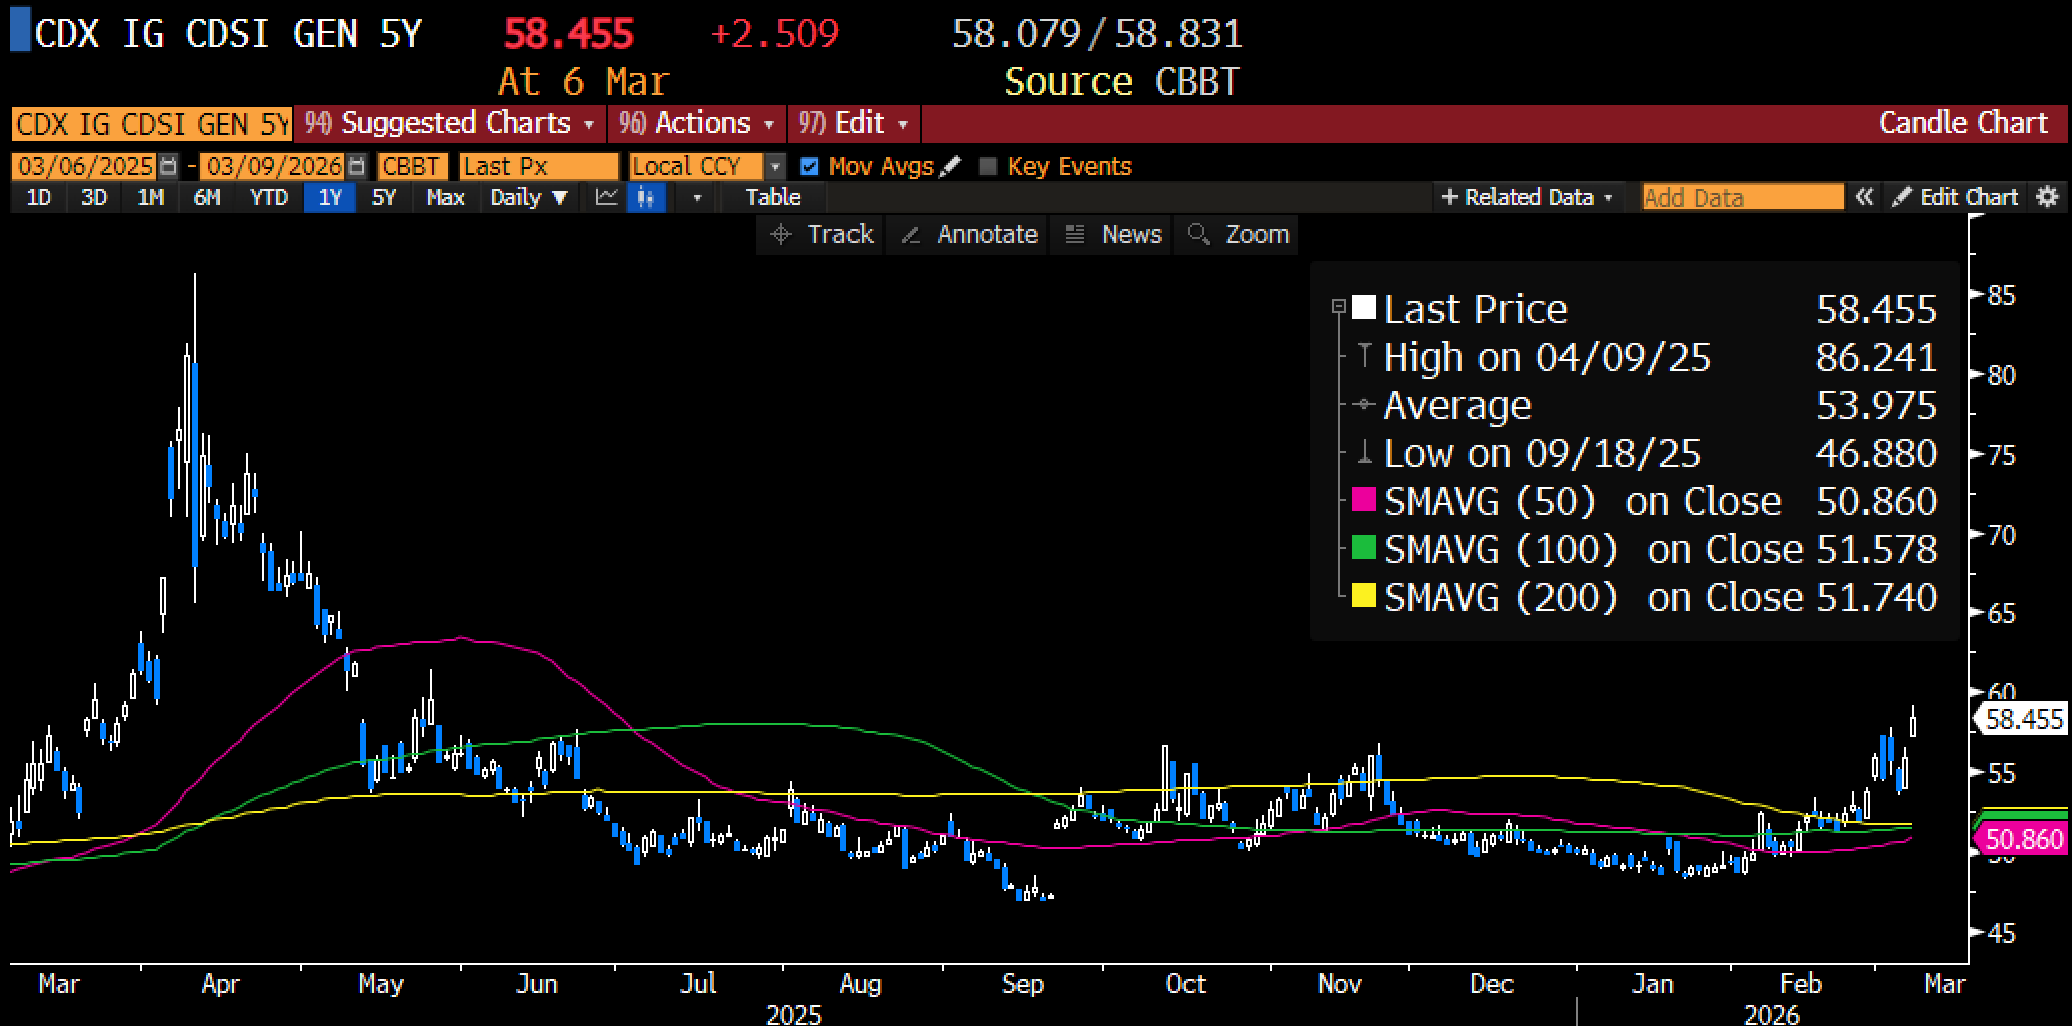
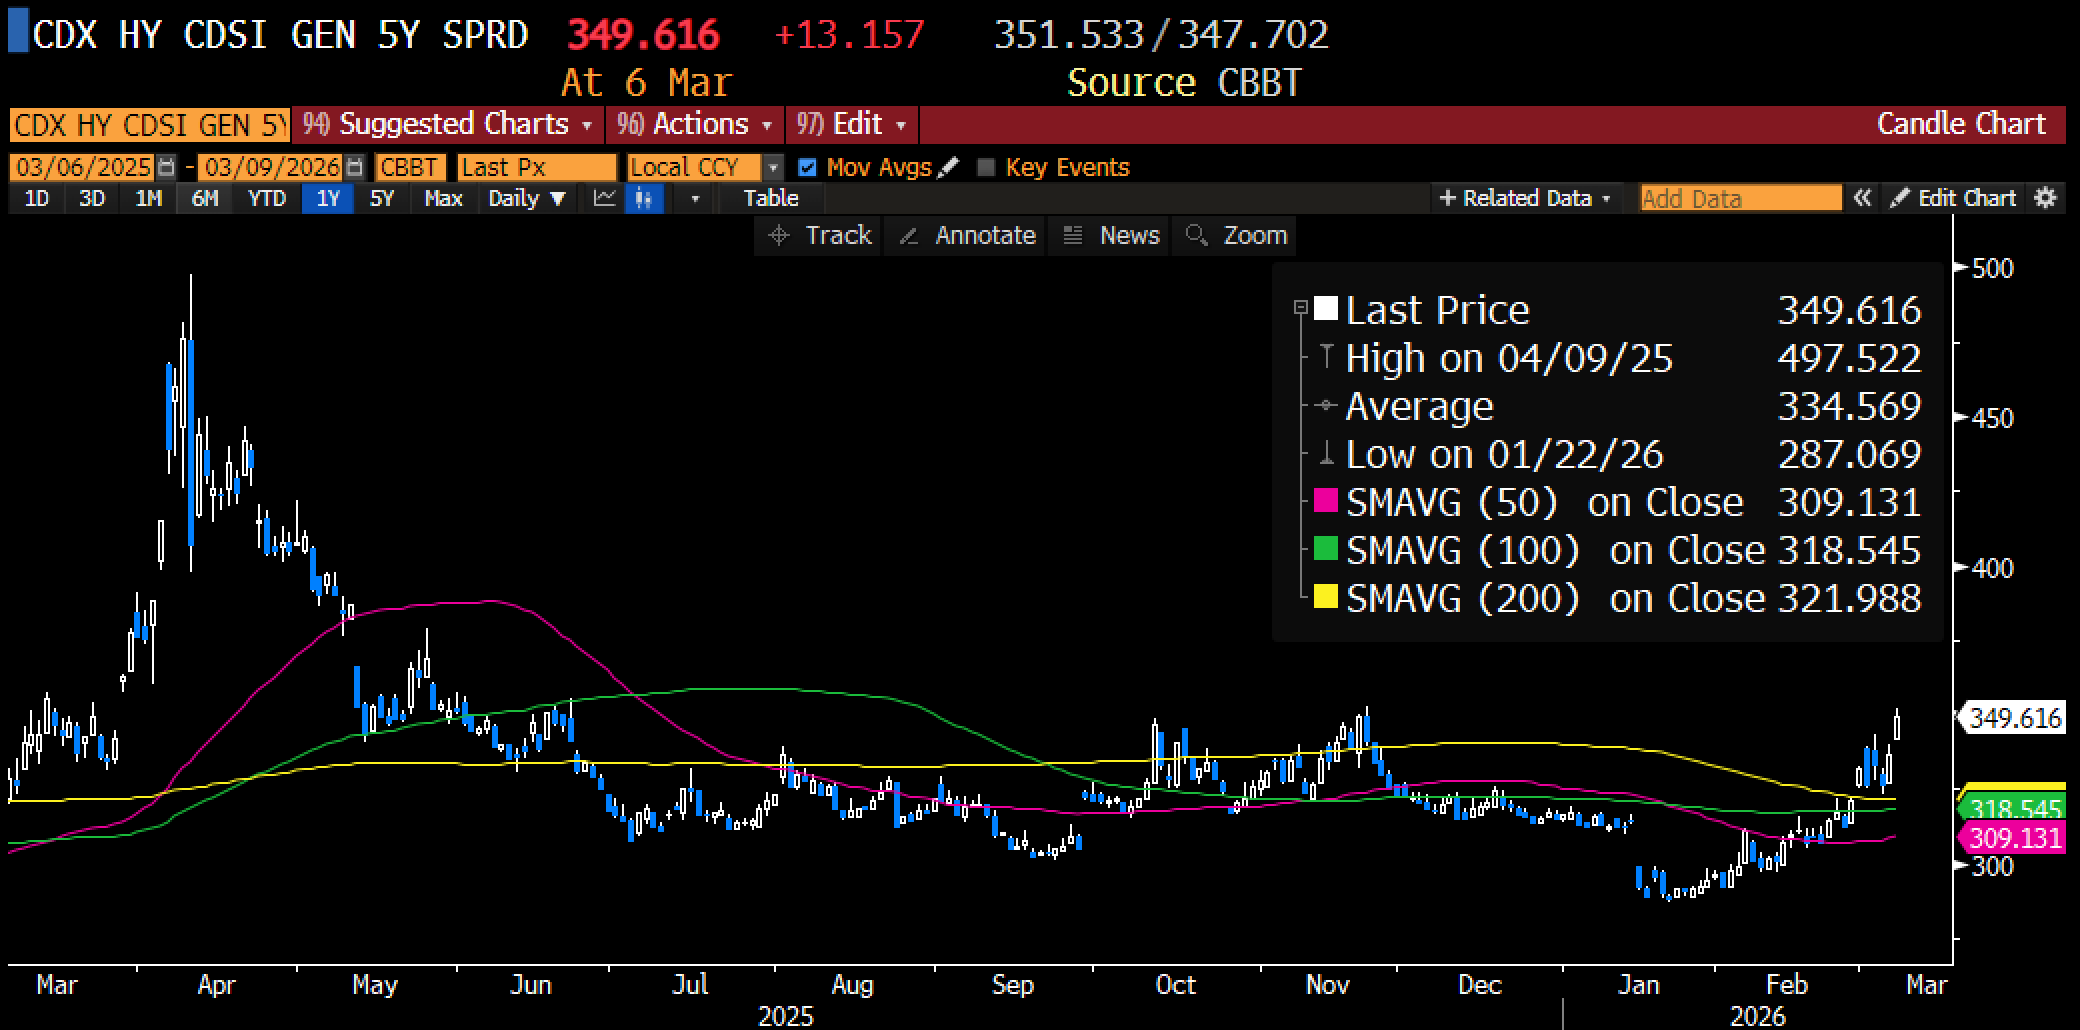
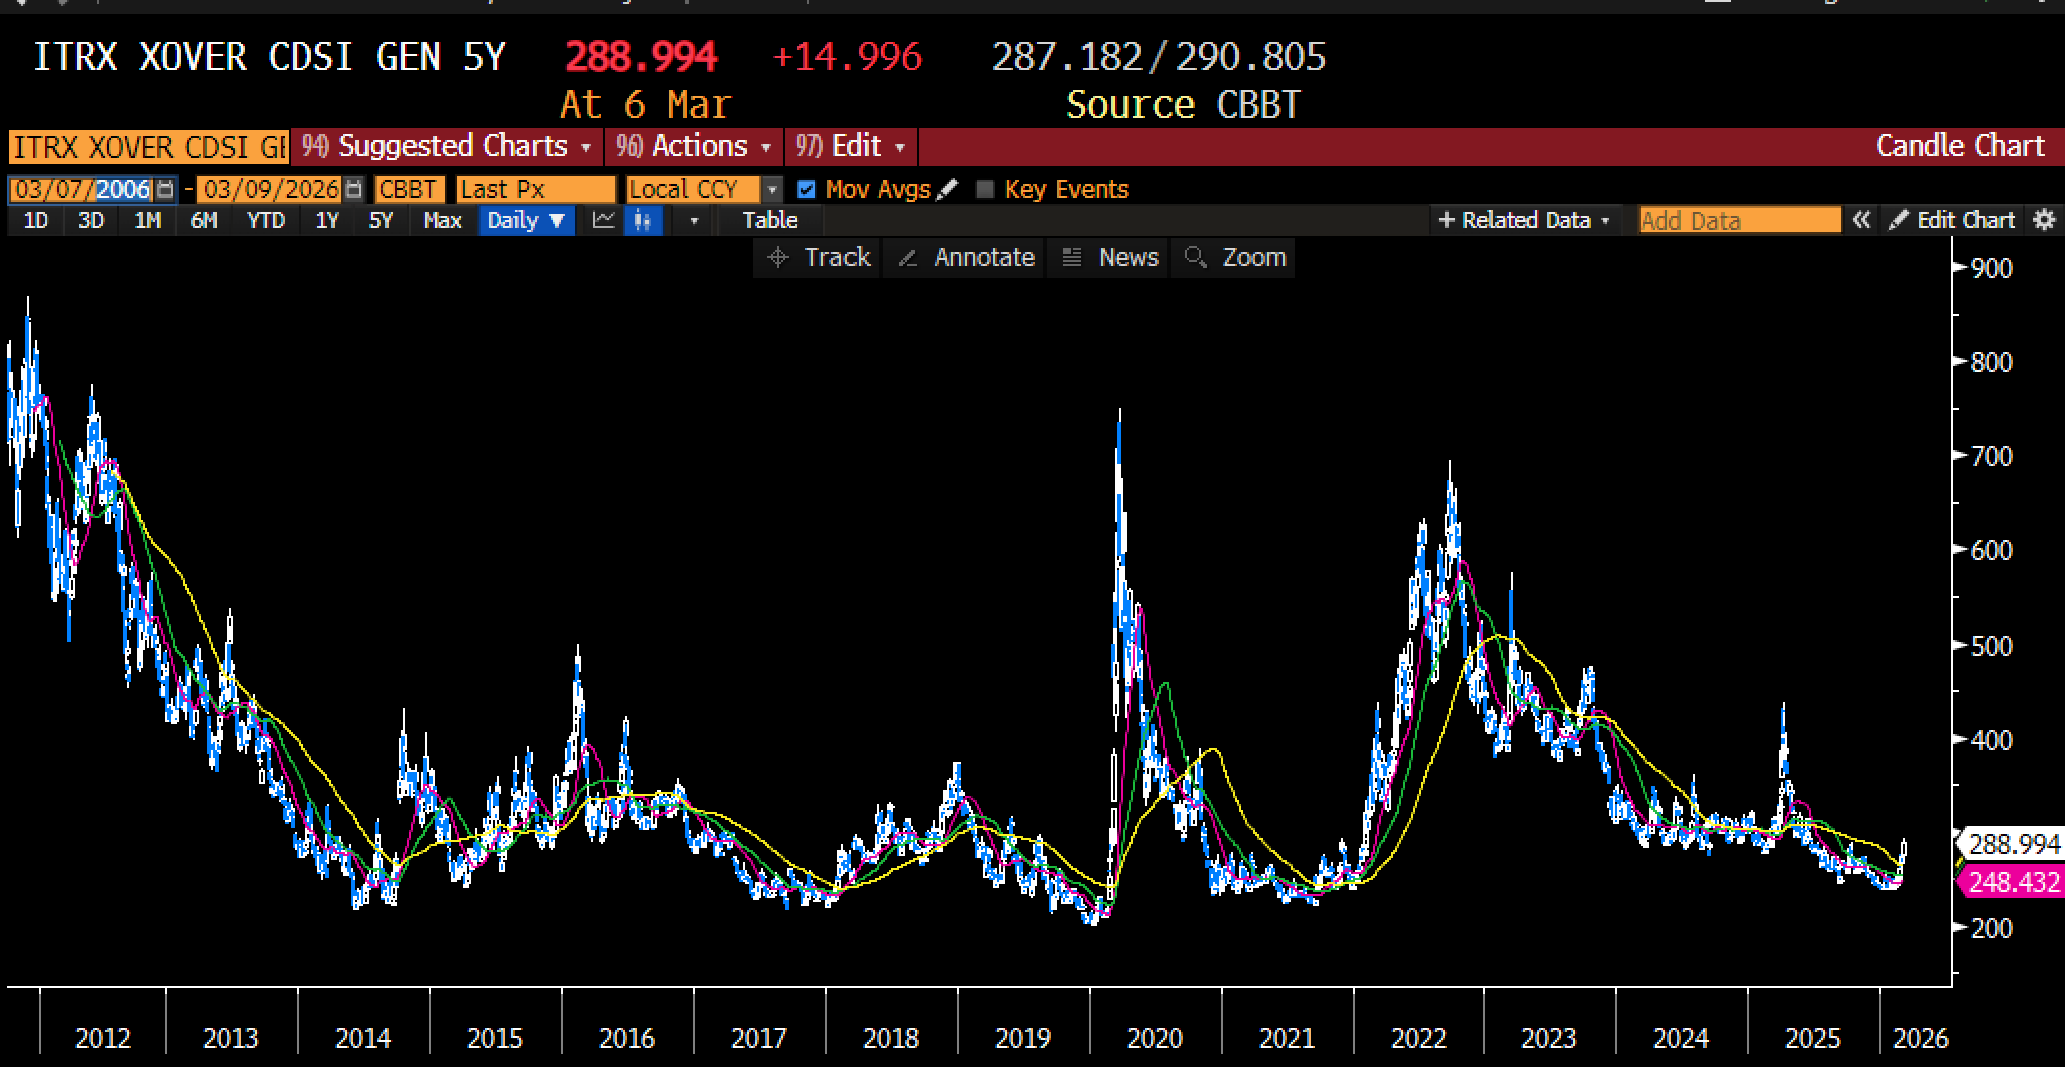
CDX Investment Grade widened to 58.5 on Friday, up 2.5 points on the day. CDX High Yield hit 350, up 13 points. iTraxx Crossover, the European high-yield proxy, jumped 15 points to 289, the sharpest single-day move since the banking scare in spring 2025. These are not panic levels. They are the levels where credit markets stop ignoring the macro and start pricing it.
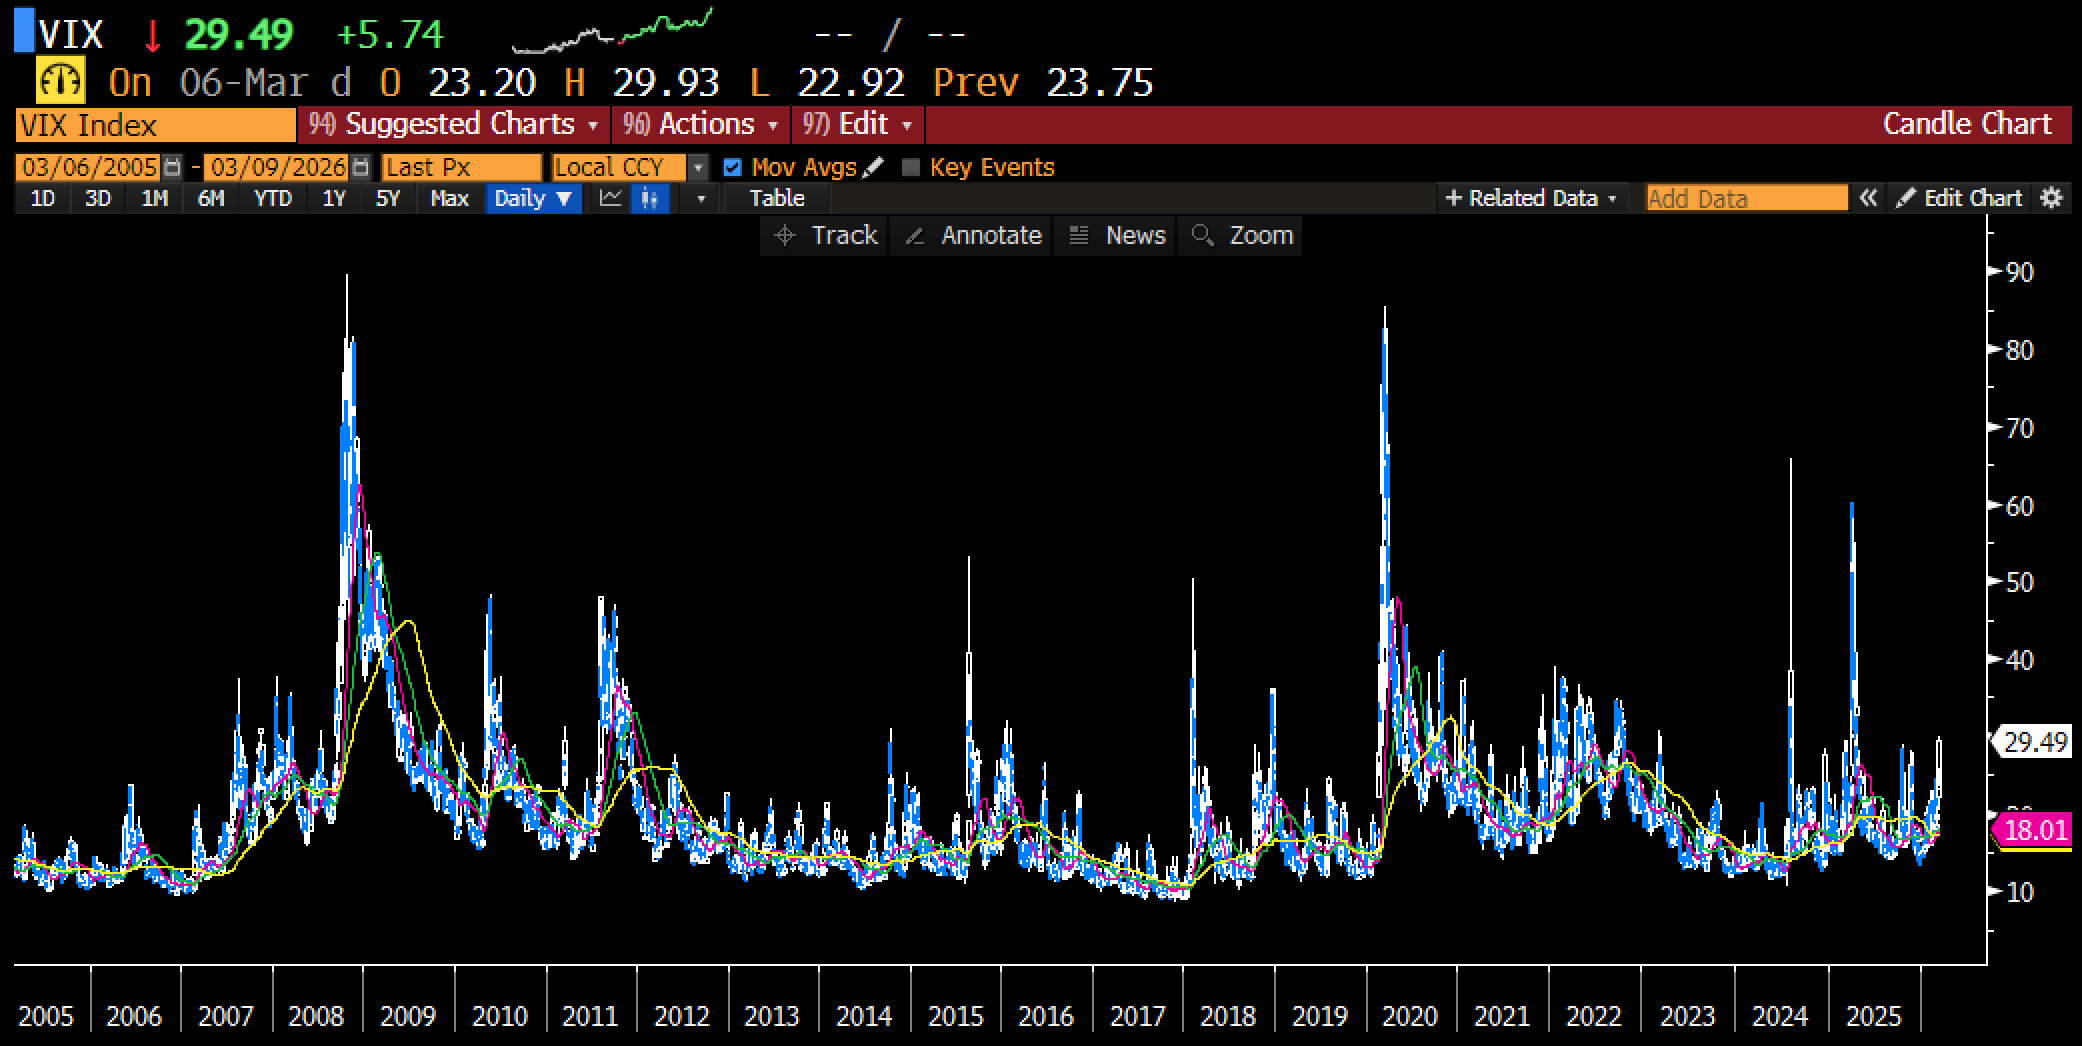
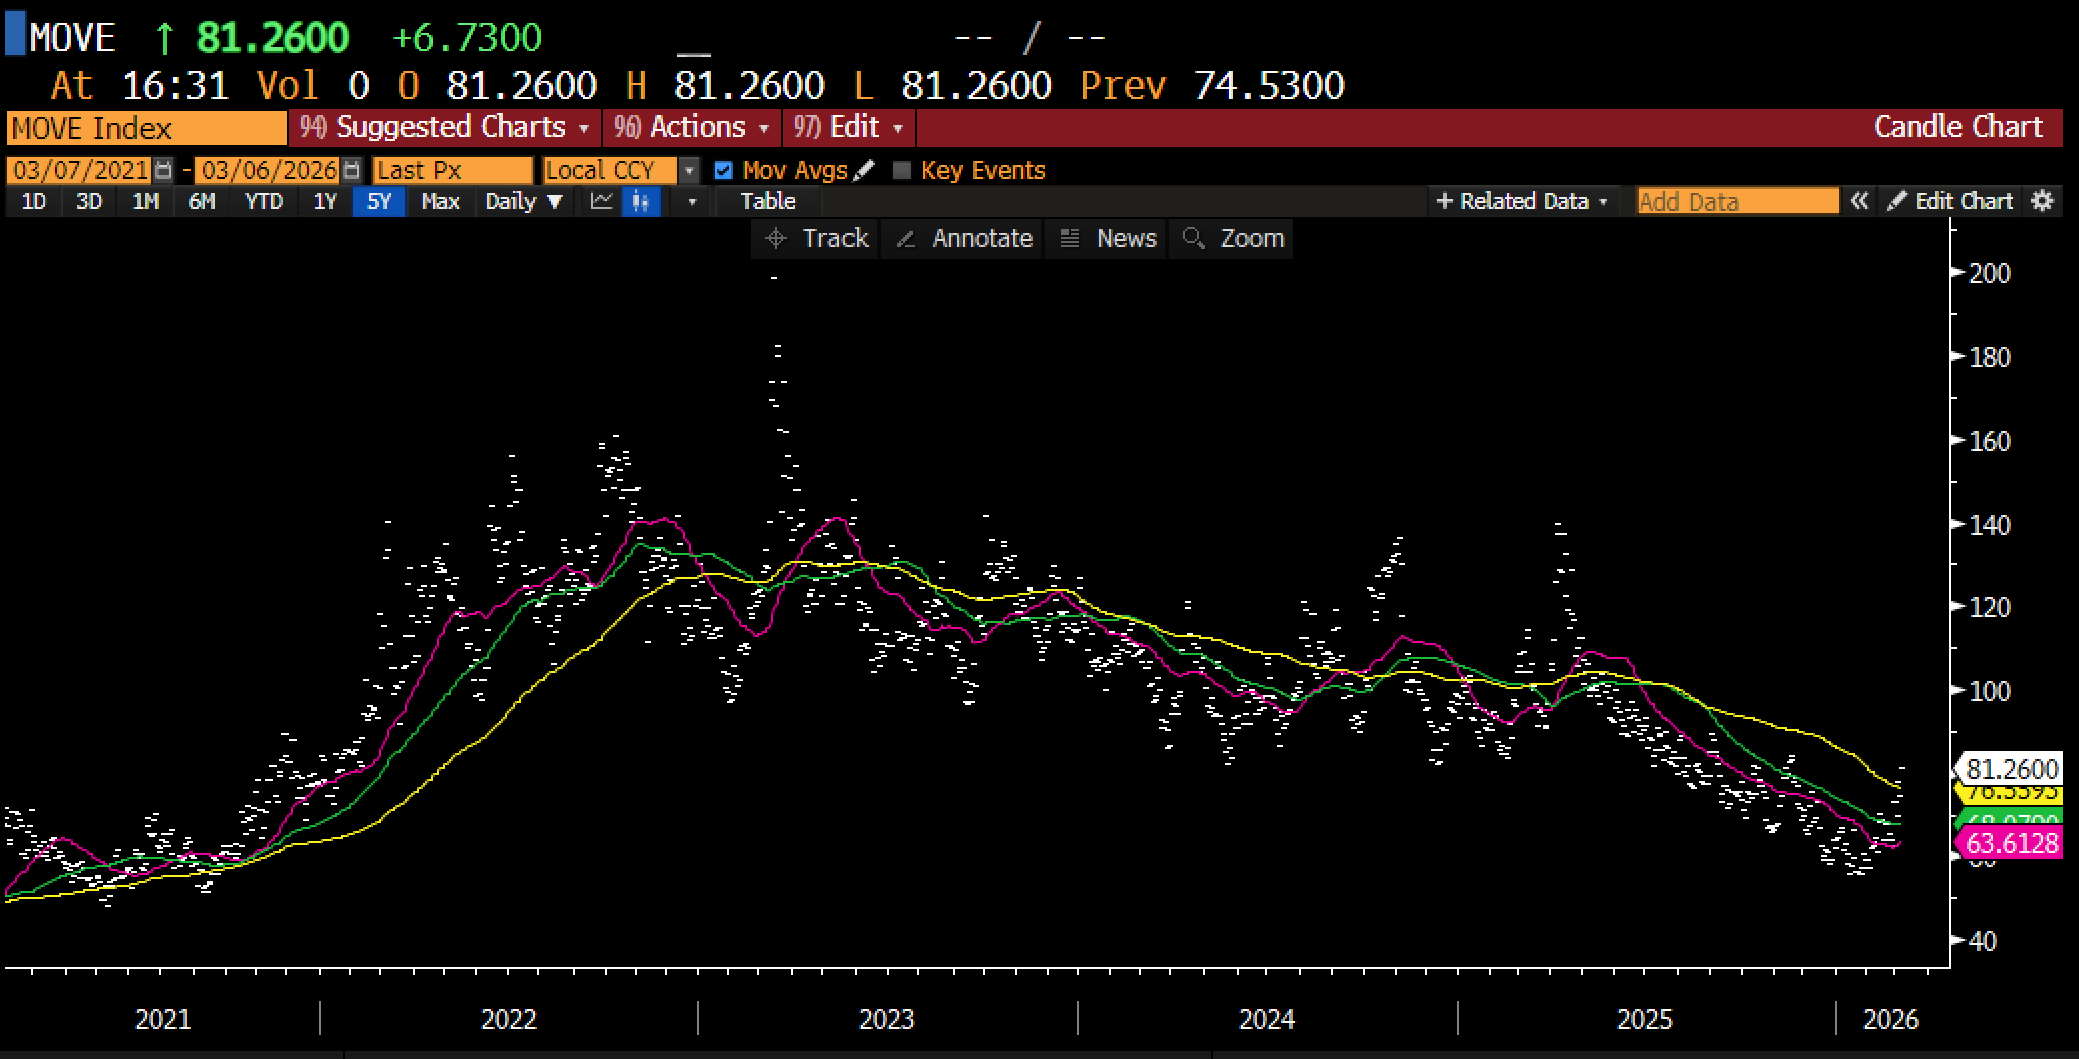
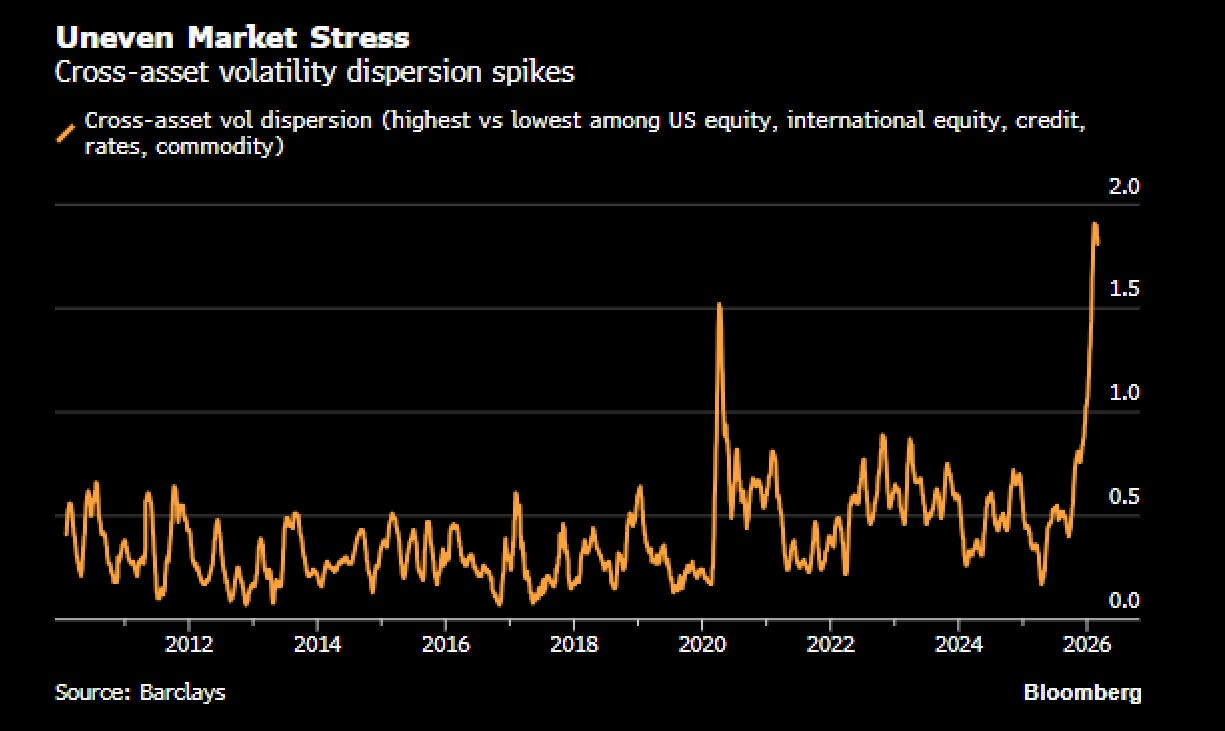
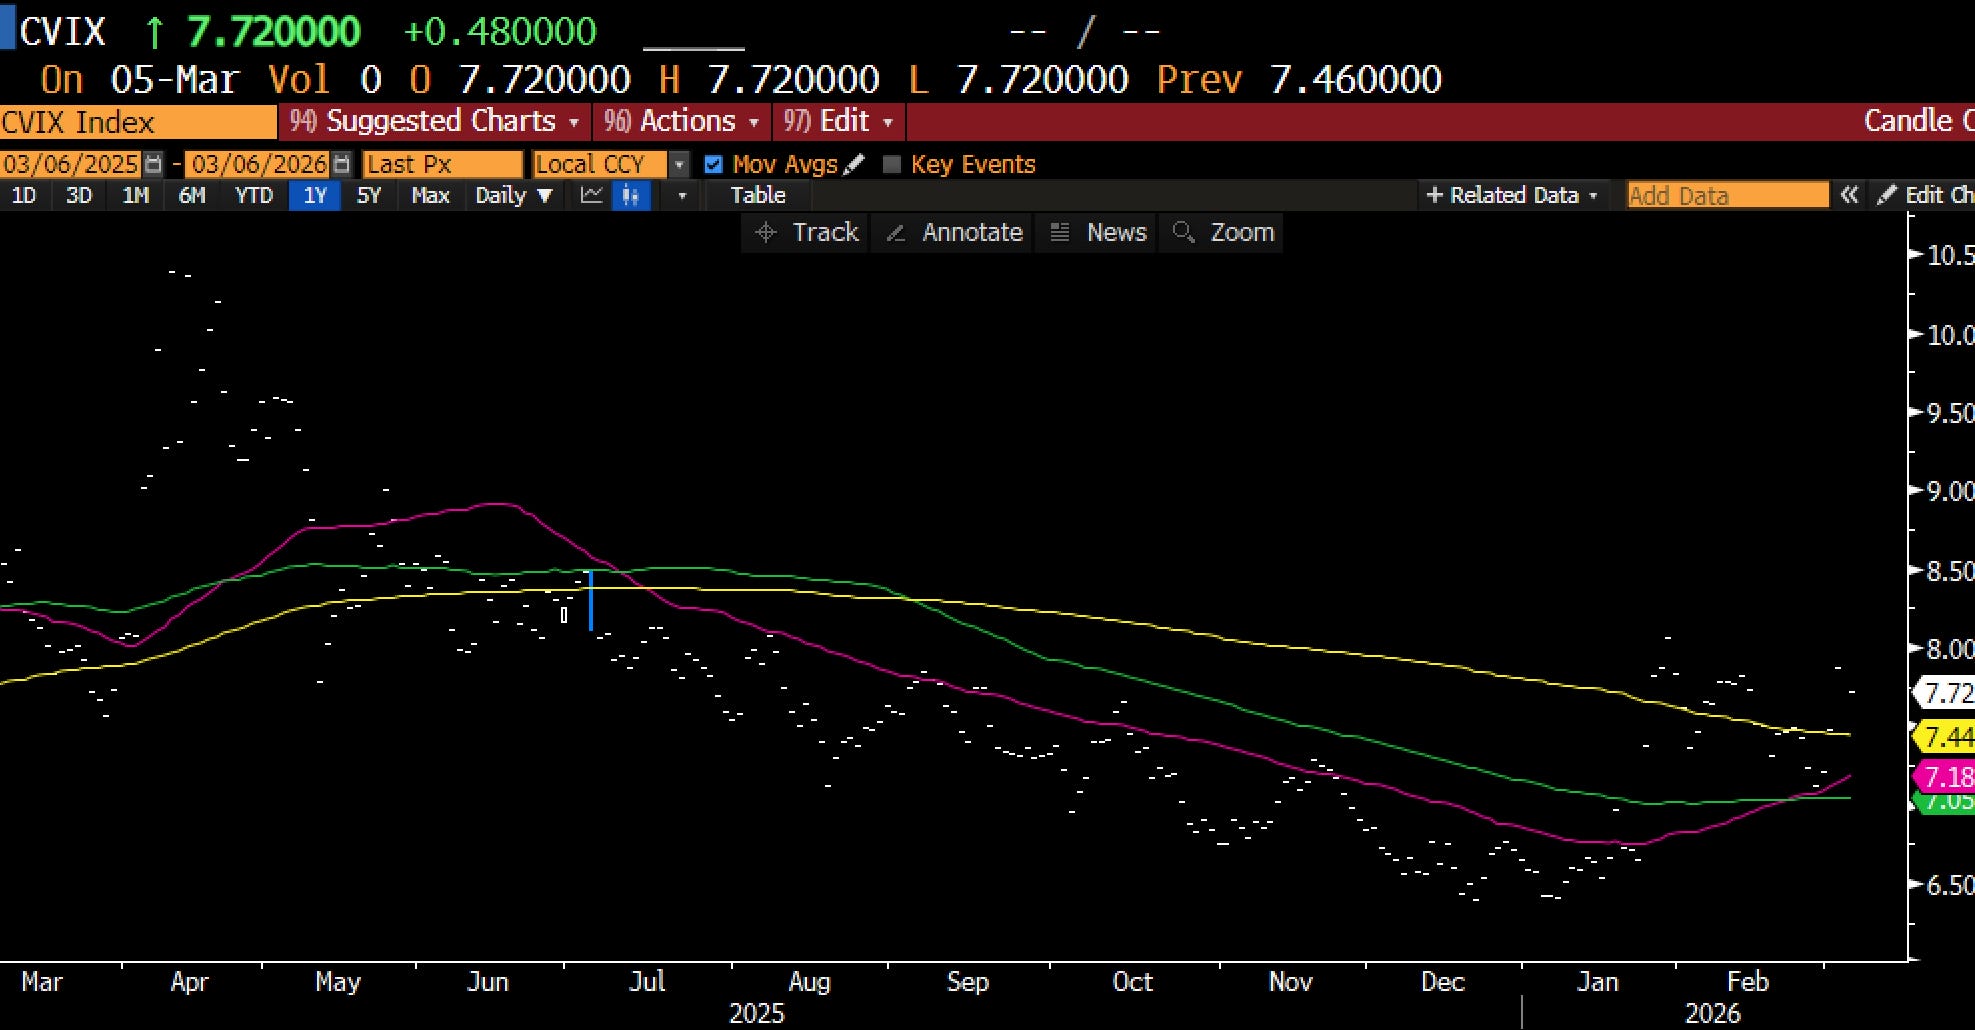
The VIX closed at 29.5. The MOVE index (bond market volatility) hit 81, up nearly 7 points. Cross-asset volatility dispersion spiked to levels not seen since 2022, according to Barclays. Stress isn't uniform yet. It's hitting some asset classes and not others, which is what the early stage of a crisis looks like, before correlations converge and liquidation starts.
HYG implied volatility is at 7.4 against a 10-day realized vol of 4.1. The options market is pricing a move in high yield that the cash market hasn't made yet. When implied leads realized by that margin, the next move is coming.
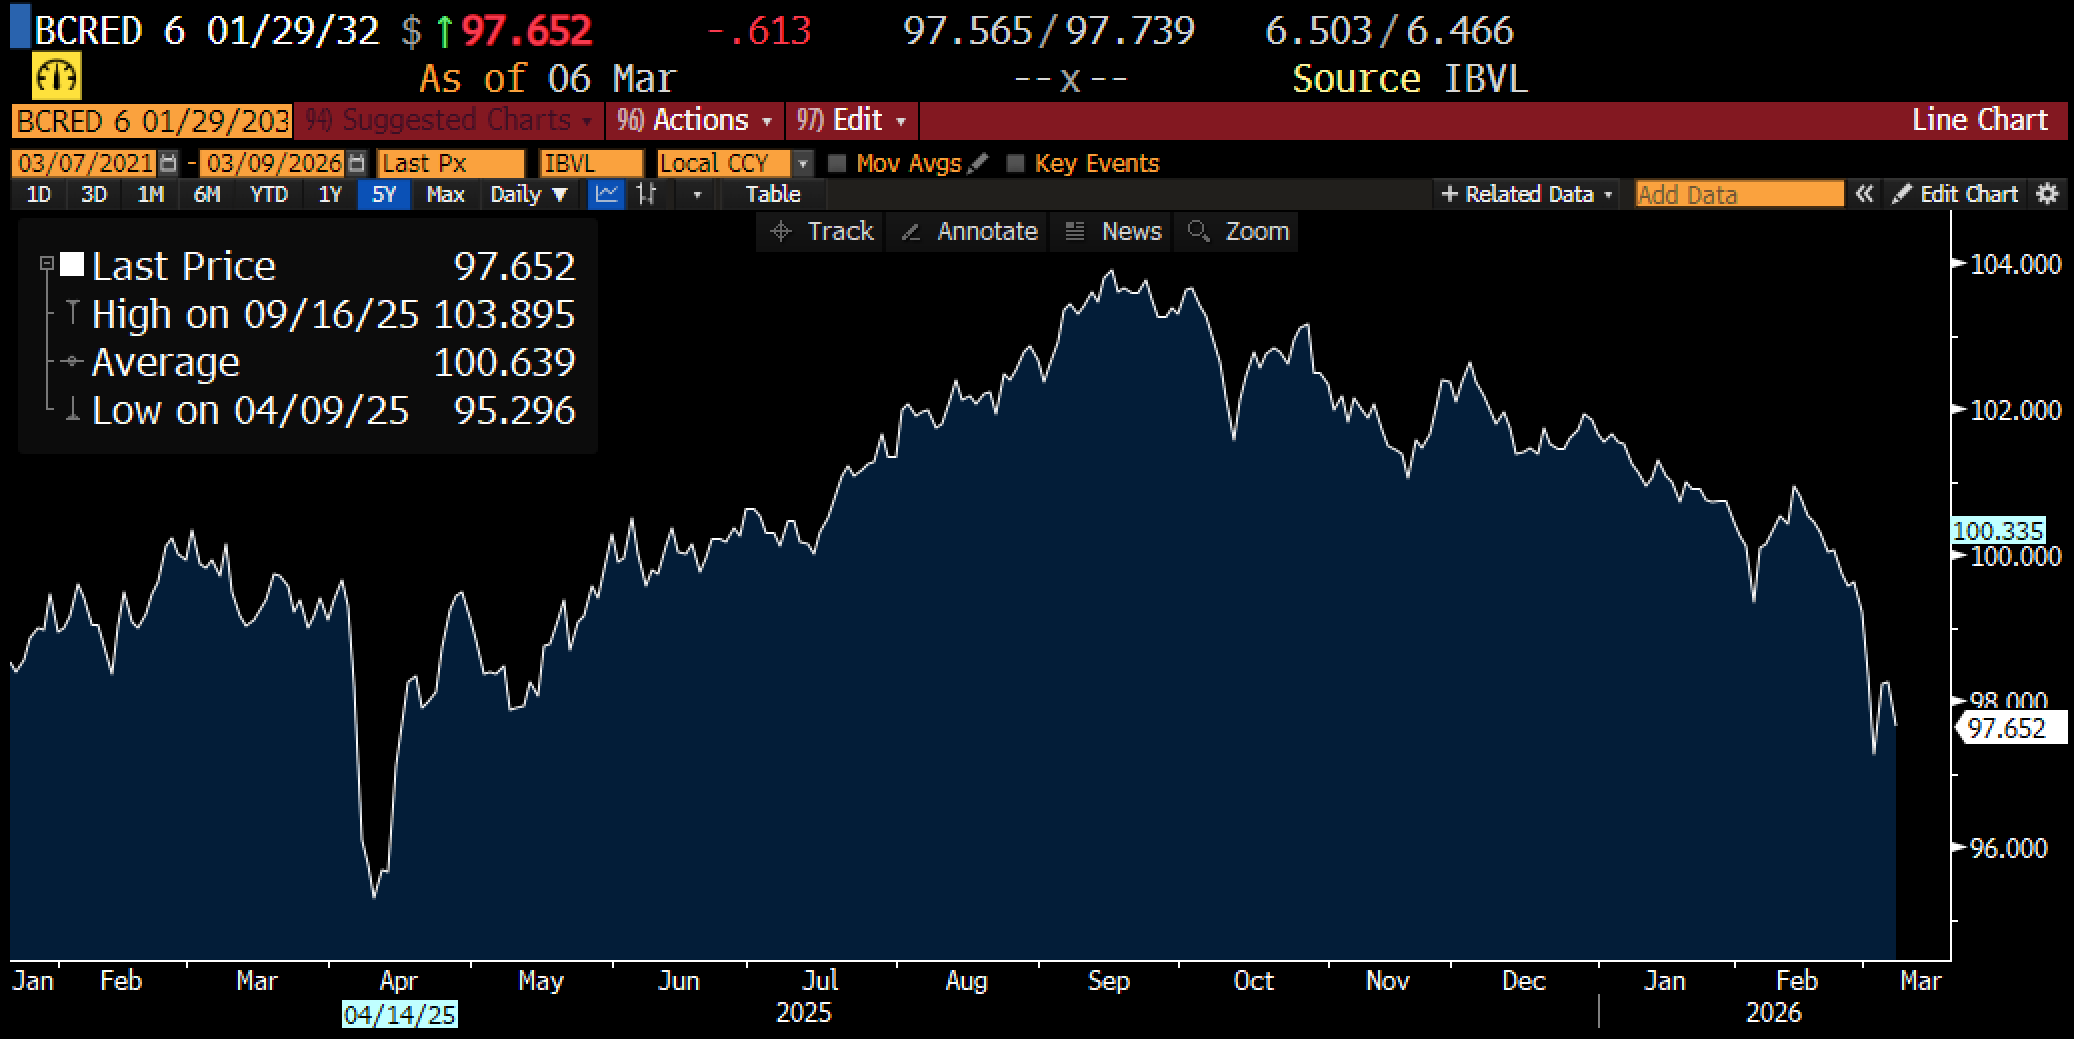
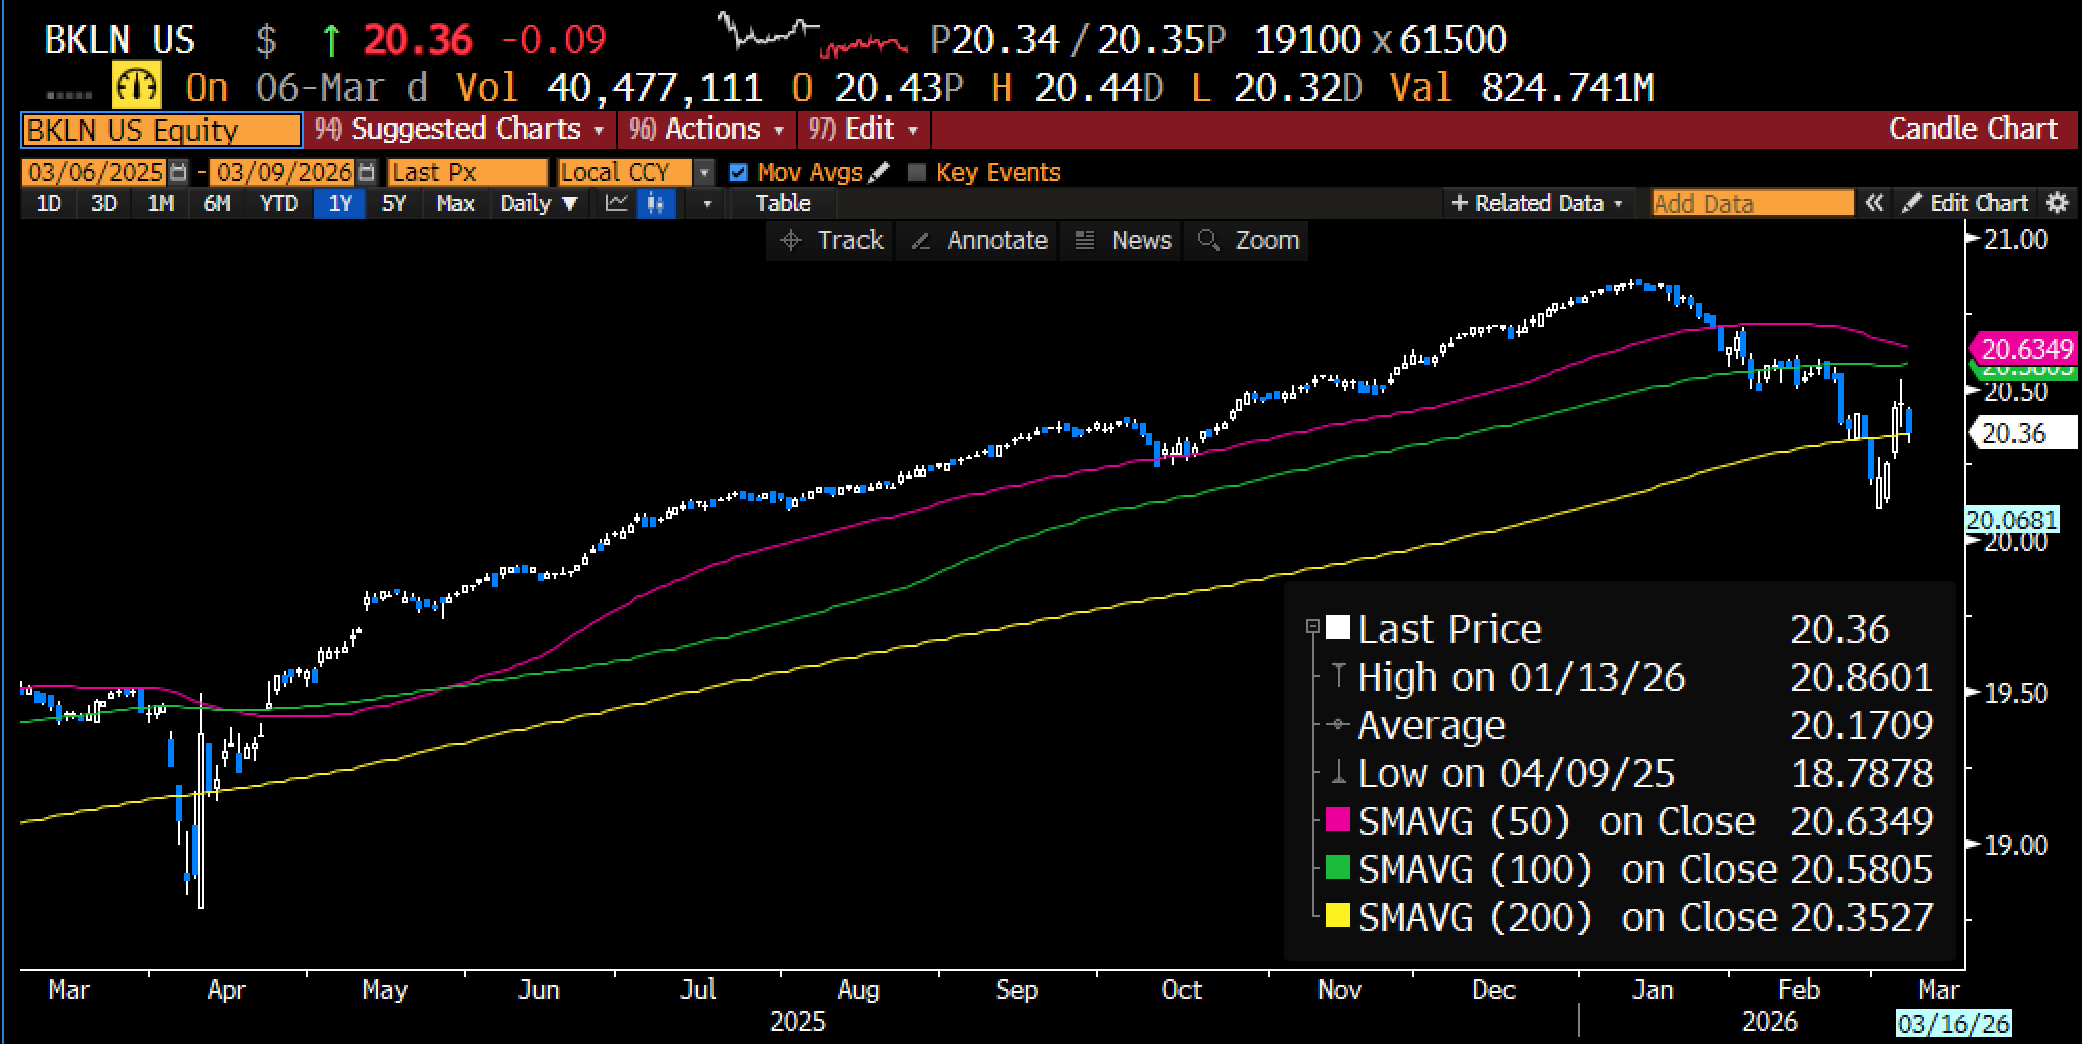
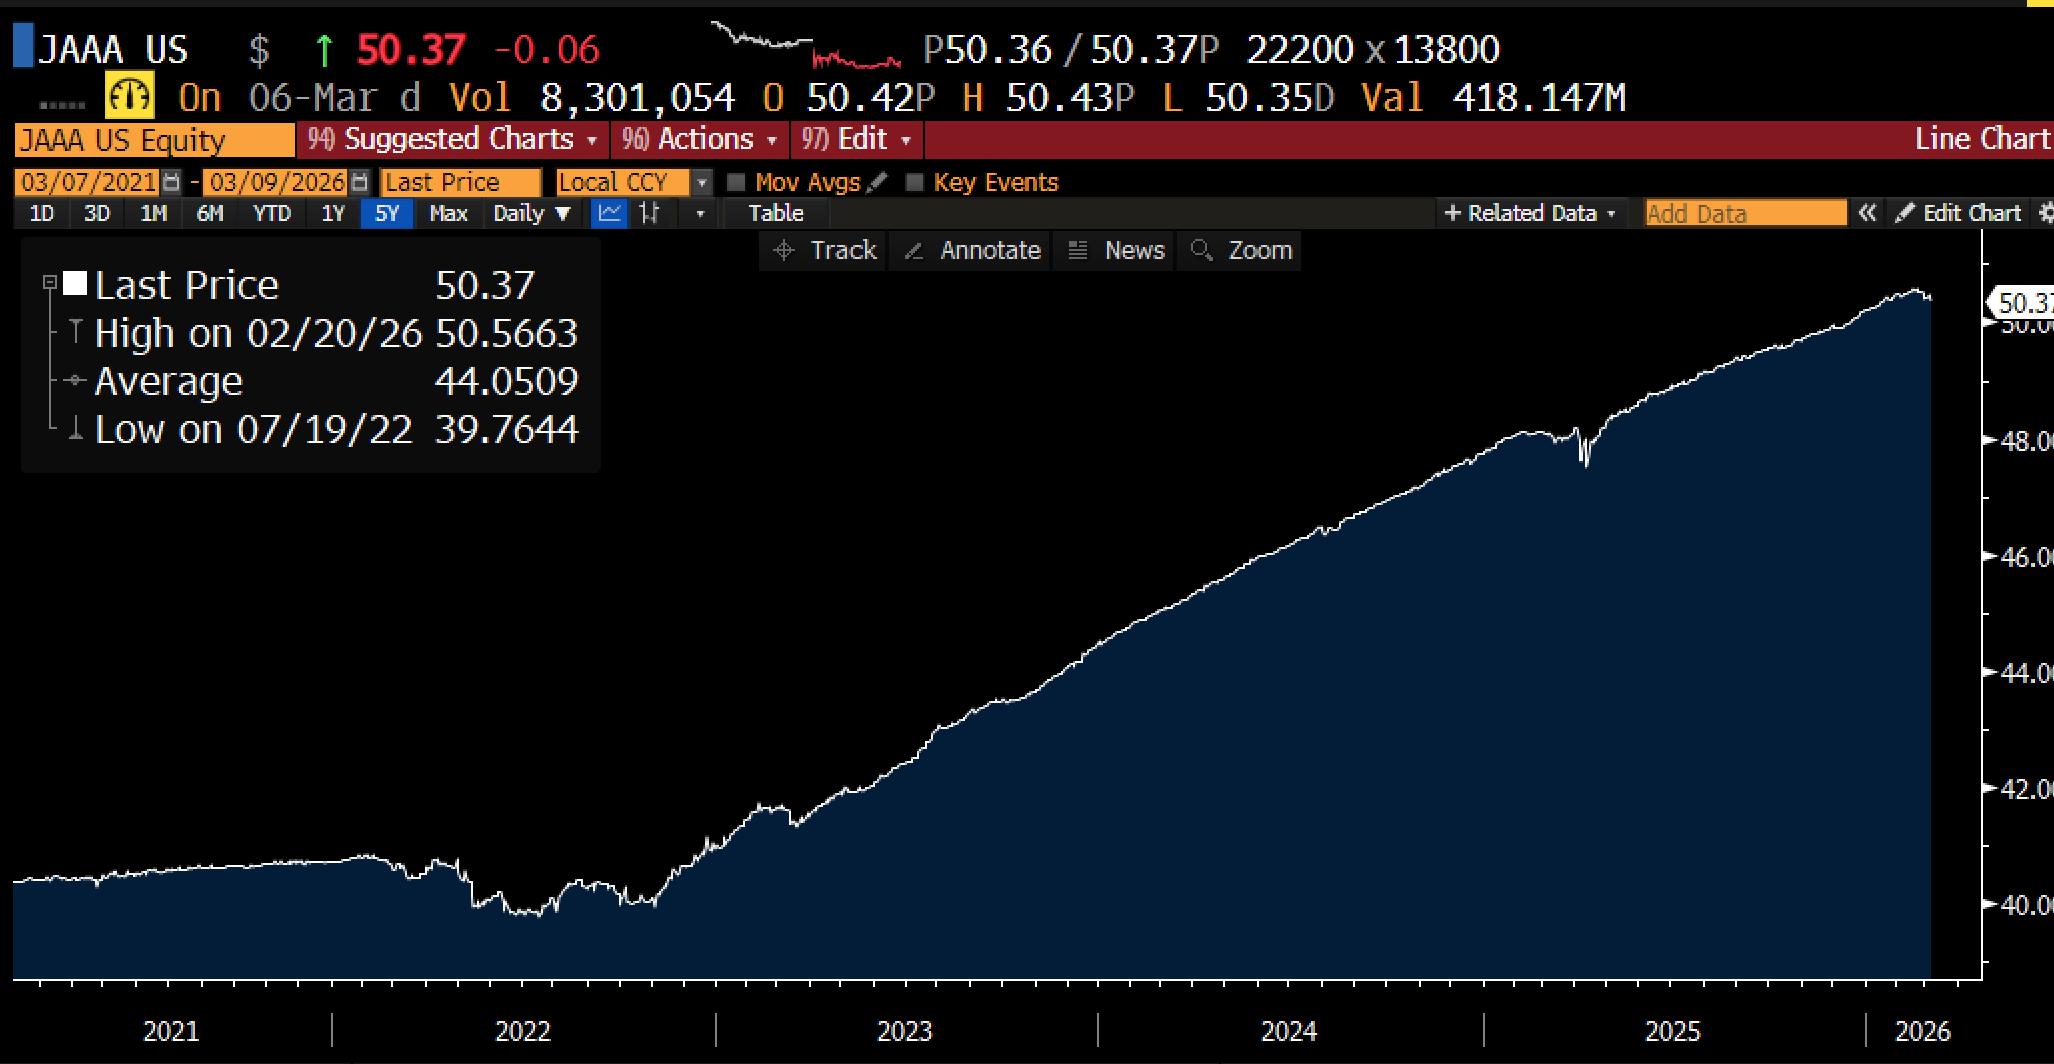
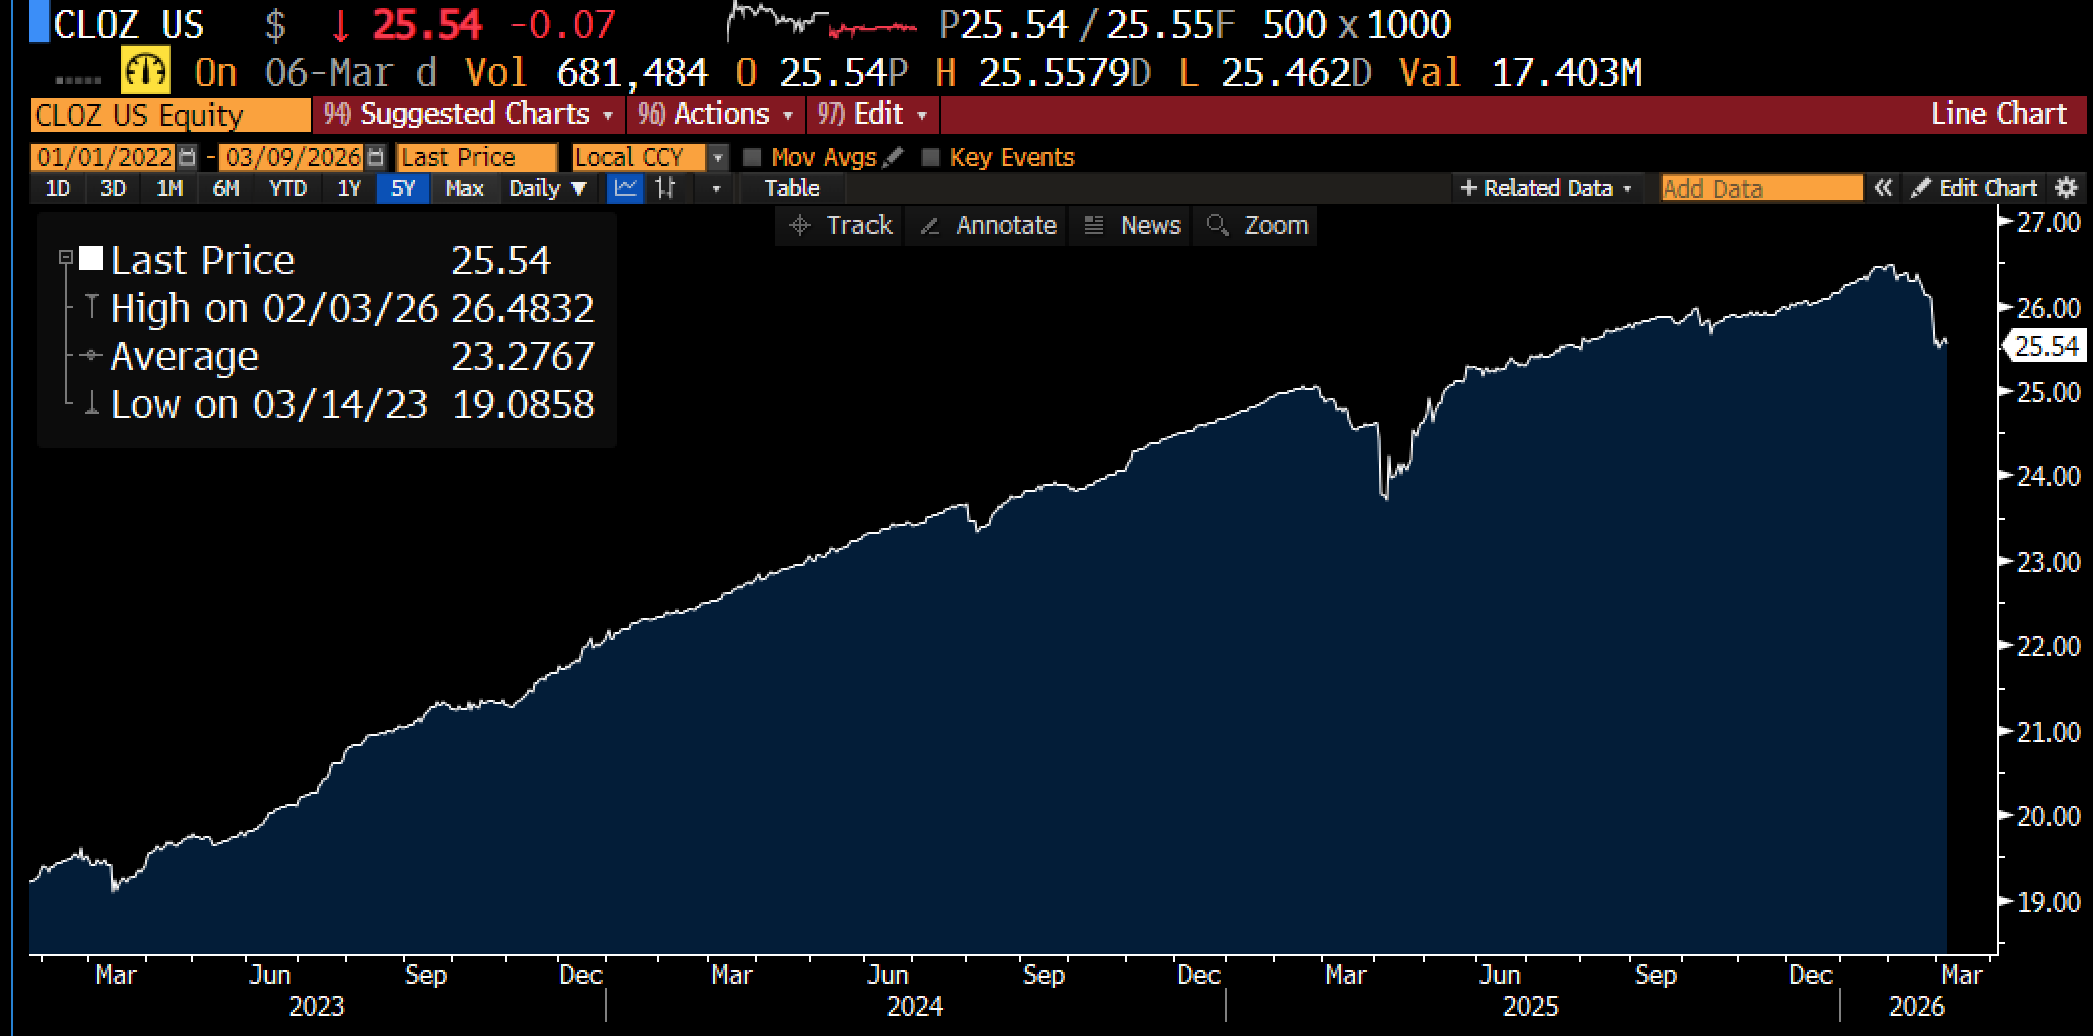
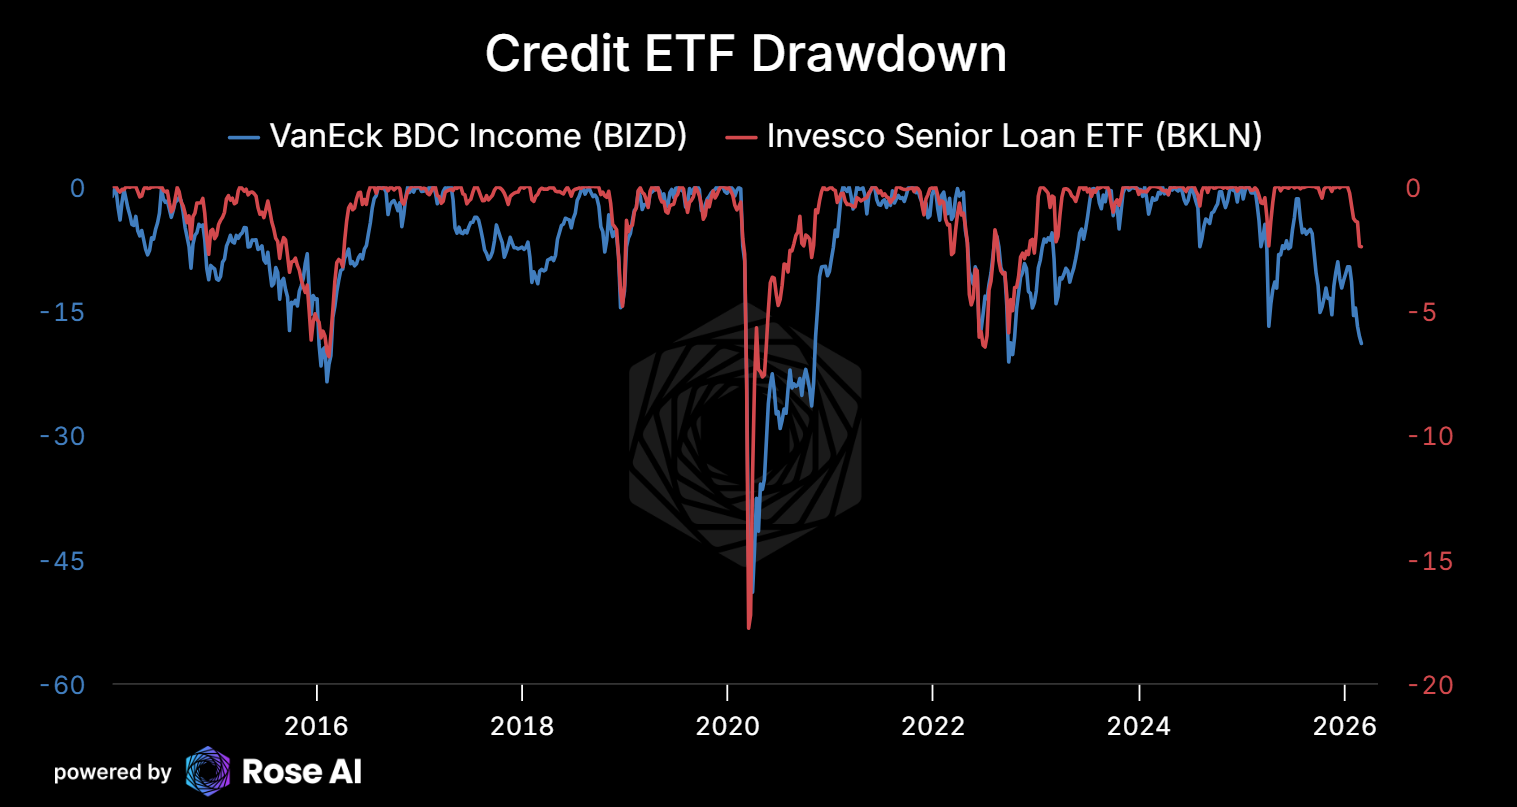
And here's what won't reprice even if we see peace: private credit. BCRED, Blackstone's flagship private credit fund, is at 97.65, barely down. CLO AAA tranches (JAAA) are at $50.37, near their all-time high. CLO equity (CLOZ) sits at $25.54. The senior loan ETFs (BKLN at $20.36, EMCLOUD at 1435) haven't moved either. Private credit marks are lagged by design. The NAVs update monthly or quarterly, and the underlying loans are marked by the managers who originated them. HYG reprices in real time. BCRED reprices on a spreadsheet cycle.
The transmission runs like this: the energy shock compresses margins for companies that were already operating at the edge of their debt covenants. Higher input costs meet weaker revenue. Cash flow deteriorates. Lenders tighten. Refinancing rates — if the Fed is pinned by inflation — don’t come down. The companies that loaded up on floating-rate private credit in 2023 and 2024 because it was cheap discover it isn’t cheap anymore, and the exit door is narrow because there’s no secondary market.
CDX is starting to move. HYG options are pricing the next leg. Private credit hasn’t flinched. That sequencing is how every credit cycle plays out: liquid markets reprice first, illiquid markets reprice last, and by the time the illiquid marks catch up it’s already a crisis.
More on this in an upcoming piece. For now: watch credit.
The Trade
The strip is wrong. The equity market is pricing a disruption that resolves in weeks and a strip that normalizes. The physical market is pricing something that already exceeds Goldman's four-week framework: production is shutting in, refineries are being bombed, and the benchmark closest to the disrupted barrels is knocking on $100.
Energy stocks already ran the anticipation leg from $57 to $70 before the strikes. A second leg needs the strip to confirm. If the conflict drags past three weeks without a visible off-ramp, the storage cascade becomes live, the strip reprices structurally, and energy stocks close the gap.
We are long energy equities. Though not enough.
What is not priced is the full sequence: energy shock feeds into CPI, the Fed stays pinned, the stock-bond correlation stays positive (killing the diversification hedge), corporate margins compress as employment weakens, credit spreads widen from here into real stress, and the earnings revision cycle begins against a tightening financial conditions backdrop. Equity multiples have not adjusted. The strip has not adjusted. Private credit, the $1.7 trillion pool of illiquid loans that reprices last, hasn’t adjusted at all.
The bond market, the gasoline distribution system, the shut-in production facilities, the Brent-Dubai spread, the CDX complex, and the Hormuz crossing data are all pointing the same direction. The strip will have to follow. The marks will too.
Our positioning:
Long gold, heavily. We rolled our calls into futures after they went in the money and now hold roughly 80% delta exposure. Gold hasn’t been performing as a geopolitical hedge due to the scramble for dollar liquidity, but think it will start to perform especially as folks rotate out of bonds and stocks. We want to own it.
Long upside calls in oil, 2-5 month tenors. After going long futures monday, we sold before the bump Friday. Still have some options: 1.5% premium, about 5% delta. The risk-neutral densities above explain why this is cheap. The market is pricing reversion. We are pricing infrastructure destruction. Would stay away from the front month, will be a wild ride and the mid-curve/timespreads are where the value is.
Short credit via HYG puts, March and April at-the-money strikes. 2.8% premium, roughly -139% delta. This is the highest-conviction leg of the book. Credit spreads are too tight for a world where the Fed is pinned, energy costs are rising, and corporate margins are about to compress. HYG reprices in real time. When it moves, it moves fast.
Short equities via S&P puts, July and September out-of-the-money strikes. 2.5% premium, about -24.5% delta. This is tail protection, not a directional bet. We want to own the right to sell into a market that hasn’t priced the earnings revision cycle.
Short insurance via KIE puts, June and September out-of-the-money strikes. 0.87% premium, roughly -7.5% delta. Property and casualty insurers are directly exposed to the physical destruction in the Gulf and to the secondary effects of rising energy costs on claims. Underappreciated.
Long VIX call spreads, March 30/40 strikes. 1.7% premium, 8.5% delta. Vol is elevated but not extreme. The cross-asset dispersion chart from Barclays tells you vol has room to run if correlations converge.
Long dollar via UUP call spreads, March 28/29 strikes. 0.93% premium, 32% delta. The dollar tends to strengthen in global risk-off episodes, and the reduction in Gulf surplus recycling into Treasuries supports the bid.
We are still holding long positions in memory, infrastructure, miners, and other equity names. Back-of-the-envelope, we are about 35% net long equities against roughly 10% short from pairs and thematic shorts. The hedge book is designed to pay if the scenario we’ve outlined here plays out over the next 60-90 days. The long book is designed to survive it.
Disclaimers
Thanks Alex! How much I learn from your posts!!! I insist on having the chance of getting your trade alerts. Keep it up! thanks
Out of gold for a bit. Too much dollar strength