

Conviction Through Dissonance
When to Trust Your Model Over the Market

When my old mentor called me “absolutist” about my view on China’s demand for gold the other day, I had to laugh.
“Actually,” I told him, “when I first pitched this thesis in 2015, I thought it was 50/50 - maybe even favoring they’d take the pain like Japan did: write down the bad loans, recap the banks, accept a decade of deleveraging. I’m only convinced now they are playing for keeps because I’ve watched them, for a decade, refuse to take this path, despite semi-annual attestations that the write down, the recap, and the bailout were just around the corner.”
Analysts have been calling for China bank restructuring since 2015. Still waiting. It’s like Waiting for Godot, except every year Godot sends a telegram saying “Restructuring definitely next quarter” while quietly printing another trillion yuan.
My conviction didn’t start high. It arrived there through a decade of evidence.
The Paradox Nobody Talks About
Here’s a question every trader faces but few can answer:
When do you trust your model over the market?
When price is moving against you - when you’re losing money while your thesis validates - do you:
Add to the position (trust your model, the market is temporarily wrong)
Cut the position (trust the market, your model is wrong)
Both answers can be right. Both can be catastrophic. The difference determines whether you’re me with the TIPS trade in 2008 or LTCM in 1998.
Let me show you both sides.
The TIPS Trade: When I Was Right But Got Cut
November 2008. Lehman just died. I’m at Nomura (their successor firm), managing what’s left of Lehman’s equity prop book in London. After making $10m in 9 months, they tell me my ‘budget’ for the next year: $20m. Let’s go.
Meanwhile, due to various technical issues (imagine going from driving a Ferrari to driving a Pinto), all of a sudden we’re not really trading volatility anymore, we’re punting macro ETFs.
Or as the kids call it these days: ‘going full macro.’
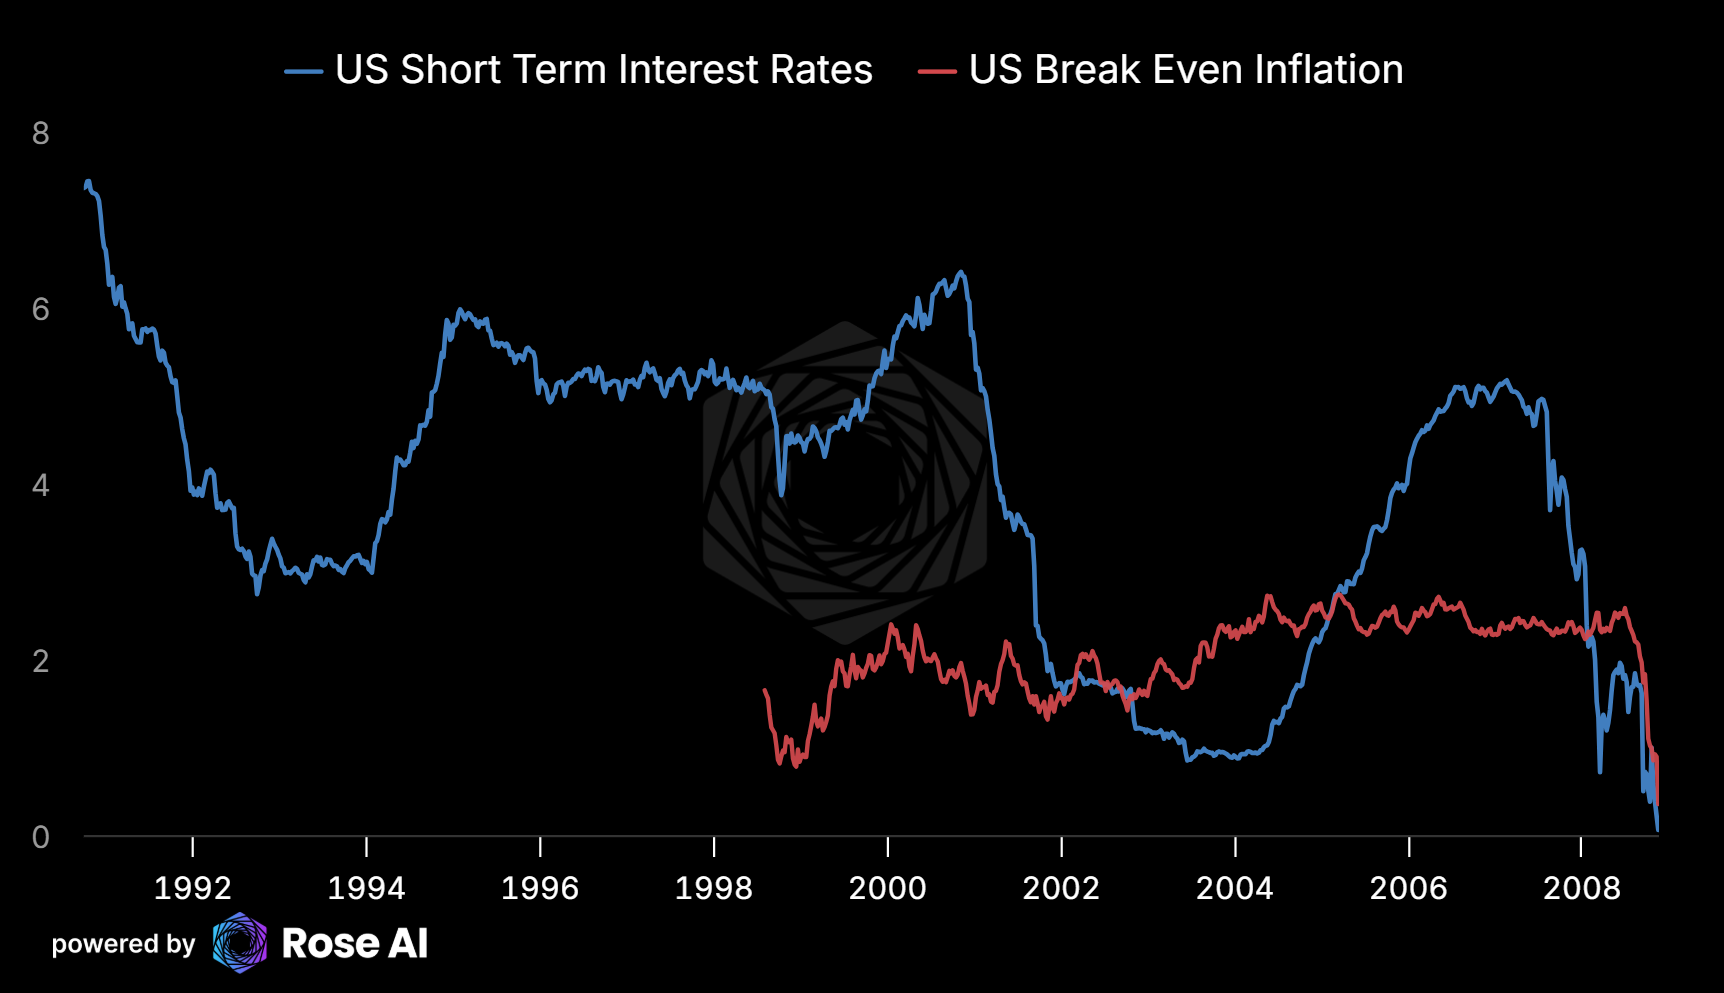
This is when I found an ETF that contained inflation-linked bonds: TIP (Treasury Inflation Protected Securities). Without getting too into details, these are basically treasuries (’nominal bonds’) which grow according to experienced inflation. At the time, by comparing the yield on these bonds to the yield on nominal bonds, you could back out that the market ‘expected’ (or ‘break even’) inflation in the US to be basically flat for ten years!
I was in love.
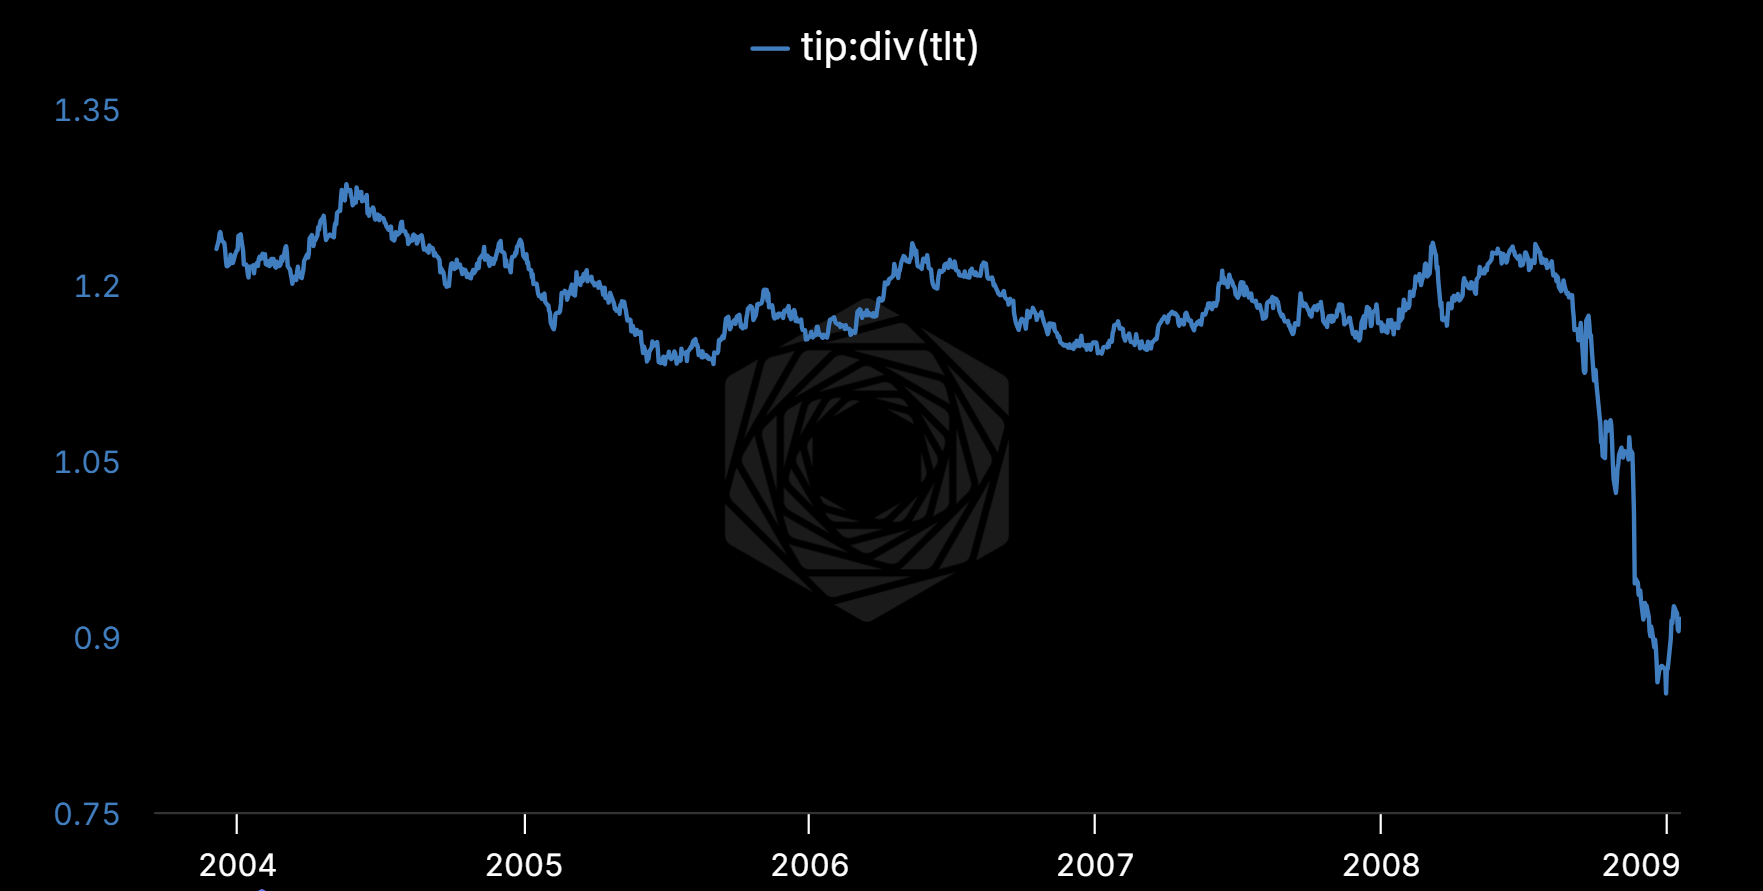
The way to do the trade was simple, if rough: buy TIP and sell TLT (the ETF of nominal treasuries).
My thesis: Fed going to zero + massive bank bailouts = eventual inflation
My linkages confirming:
Fed cuts to zero ✓
TARP passes, banks getting bailed out ✓
QE beginning ✓
Price action: Break-even inflation (BEI) pricing deflation for 5 years, flat for 10 years
The cognitive dissonance: Every step of my causal chain is validating. Fed is doing exactly what I predicted. But the market is pricing the opposite outcome. Policy is easing, but expectations for forward inflation keeps getting worse.
I’m long TIPS, short nominal bonds. The position is underwater. My boss doesn’t understand the trade.
His view: “The market is telling you you’re wrong. Cut it.”
My view: “The linkages are confirming sequentially. This is a time horizon mismatch - the Fed has cut rates to zero, the bailout is in, the banks are bottoming, inflation found its floor.
Jan 16th, he has a bad day on the (last) bad day for the trade. Too bad.
“Cut it.”
The lessons: a) it doesn’t matter if you are right if no one believes you, b) it’s not your money.
The LTCM Counter-Example: When Conviction Kills You
August 1998. Long-Term Capital Management.
Their thesis: Historical basis relationships in fixed income will converge
Price action: Russia defaults, basis spreads explode to unprecedented levels
Their response: Add to positions (we’re right, market is temporarily dislocated)
What actually happened: Their linkages were breaking - Russia default changed the game. Their models didn’t account for how their own positioning fundamentally changed leverage and positioning in the market. Folks start dogpiling and...
Outcome: They blew up.
The difference from my TIPS trade? In TIPS, linkages were confirming sequentially. In LTCM, linkages were breaking.
But here’s the terrifying part: Both feel exactly the same in the moment. You’re losing money. You’re convinced you’re right. The market is screaming you’re wrong.
How do you systematically tell the difference?
The Framework: Conviction Through Cognitive Dissonance
This is where my Oxford thesis on cognitive dissonance in social networks becomes directly applicable to trading. What was original a model for social phenomena I’ve since realized is really a model for thought and decision making.

The core insight from that work: Cognitive dissonance isn’t just psychological discomfort - it’s information. The gap between your model and reality, when properly measured, tells you which to trust.
Standard Bayesian updating: Price validates thesis → increase confidence
Conviction through cognitive dissonance: Your causal model validates BUT price disagrees → this gap is where you make money
The bigger the dissonance between:
Your linkage chain validating (dominoes falling in predicted order)
Price moving against you (market disagrees)
= The bigger your edge (if you’re right about causality)
This is not comfortable. You’re sizing UP when it feels worst - losing money while your model confirms. But that’s the signal.
Decision Framework: When to Trust Model vs. Market
Add to position (trust your model) when:
✓ Linkages confirming sequentially (A→B→C happening in order)
✓ High dissonance (large gap between fundamentals and price)
✓ Time horizon mismatch (market pricing different timeframe than your thesis)
✓ Position isolated (not part of broader “everything going wrong”)
Cut position (trust the market) when:
✗ Linkages breaking (A→B not happening as predicted)
✗ Low dissonance (price and fundamentals agree you’re wrong)
✗ Correlation clustering (all your positions moving against you)
✗ Unknown unknowns (things happening you can’t explain)
The TIPS trade hit all four green lights. Every causal link validating, massive dissonance between policy actions and BEI pricing, clear time horizon mismatch, position uncorrelated to broader portfolio.
LTCM hit all four red lights. Russia default broke their convergence assumptions, correlation across supposedly uncorrelated positions, margin calls creating forced sellers (changing market structure), liquidity evaporating (unknown unknown).
The China Gold Case Study: Ten Years of Dissonance
Now let me show you how this framework compounds conviction over a decade.
2015: The Original Thesis
“Gold in China” - I win either way:
Path A: They restructure banks (take the pain)
Households realize WMPs are worthless
Depositors flee to gold
→ Private gold demand surges
Path B: They keep printing
PBOC accumulates gold as reserve
Currency depreciates intentionally
→ State gold buying
Either path → Gold rallies
My initial conviction: 50/50, maybe favoring Path A (because that’s what responsible central banks do)
Position sizing: 15% of portfolio (testing the thesis)
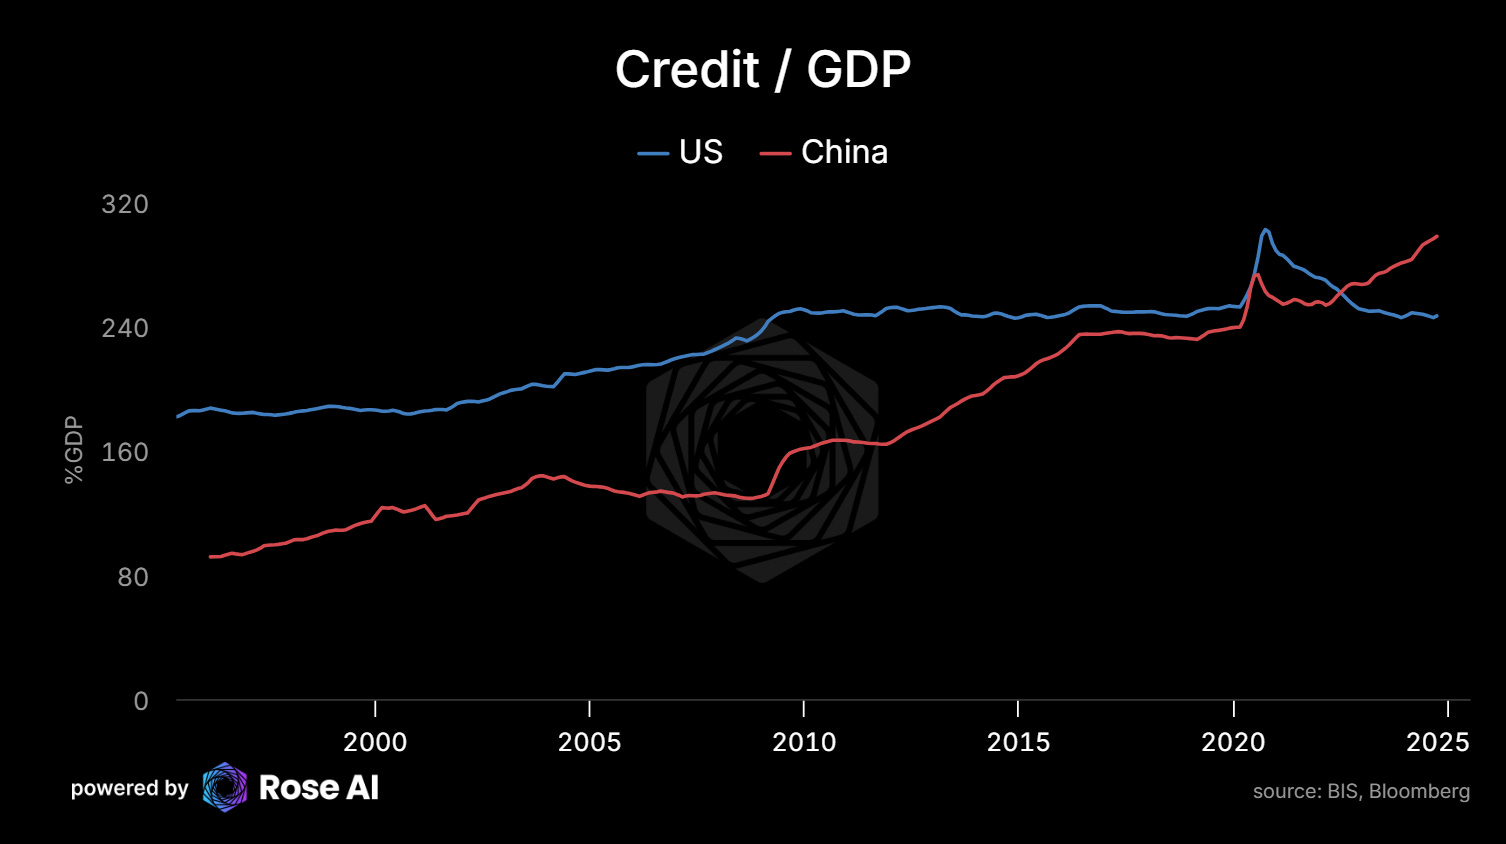
Over six years, I watched them refuse to restructure at five major inflection points. Each time, the pattern was the same: perfect opportunity, political capital to act, and they chose more leverage instead.
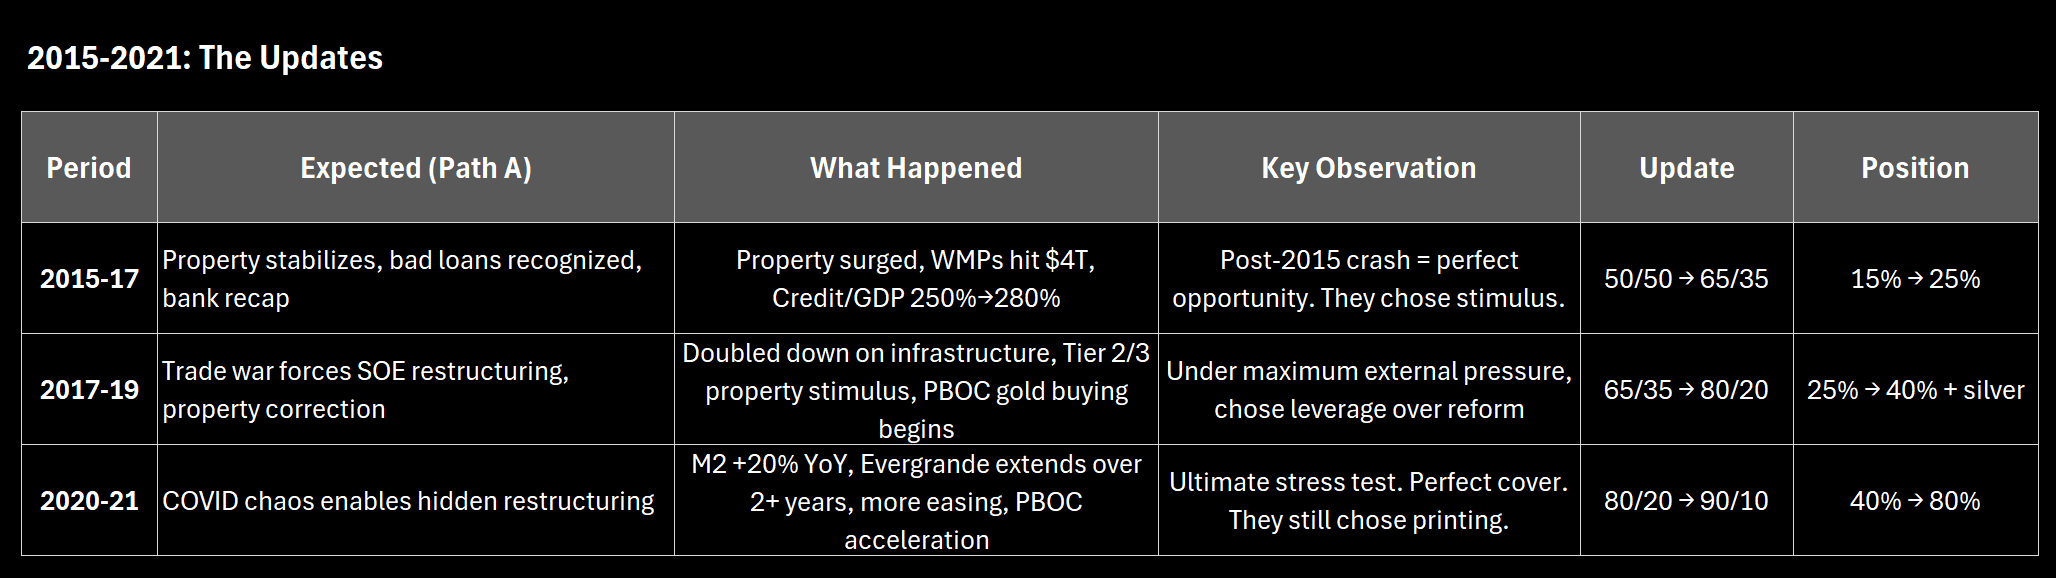
The trade war moment was critical. Trump’s tariffs gave them the perfect excuse - “external pressure forces painful reforms” is the standard playbook (see: Asian Financial Crisis). Instead, they went the other direction. That’s when I realized their revealed preference wasn’t about politics or timing. It was about something else entirely.
By 2021, the pattern was undeniable. Stock crash, trade war, COVID, Evergrande - five perfect opportunities over six years. They chose printing every single time. This wasn’t delay. It was strategy.

2022-Present: Both Paths Firing Simultaneously
Here’s what I didn’t predict: They’d trigger BOTH paths at once.
Path B (State buying):
PBOC adding 300+ tons to reserves (likely underreported)
Currency deprec 6.3 → 7.3 vs USD
Continued monetary expansion
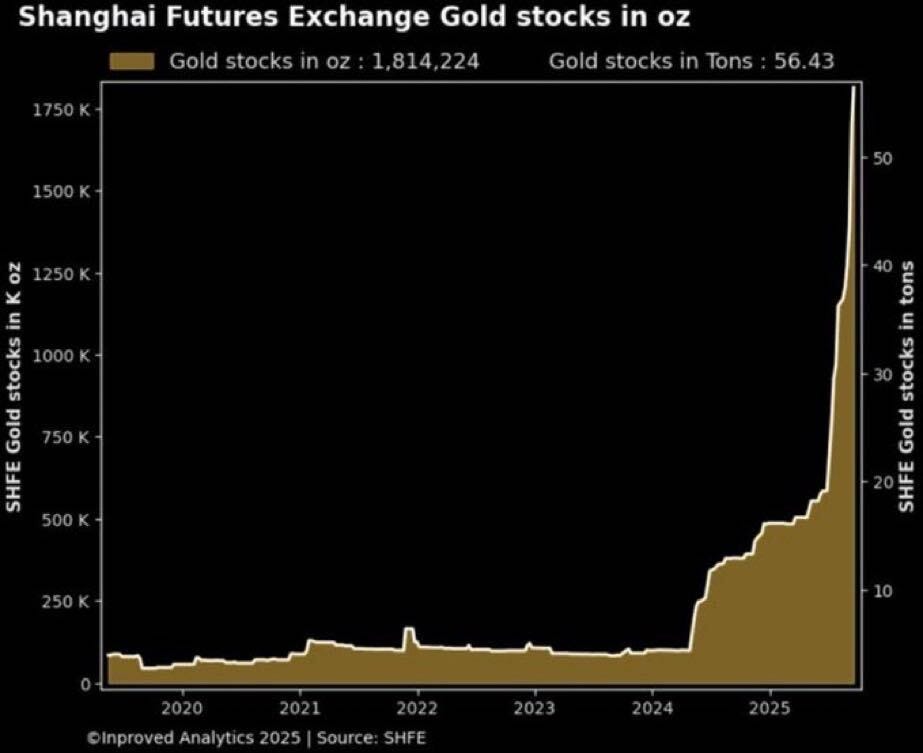
Path A (Private flight) happening as byproduct:
Private gold imports 100+ tons/month
Shanghai premiums $20-40/oz over London (physical shortage) in early 2025
Country Garden defaults (#1 developer)
Youth unemployment 20%+
The feedback loop: The more they print to avoid restructuring (Path B), the more households flee to gold (Path A). Both demand sources accelerating simultaneously.
This wasn’t in my original probability tree. I thought it was one OR the other. Reality: it’s BOTH.
Then Ukraine invaded in February 2022. Another inflection point - they could have pivoted toward the West, restructured to gain support against Russia. Instead they doubled down on the Russia/BRICS axis, making it clear they’re never buying USTs again. That was the final update: 90/10 → 95/5.
Linkage tracking:
Every single link confirming ✓✓✓
Dual demand (state + private) ✓
Supply constraint (mine production can’t keep up) ✓
Bayesian update: 90/10 → 95/5
Position adjustment: 80% → 110% (levered via options/futures)
At 95/5 conviction and 110%+ levered, I’m no longer just testing a thesis. I’m betting the farm. But conviction isn’t the same as certainty - and understanding the difference matters.
The Meta-Inference: What Their Choices Reveal
Here’s the deeper question: Why haven’t they restructured when they’ve had ten years of opportunities?
Standard interpretation: Political constraints, kicking the can, incompetence
My interpretation through revealed preferences: Their time horizon is shorter than restructuring would take. They aren’t just managing an economy, they are challenging the fundamental status quo: the dollar as reserve currency.
The math:
Restructuring = 10+ years (see Japan)
They’ve had 10 years of opportunities
They’ve chosen printing every single time
→ Their time horizon must be <10 years
What has a <10 year time horizon that makes their behavior rational?
I don’t need to know. That’s the beauty of this framework.
What I know:
Time horizon shorter than restructuring period
Gold accumulation rational given that constraint
Currency depreciation acceptable/intentional
Financial stability subordinate to some other goal
Trading implication: Doesn’t matter WHY their time horizon is short. Just matters that it IS.
Whether it’s Taiwan, domestic political transition, fear of social unrest, or something else entirely - the revealed preference is clear: they’re not going to restructure, they’re going to print and accumulate gold.
What Would Change My Mind: The Three Green Lines
I wrote about this in October 2024.

I’m not bearish China out of ideology. I’m positioned this way because policymakers haven’t answered three questions:
Green Line 1: Who takes the loss and how much?
Current: $140bn for LGFVs (1.4% of $10T LGFV debt)
Need: Comprehensive guarantee of which liabilities backed by central government
Green Line 2: What’s the bank recap plan?
Current: $40bn injected, $140bn CoCos announced
Need: $1-3 trillion comprehensive recap + clear resolution for failed shadow banks
Green Line 3: Helicopter money?
Current: Vague “welfare benefits”
Need: Direct fiscal transfers to households, $1-2 trillion, fast implementation (months not years)
What would make me cut precious metals and buy Chinese equities:
All three green lines crossed + comprehensive restructuring announced + household stimulus deployed.
I’ll know it when I see it. Haven’t seen it yet.
Until then, revealed preferences say: Print, extend, accumulate gold. And that’s the trade.
The China gold trade is about what they’ve already done. The silver trade is about what I think happens next. Different timeframes, different conviction levels.
The Silver Extension: Dual Demand
Same causal validation framework:
Monetary demand (like gold):
China printing → Private + state gold buying
→ Silver benefits (monetary metal)
Industrial demand (unlike gold):
AI boom → Energy demand → Solar growth
Solar panels: 25% of global silver production (2024)
New panels: 15-20mg/watt (vs 10mg old tech)
Meta’s 4GW for AI = 1.2M oz silver
The setup:
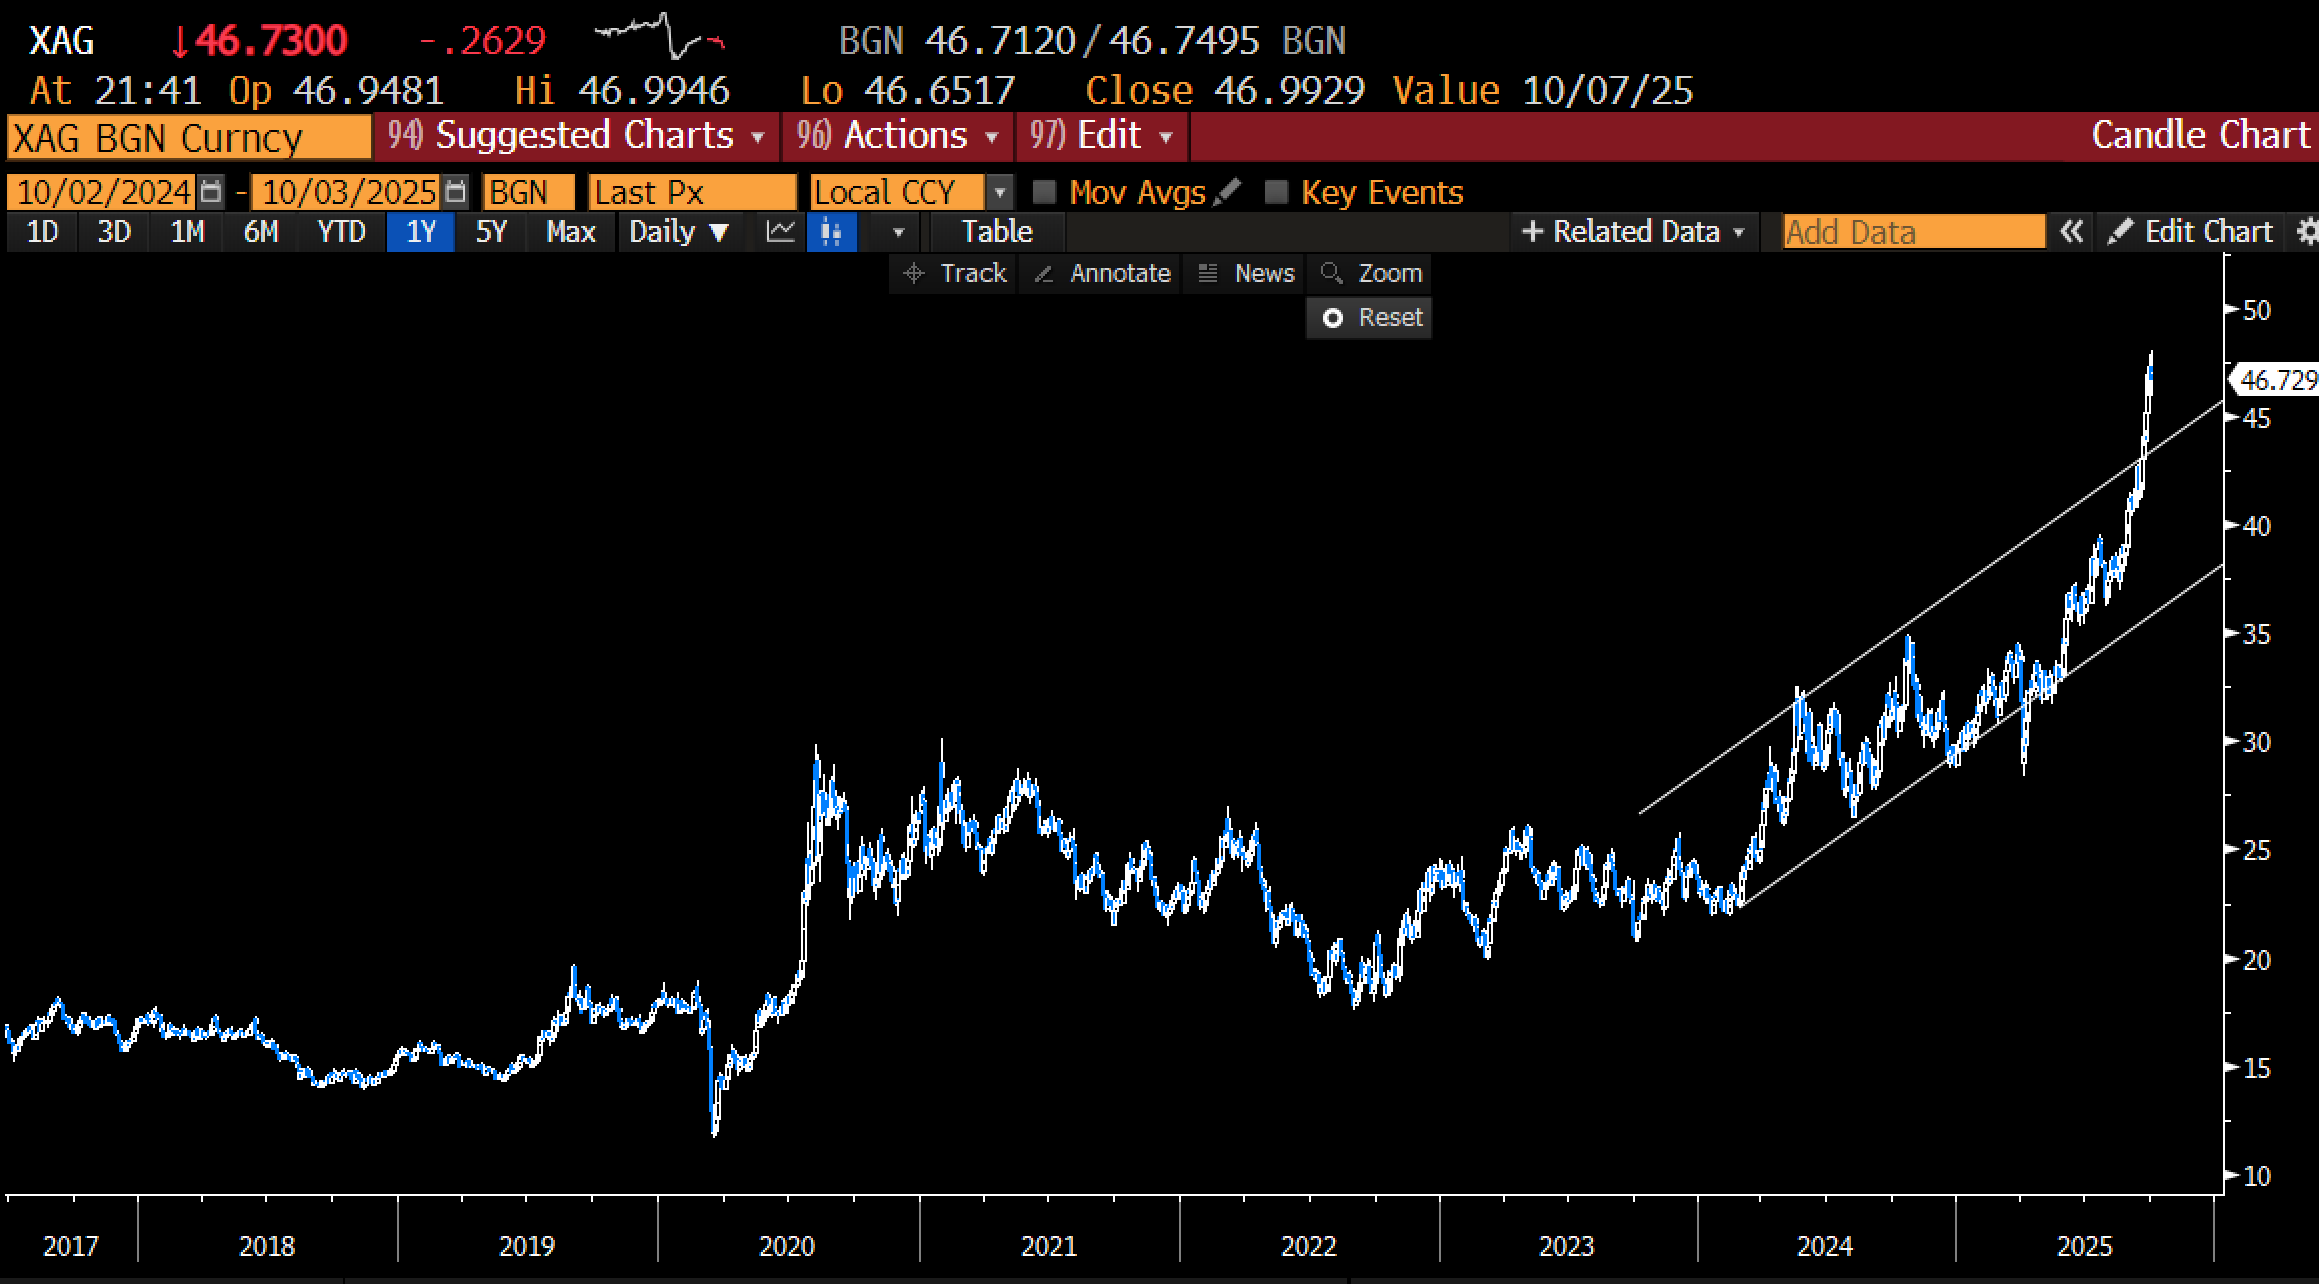
Gold/silver ratio: 80:1 (current)
Historical ratio when silver had monetary demand: 20-40:1
Industrial demand accelerating (solar/AI)
Supply constrained (72% byproduct mining)
Position: Heavy silver, expecting ratio compression to 40:1 as both monetary AND industrial demand surge.
Which brings me to an uncomfortable truth about conviction levels.
What Would Break the Silver Thesis
I’m 95/5 on China gold. I’m more like 70/30 on silver ratio compression. Here’s what could go wrong:
The Scaling Laws Break:
The entire AI → Energy → Solar → Silver chain depends on one assumption: making models smarter requires exponentially more compute and energy.
What if algorithmic breakthroughs (DeepSeek-style) dramatically reduce energy per inference? If intelligence growth decouples from energy demand, data center buildout slows from 30% YoY to 10%. Solar growth continues but not explosively. Silver demand grows but not at 20%+ annually.
The Energy Mix Shifts:
Solar is winning because it’s cheap and scalable. But if nuclear gets fast-tracked (unlikely), natural gas becomes the AI baseload default (more likely) - solar’s share of new capacity could drop from 80% to 40%. Silver demand gets cut in half immediately.
Copper Substitution Arrives Early:
Industry’s been trying for years. Current timeline: 3-5 years out. But what if it’s 12-18 months? If manufacturers prioritize supply chain resilience over marginal efficiency, silver intensity could drop from 15mg/watt to 5mg/watt. At 940 GW/year, that’s the difference between 450M oz demand and 150M oz.
The Recycling Flywheel Spins Up:
Right now recycling is ~15% of supply. But at $50+ silver, economics shift. 25-year-old panels start coming offline at scale (hundreds of GW installed 2000-2010). If recycling doubles to 30% of supply over 2-3 years, that’s an extra 250M oz hitting the market annually.
Position sizing reflects this uncertainty. That’s why I’m taking profits at $50, and rotating to options.
The gold thesis is about revealed preferences over 10 years. Extremely high confidence.
The silver thesis is about forward projections on AI scaling and solar buildout. Much more speculative.
That’s why conviction is 95/5 on gold, 70/30 on silver ratio compression.
Current Positioning: Managing Conviction Dynamically
October 2025 update:
Last month: 80% silver, 40% gold (110% levered)
This week: Sold 33% of precious metals as silver approached $50
Rotated into options for convexity
Waiting for consolidation at $50 resistance
Plan to reload when easing confirmation comes (Q4/Q1)
Why sell if conviction is 95/5?
Because conviction operates on multiple timeframes:
Long-term thesis (3-5 years): 95/5 confidence, unchanged
China keeps printing → Gold/silver rally continues
(Not to mention US deficit, which is another post…)
Medium-term (6-12 months): High conviction
AI build continues, silver into solar
Silver ratio compression 80:1 → 40:1
Short-term tactical (weeks): Taking profits
$50 is real technical resistance
Rotation to convexity (options > spot at these levels)
Waiting for next dissonance moment (easing confirmation)
High conviction ≠ complacency. It means:
Trust the long-term causal chain
Manage around tactical realities
Rotate into asymmetric structures
Stay patient for reload opportunities
This is the opposite of LTCM (kept adding as it went against them). I’m taking profits as thesis validates, rotating to convexity, waiting for the next high-dissonance entry.
Zooming out, here’s what ten years of tracking dissonance looks like in practice:
The Framework in Action
Looking back at ten years:
2015: Dissonance = Zero (no position yet)
2017: Dissonance rising (they’re printing, gold lagging)
2019: High dissonance (PBOC buying, gold/silver ratio 85:1)
2021: Maximum dissonance (Evergrande extending, metals not reflecting crisis)
2024-2025: Dissonance narrowing (price catching up to fundamentals)
Current: Taking profits as dissonance narrows, waiting for next divergence
This is conviction through cognitive dissonance:
Not about being right on price TODAY
About tracking causal linkages vs. price
Sizing into the gap (high dissonance + confirming linkages)
Taking profits as gap closes
Waiting patiently for the next setup
Next: Building The Machine
This process—tracking linkages, measuring dissonance, calibrating conviction—works when you’re a 23-year-old trader staring at screens 10 hours a day.
It breaks when you have clients, other projects, and trade a couple hours per month.
The question: Can we systematize this? Can we build a machine that tracks causal chains, detects when linkages confirm vs. break, measures dissonance between model and market, and knows when to size up vs. cut?
Not curve-fitting on price history. Not a black box that explodes. A system that thinks causally, updates beliefs based on evidence, and calibrates its own confidence.
Till next time.
Post 3: How to build it.
Disclaimers
Definitely inspiring me to level up my process.
joyful to observe your thought process, thanks so much for sharing!