Where are we in the US inflation cycle?
Energy prices have peaked, but inflation remains...
Hi folks, todays' video is 'How to make a bar chart in Rose in 30 seconds' featuring global inflation data.
Headline CPI inflation is well above 5% across the developed world. Greece and Spain at the top is no surprise.
Inflation in the emerging world is running hot, even outside of countries on the brink of hyper-inflation like Venezuela, Argentina, Turkey and Iran.
Note the above is "headline inflation", which includes energy and food prices. Policymakers tend to prefer measures like "core" and "pce" basket indexes of inflation, which generally are less volatile, but lagging, indicators.
Energy and food price inflation are particularly volatile, and exposed to short term demand and supply shocks, but price pressure in both looks to have peaked, and with it, headline inflation.
The deflation in energy and food prices should flow through downward pressure on inflation going forward, barring any further supply or conflict related prices pressures. Knowing this made today's Core CPI report especially painful, as inflation beats expectations yet again.
Meaning, we are now in the tricky part of the economic cycle where:
a) the Fed is still tightening
b) portfolios are hurting
c) inflation has peaked, but
d) inflation remains higher than target, and
e) labor markets remain tight.
Leaving the Fed no wiggle room.
Meanwhile we know that there will be carnage in the housing market from the flow through from tightening. For example, mortgage rates are another 50bps higher than in this post, and home prices have barely moved.
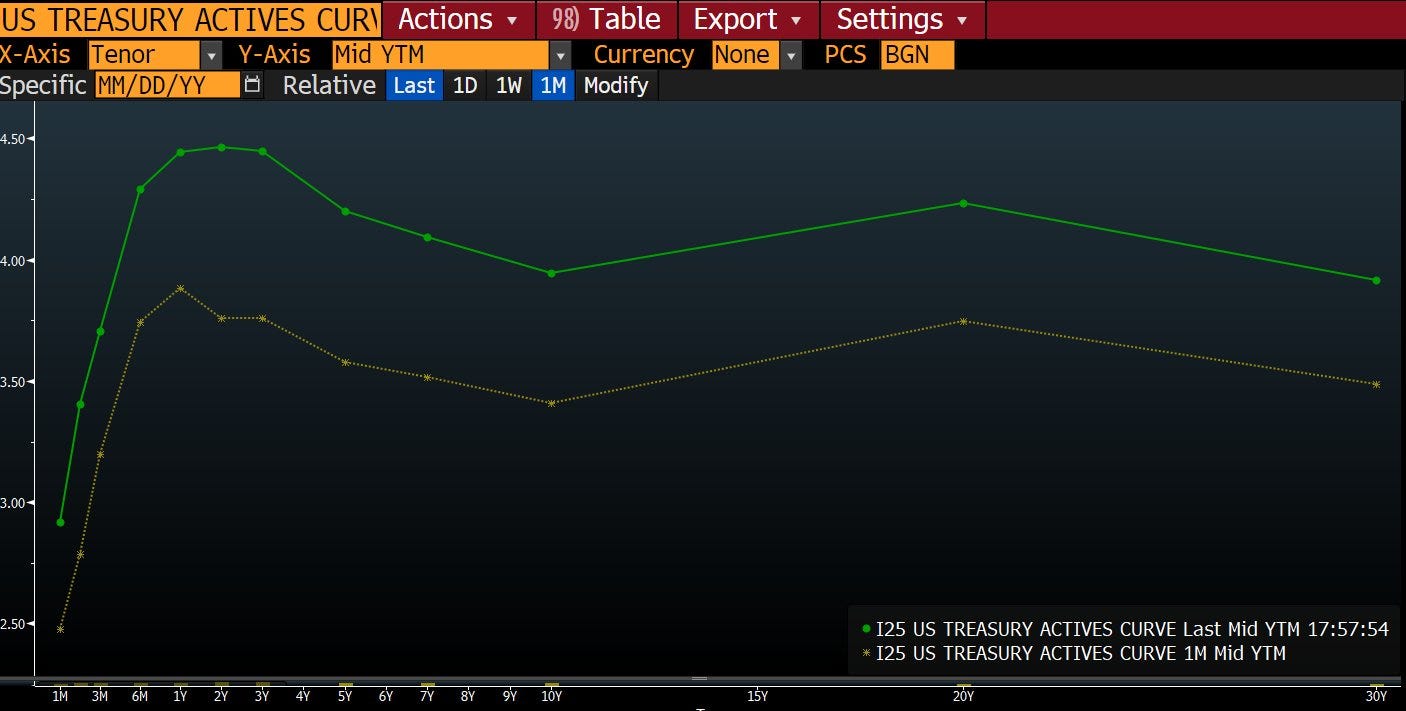
The bond market reflects these mixed signals. Still pricing in 'just another 100bps' before a return to the good old days. Problem is, unless Fed pushes the financial system into crisis, we are still a long way from 2% inflation.
US unemployment below 4% begs the question: how much tightening, and how much financial chaos, is necessary until policymakers (feel) they have bested inflation?
Today's stock rally notwithstanding, our read of inflation and bond markets is 'more to pain to come.'
Note this piece was originally posted earlier this week as a thread on twitter. Follow us there for this kind of work when it comes out.
Disclaimers


