

What the Heck Happened to Gold

Well, that was interesting.
Tuesday we started a piece on gold that turned into “Don’t Take the Bait” but tried to message subscribers that things were looking scary.
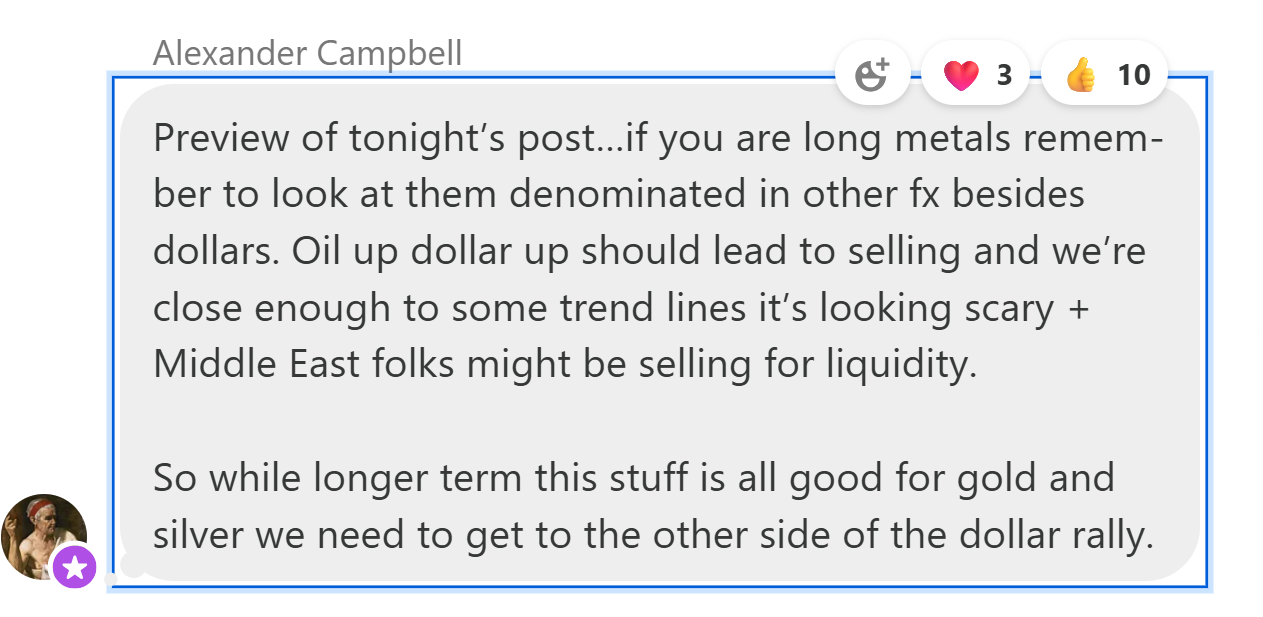
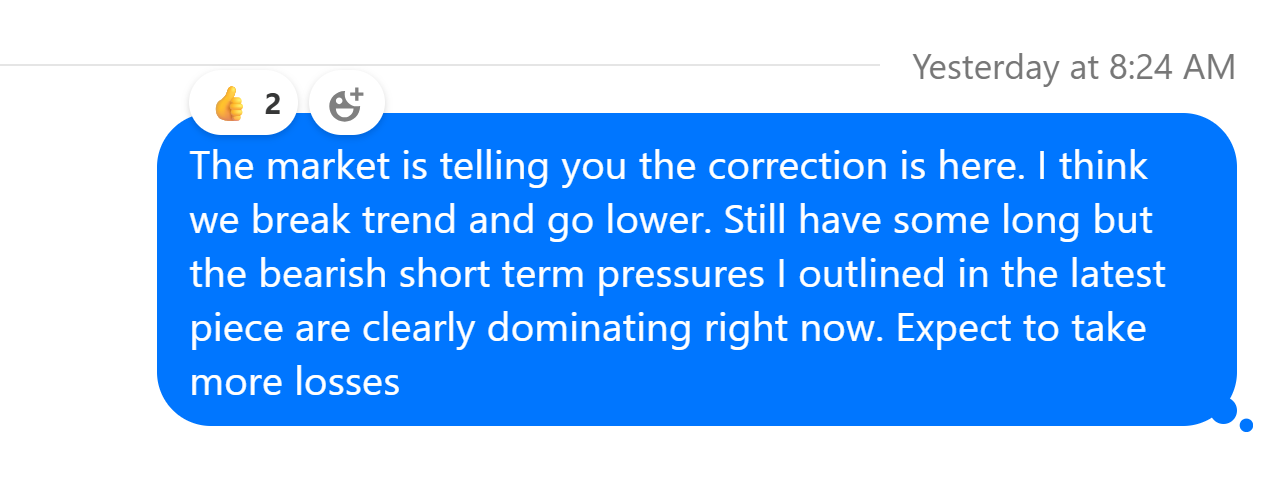
Wednesday we did a bunch of the analytics and though we got distracted by building systems, tried to communicate to folks that yes, the correction was here.
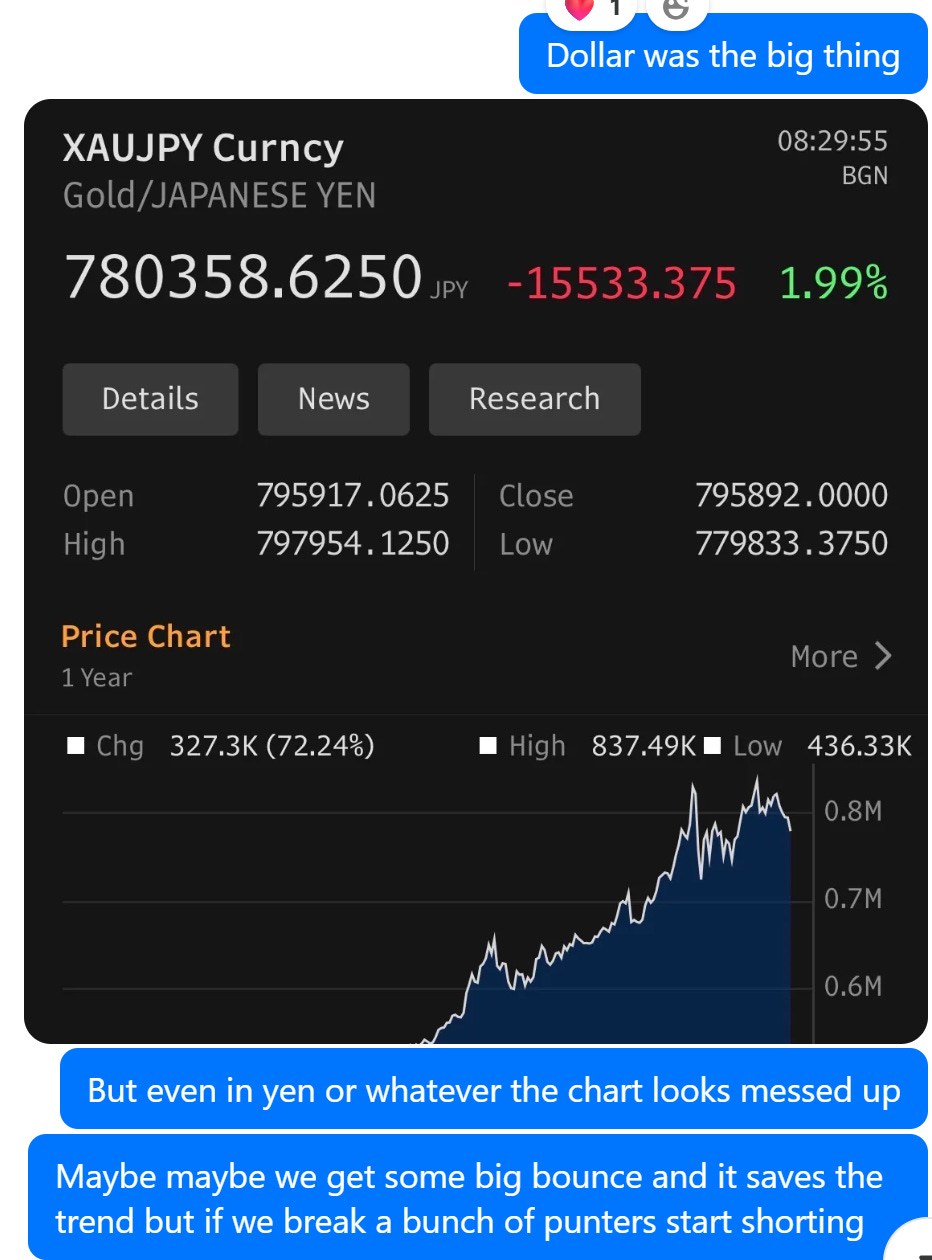
But that even in yen, the market looked heavy.
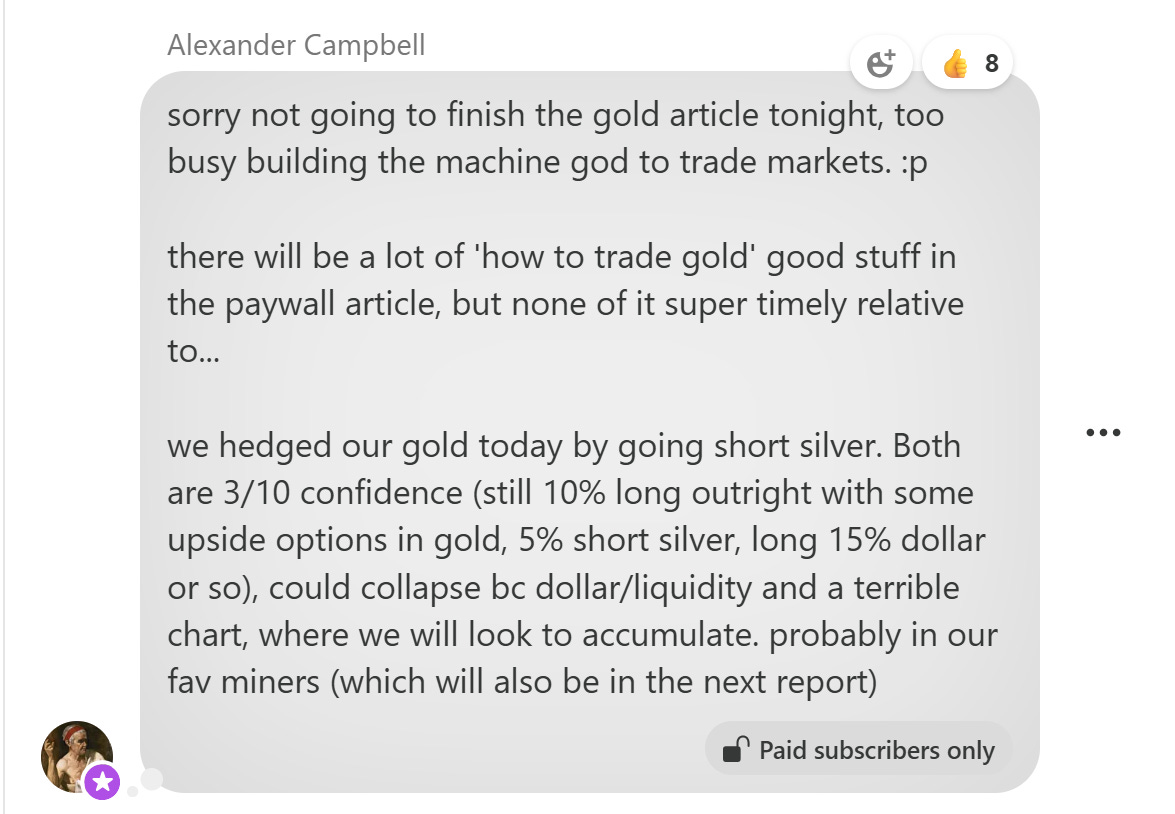
Then concluded the day by letting people know we sold some silver against the gold as a way of hedging what looked to be a relatively scary downside.
Which is by no means a way of saying “I told you so”, since I didn’t and I also took losses today. But rather to kind of communicate a) the notion of how fast things are evolving at the moment, and b) provide a bit of transparency on why, towards the end of the day, I took my own advice and cut 80% of the book.
We’re still up on the year, but after paying ~1%+ to get out of some of our less liquid stuff, it comes to a tad over 3%. Which seems fine when you annualize it (up 12% on a 40 vol book isn’t a great year, but also isn’t terrible), but feels painful when we ended January up 14.5% and February up 9.5%. “Drawdowns are gonna happen.”
The primary reason for cutting the book wasn’t so much the drawdown (I actually think it likely that a lot of our miners and AI names will bounce tomorrow and in the coming days) as it became clear to me that I had accumulated way too much drift/bloat over the past couple of months in the good times. Managing a diversified basket of themes with ~200 names is doable when you have risk systems and stare at it all day, it’s a recipe for chaos when you are trading in the parking lot, in between meetings or on the road, with no service.
So, I made three decisions. Time to pare it down. Time to invest in some risk systems. And then, perhaps most importantly for you guys, time to build it back up in a way where I’m not just telling you what I’m doing but kinda teaching how I do it. To get to the point where not only do I feel comfortable with the risk I’m running but take you guys along on the journey of how it’s constructed.
With that in mind, and given the move in the shiny metals today, I figured I’d start where it all began. We’re going to talk about gold. Specifically:
What are the bearish things playing out today (free)
What are the bullish things playing out with gold today
How you might net those as a discretionary trader
Then over the coming weeks, we’re going to extend this into a whole series on how to actually systemize this stuff:
What data you can use as inputs
How to clean, model and transform that data
How you might net that data into what a quant might call a ‘signal’
How to use that signal in the construction of a portfolio
(Side quest) How to lever that understanding from the underlying commodity to the equities that relate to it (in this case miners)
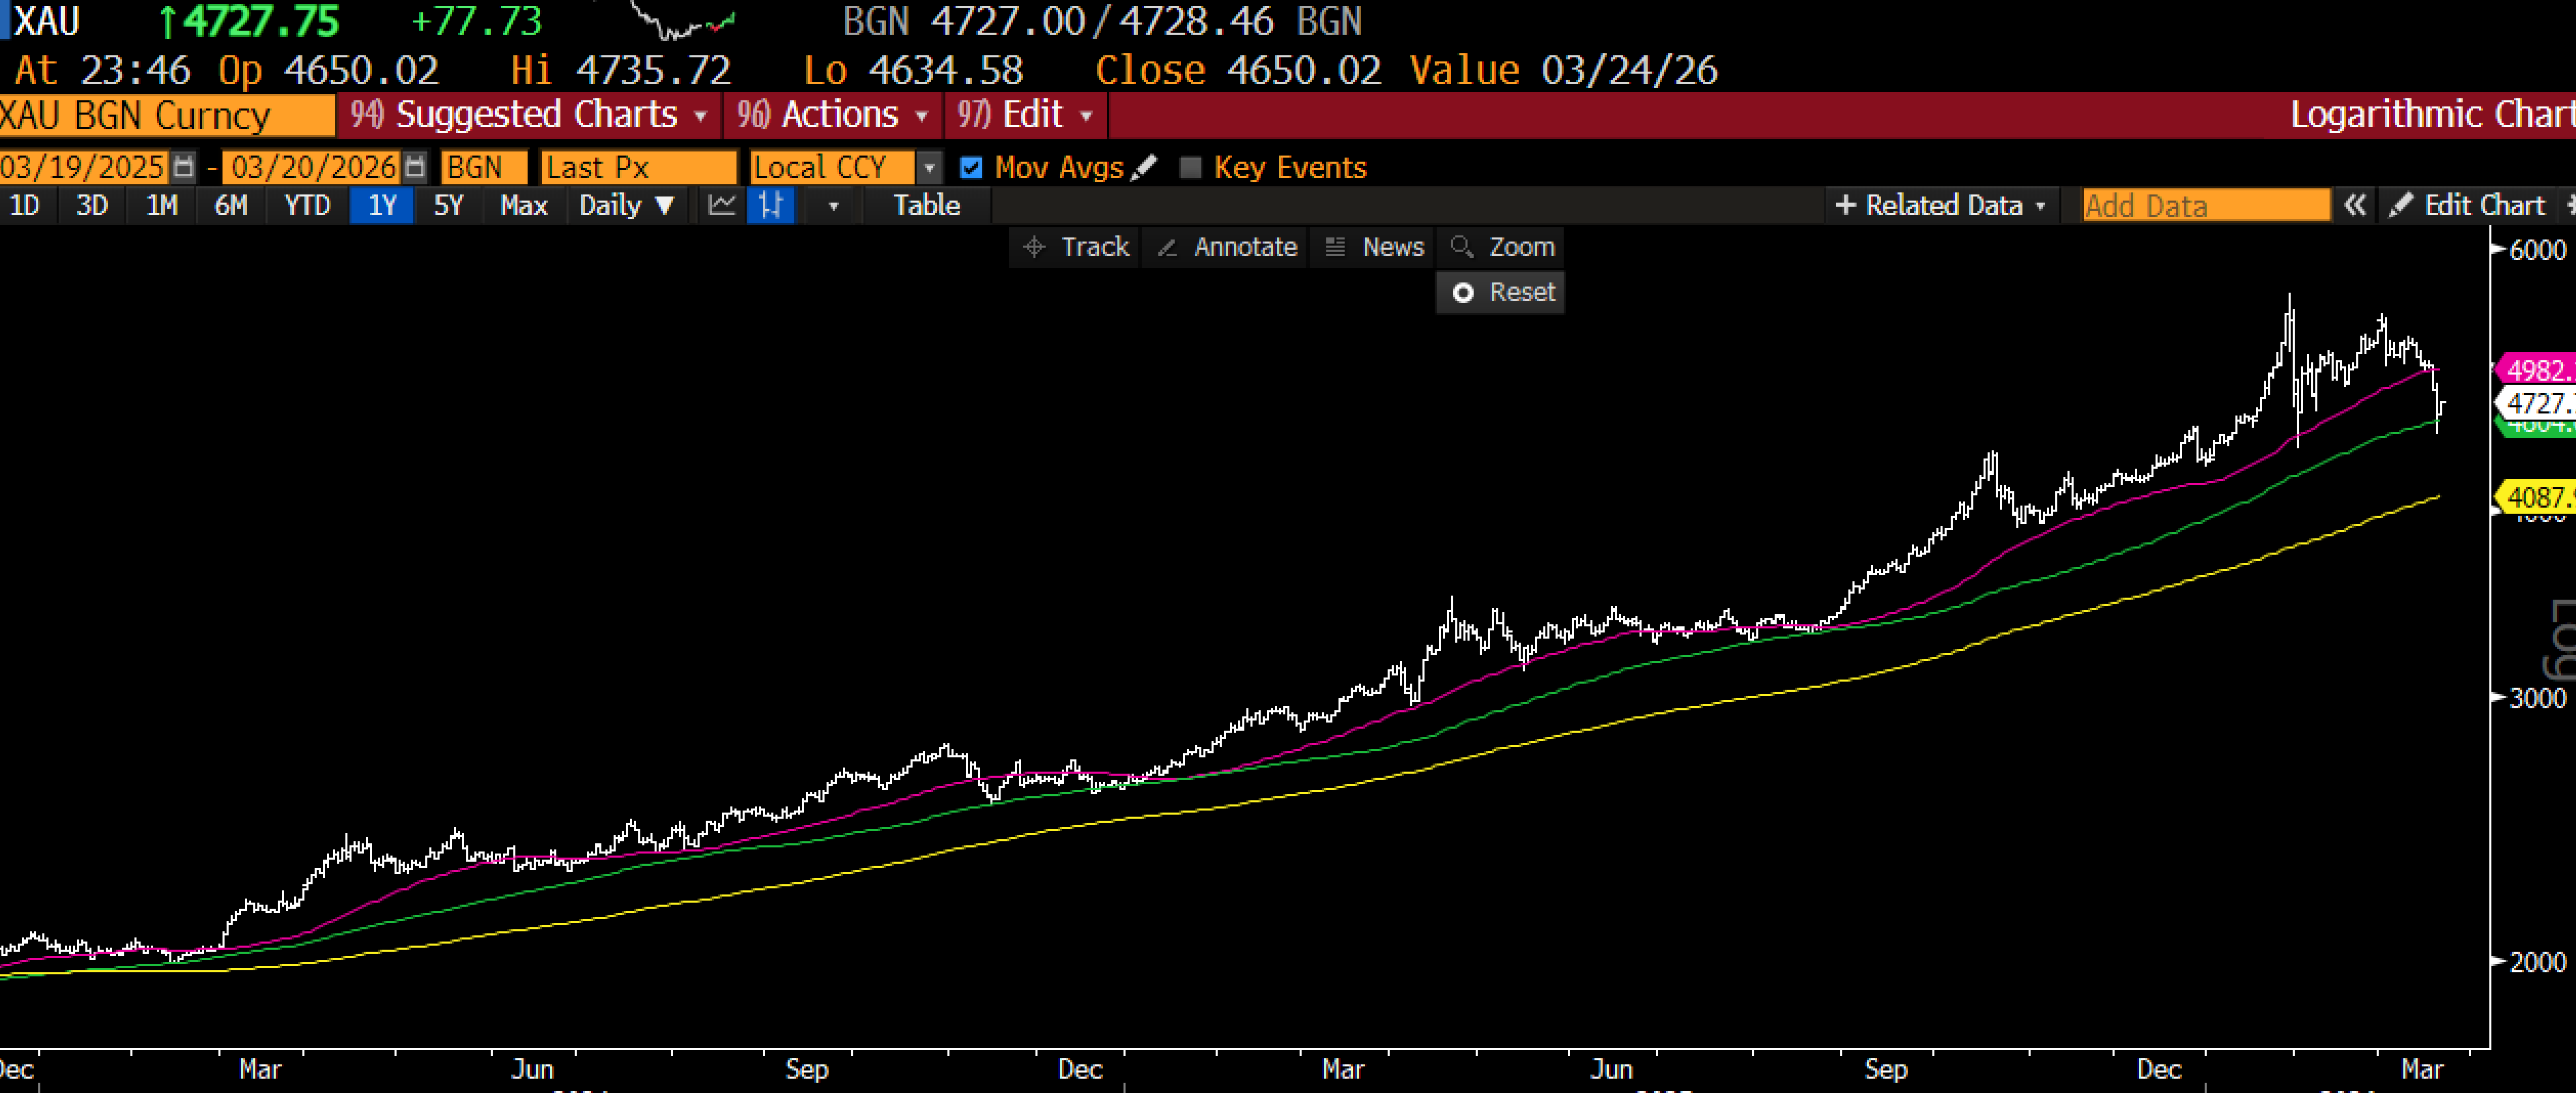
Why Did Gold Puke Today?
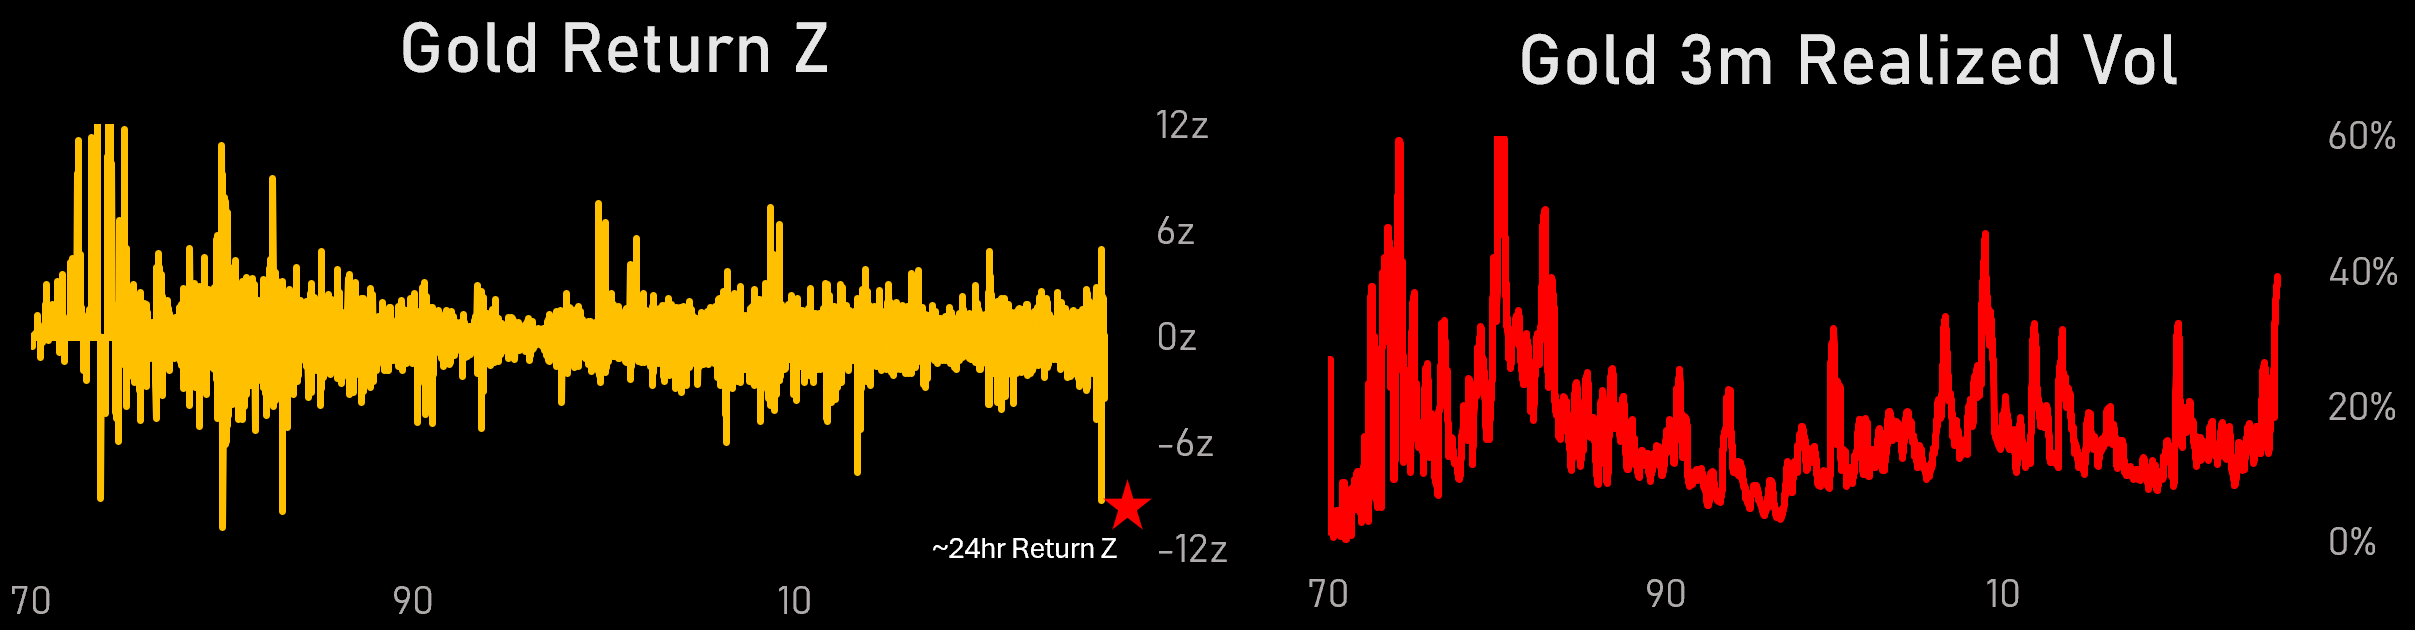
To review, in the 24 hrs between yesterday’s open and today’s gold fell around 10%.
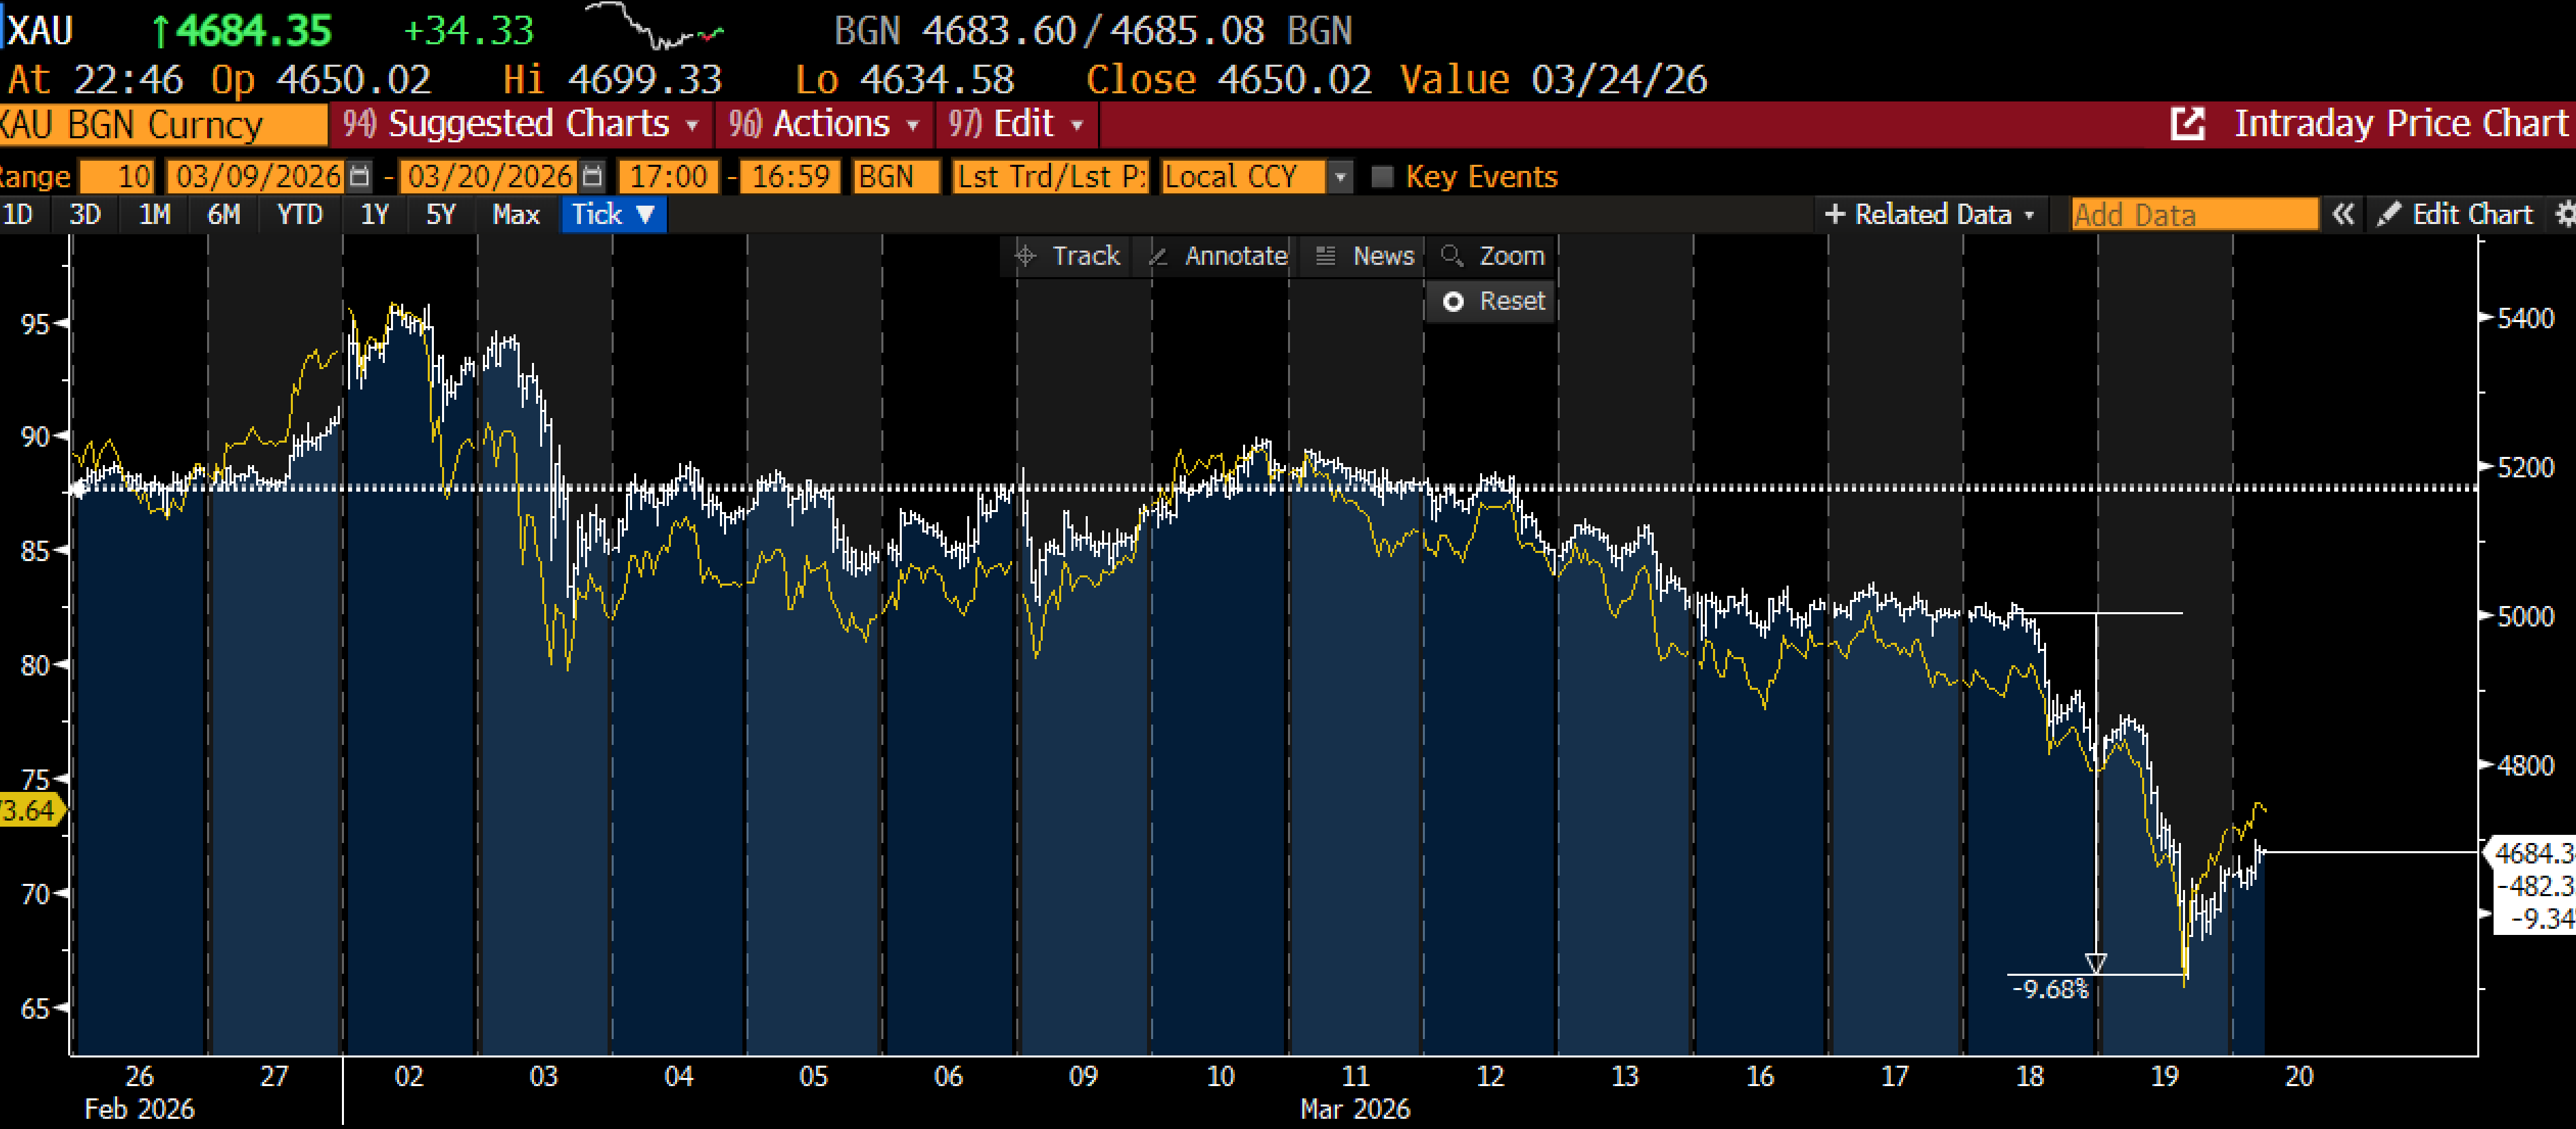
To put that in historical context, that’s another -10z score in 2 months. Remember that next time someone tells you the odds of something happening.
When you see something falling 10z you kind of need a good reason, so the below list may feel uncomfortable, but not many of them were also in play during the January 30 “Warsh puke”:
Dollar Strength
Higher Rates
Scramble for Liquidity
Lack of Middle Eastern / Asian Buyers
Ugly Chart (aka ‘technicals’) & Reversion of Speculative Flows
Let’s go through them in order.
1. Dollar Strength
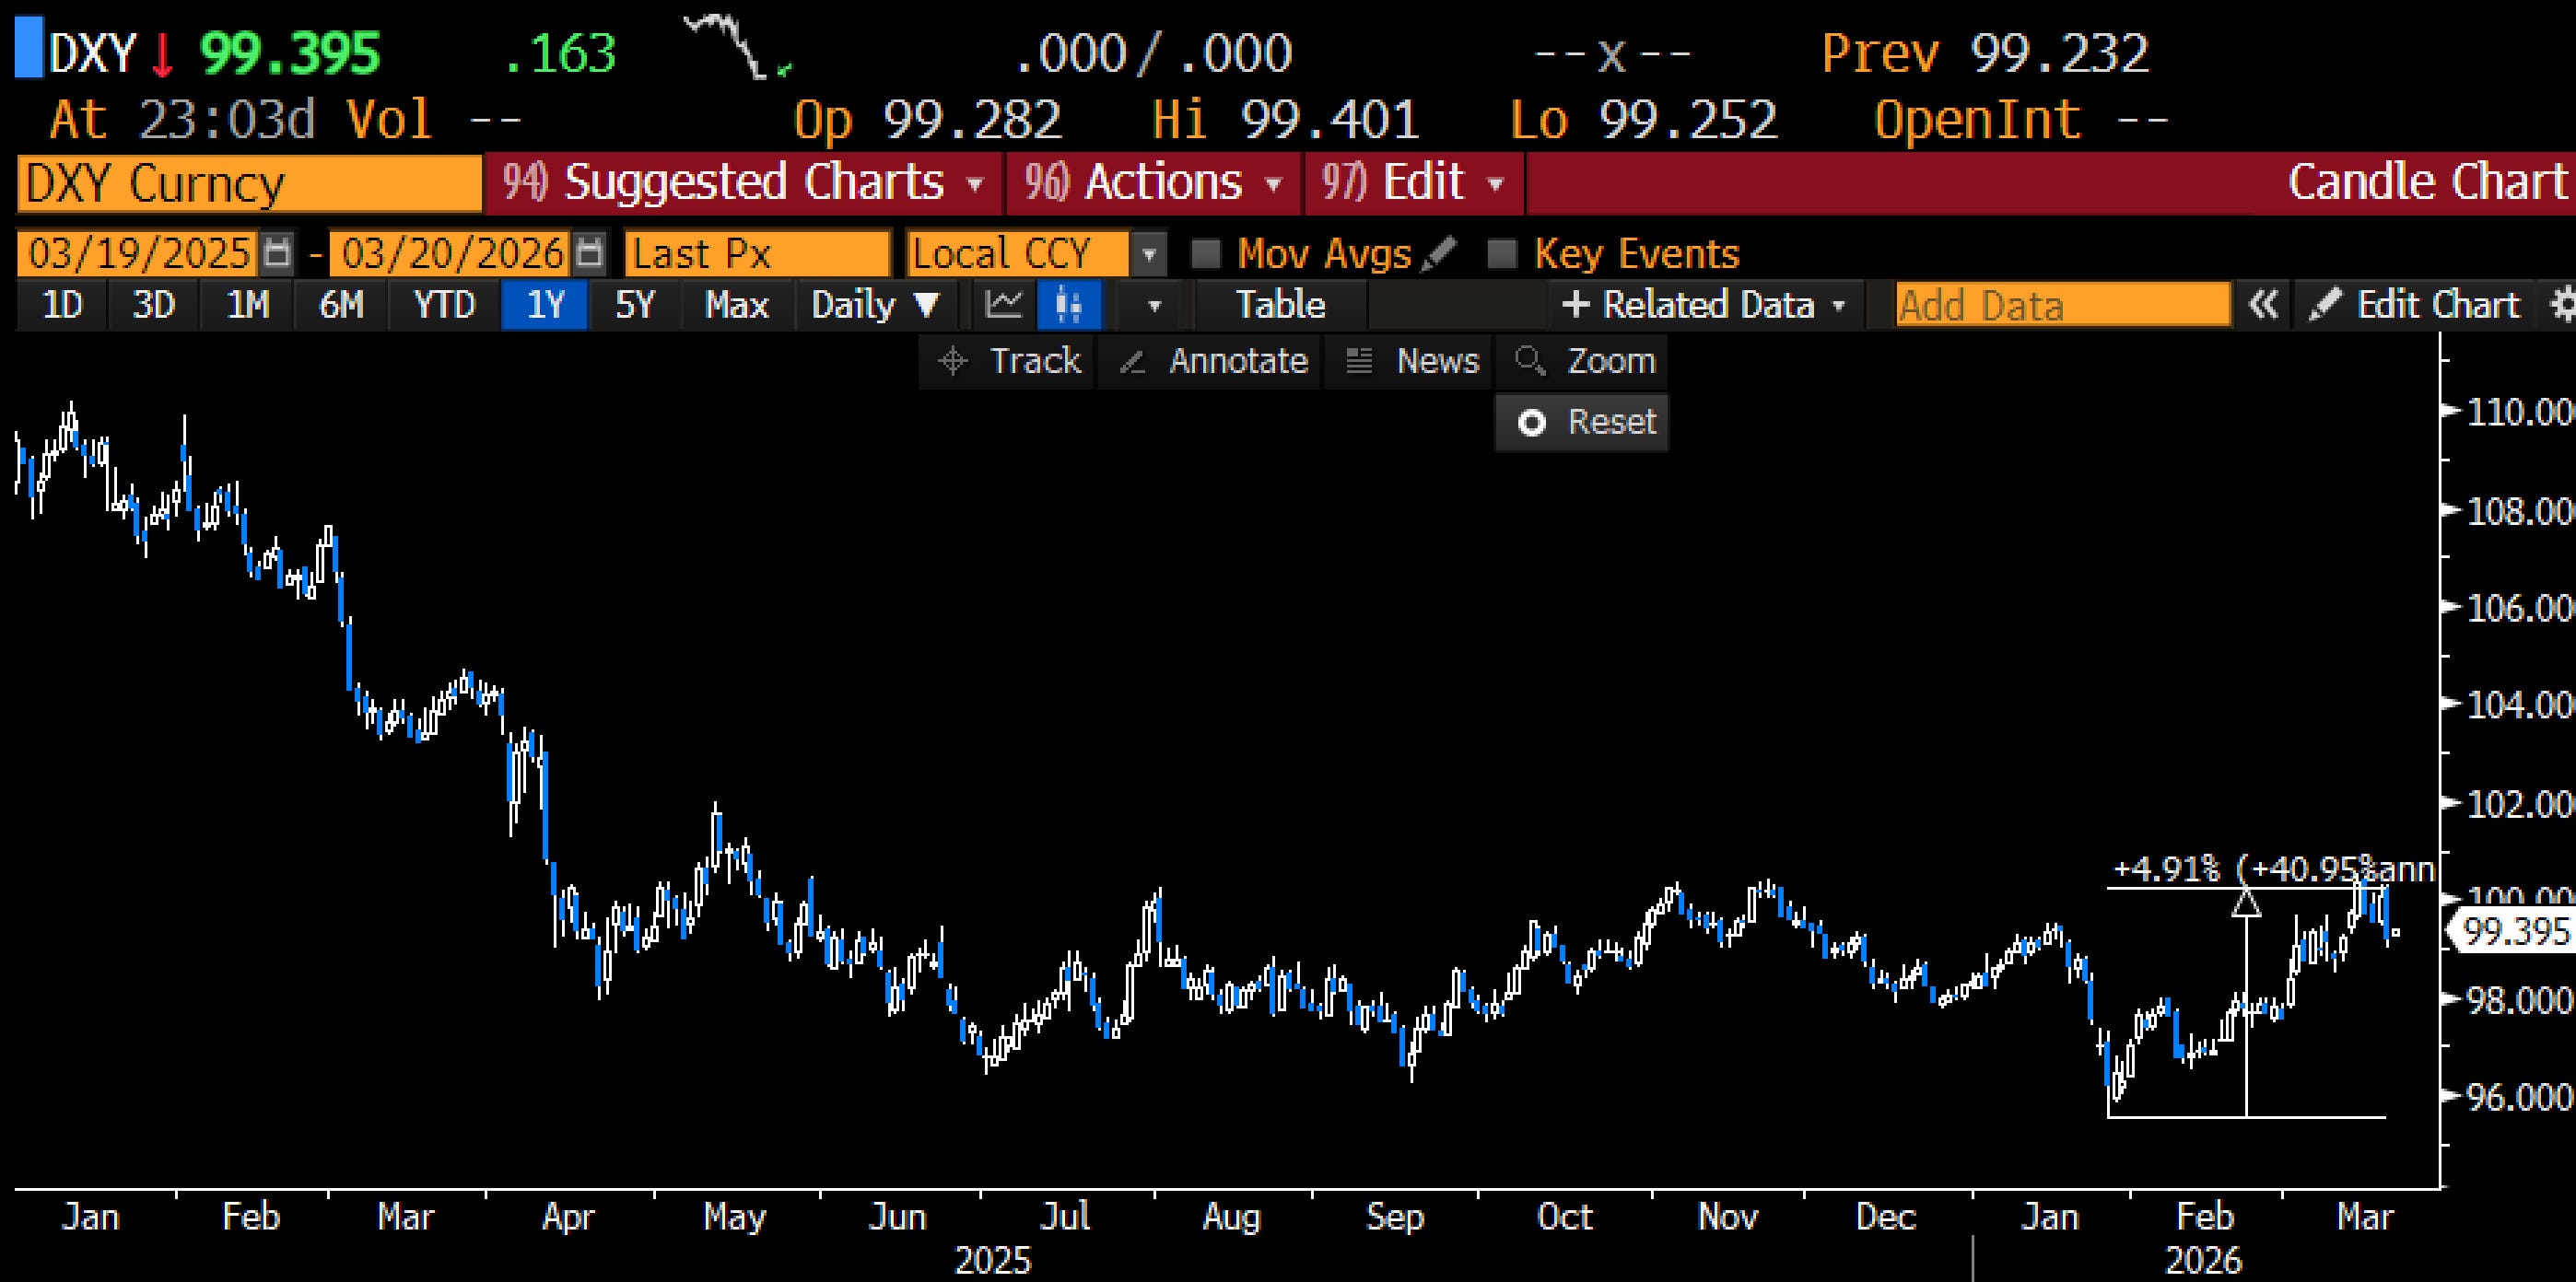
The dollar is ripping. DXY back near 100, up almost 5% annualized off the lows. When oil spikes, dollars get scarce globally because everyone needs them to buy energy. This is the same mechanical dollar strength we saw in 2008, 2020, and mid-2022, and every time it happens gold gets hit first because it’s the most liquid thing people can sell to raise cash.
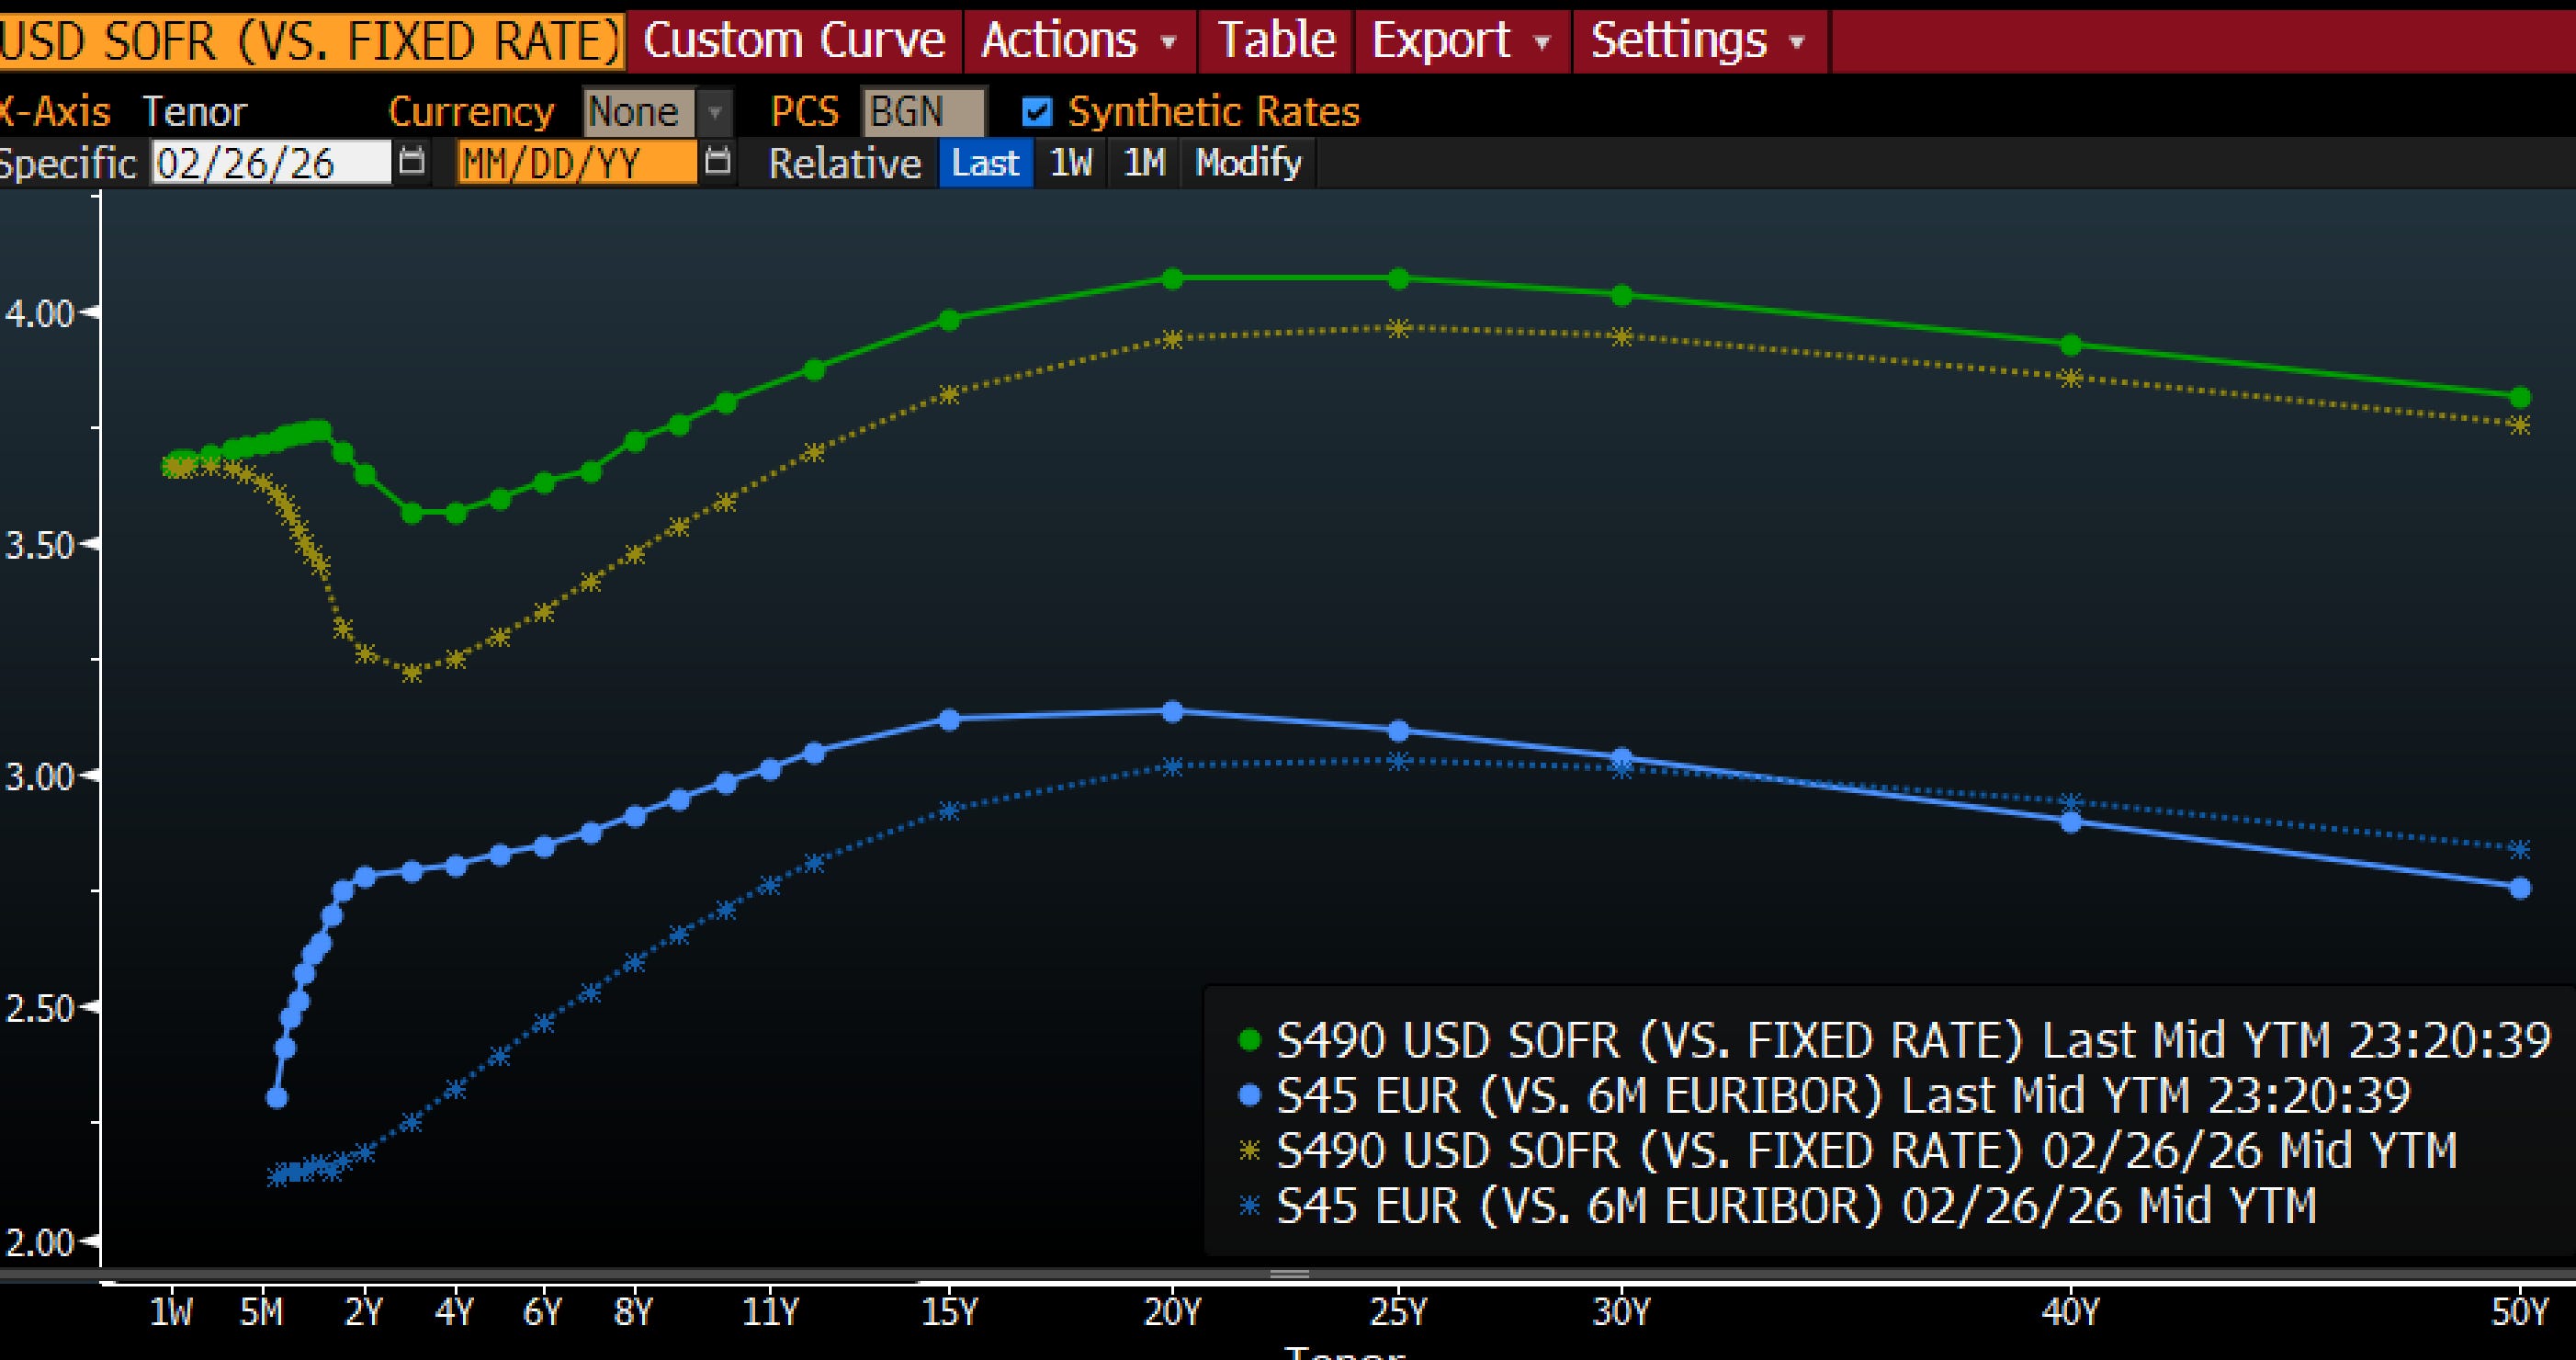
2. Higher Rates
Higher rates weren’t just expected, but for the first time in the oil crisis, they gapped up. When the market opened this morning, US 2 year rates were 60 basis points higher than they were at the end of last month.
This wasn’t just a US story. European rates are now pricing in direct hikes, while the US has a weird curve where SOFR trends up for the next 6 months and then we get another cutting cycle. This is the interest rate curve’s way of telling you how painful this shift in monetary policy is.
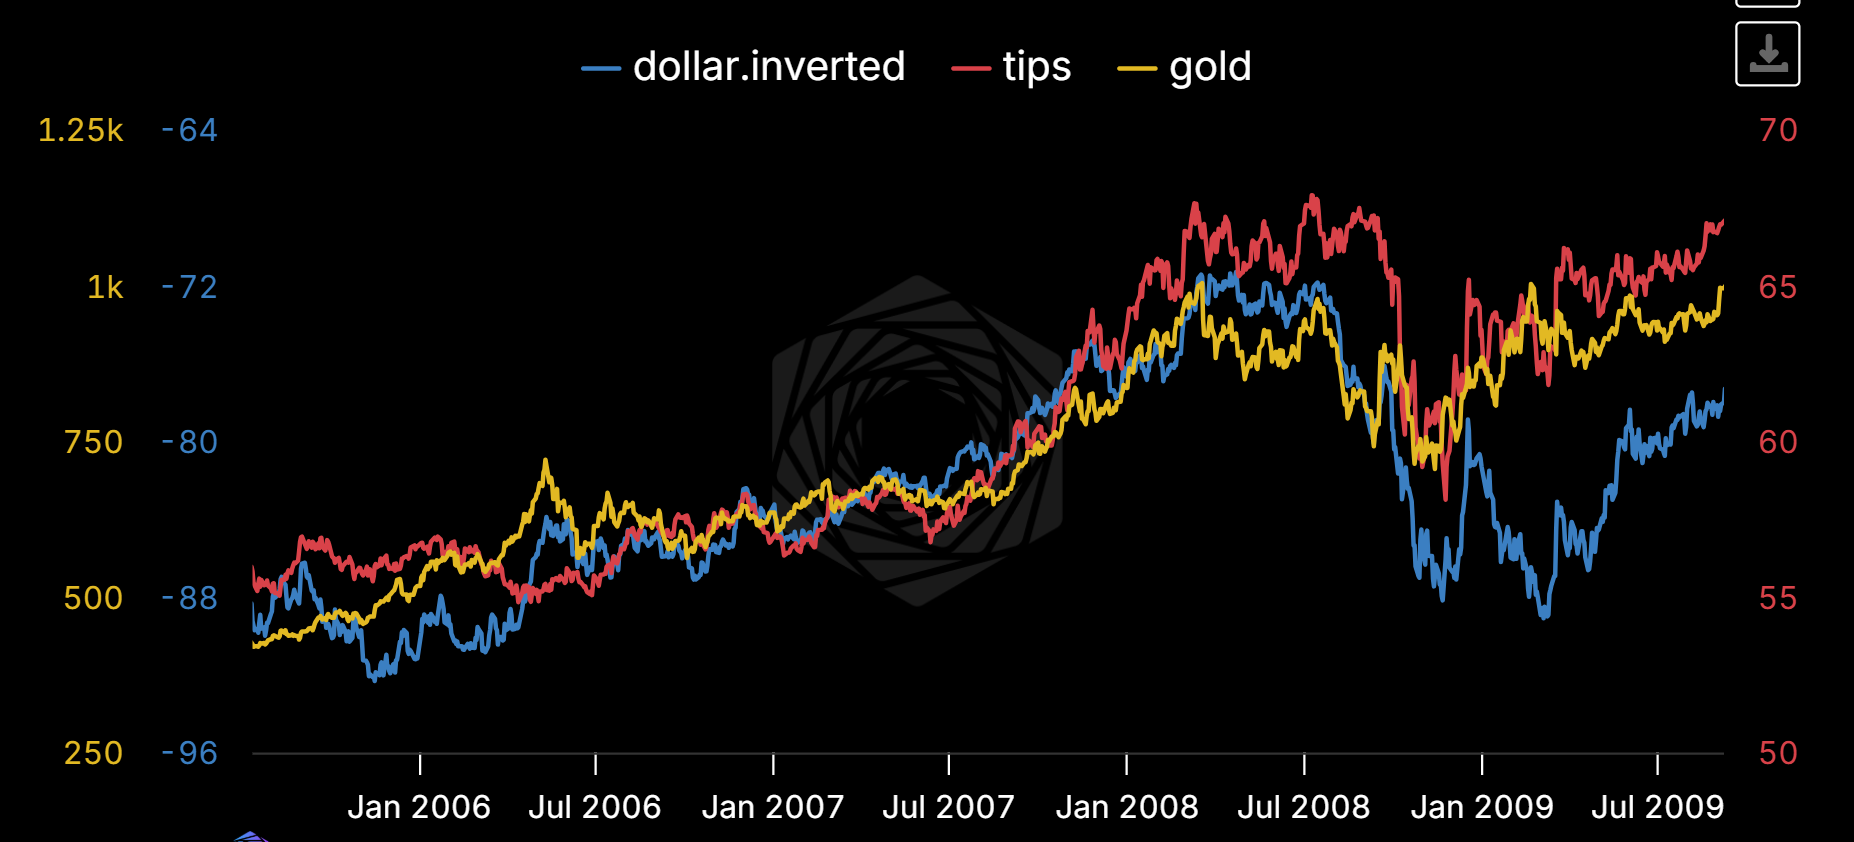
If you recall, most other periods of sustained gold weakness came in moments where the dollar was strong and real yields were rising. Like 2008:
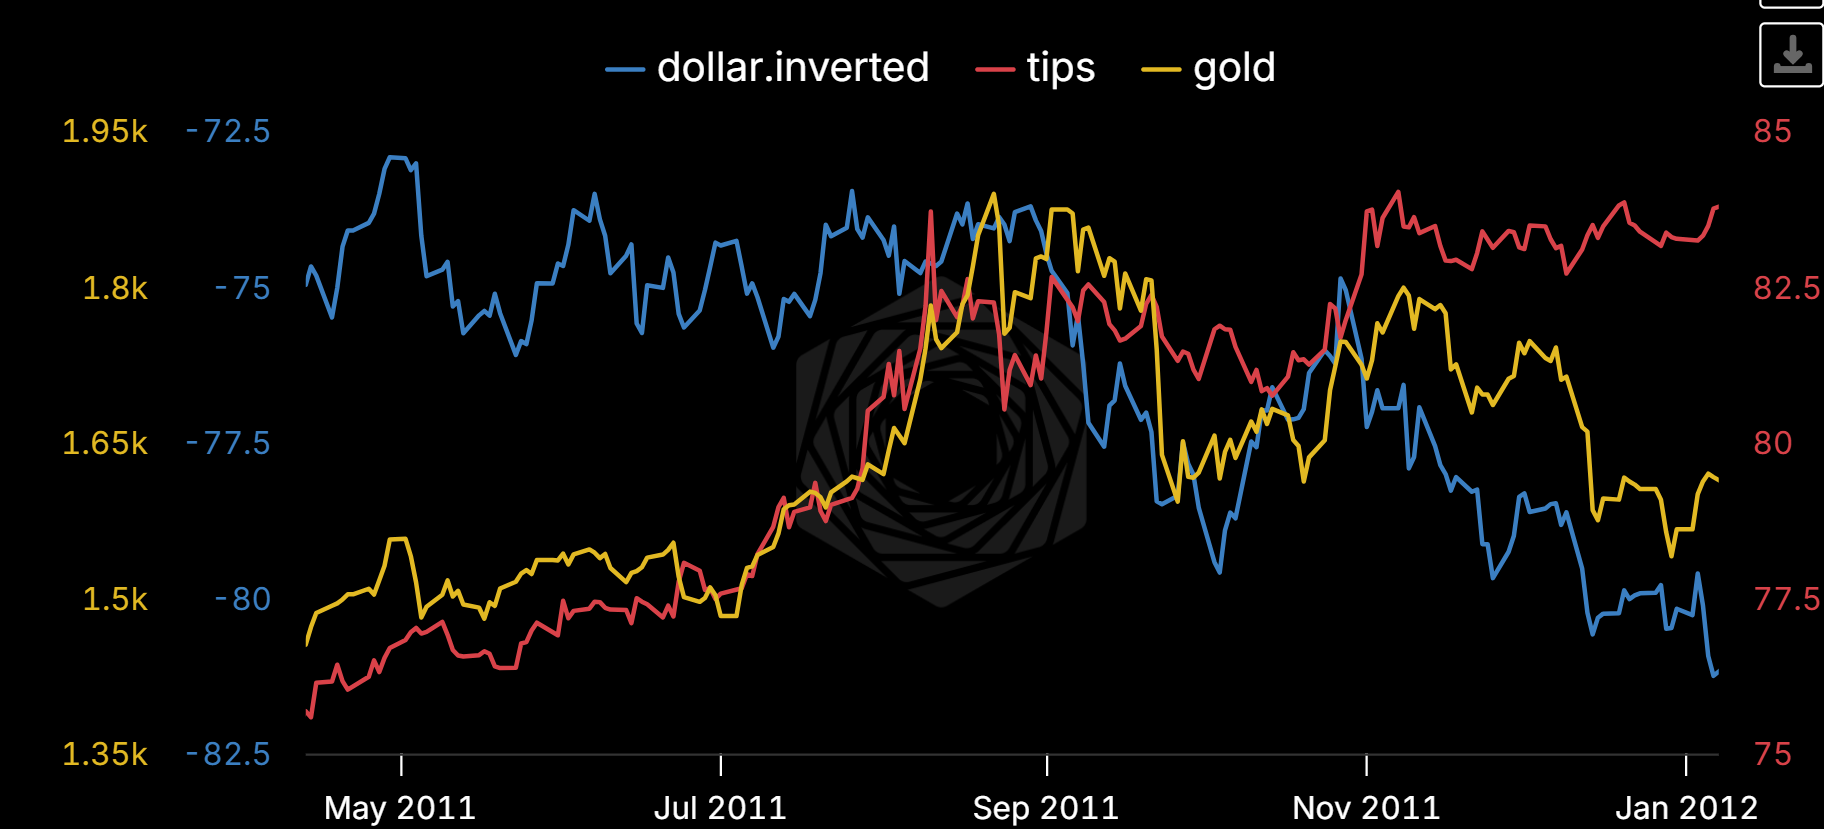
Late 2011:
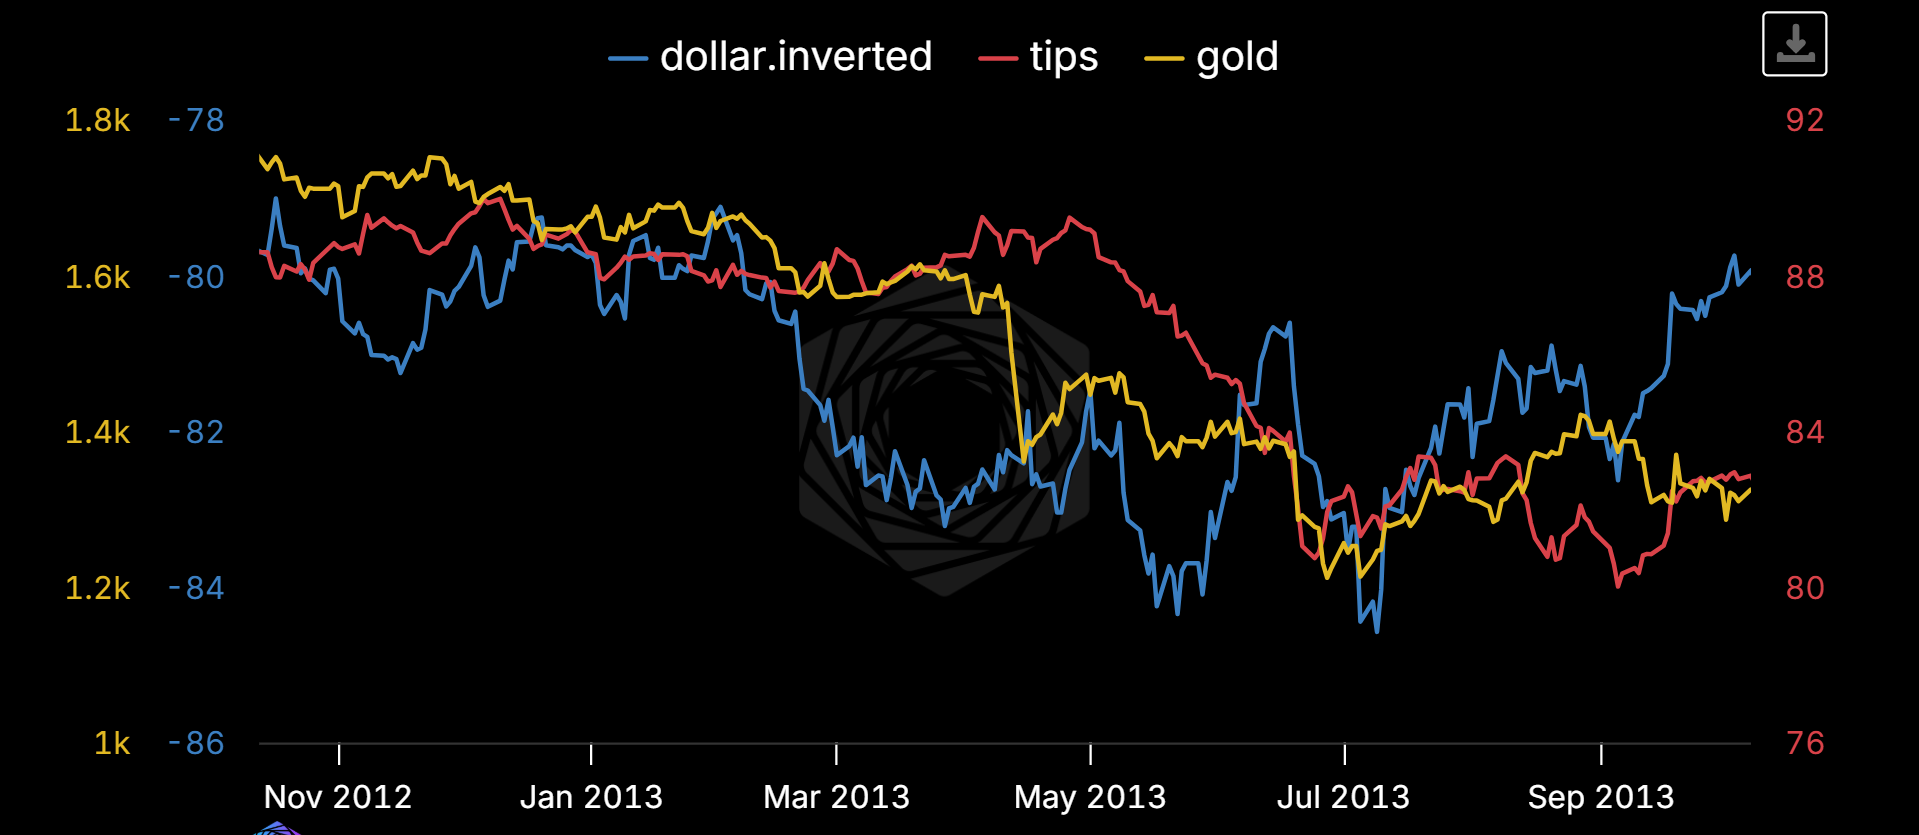
Mid 2013:
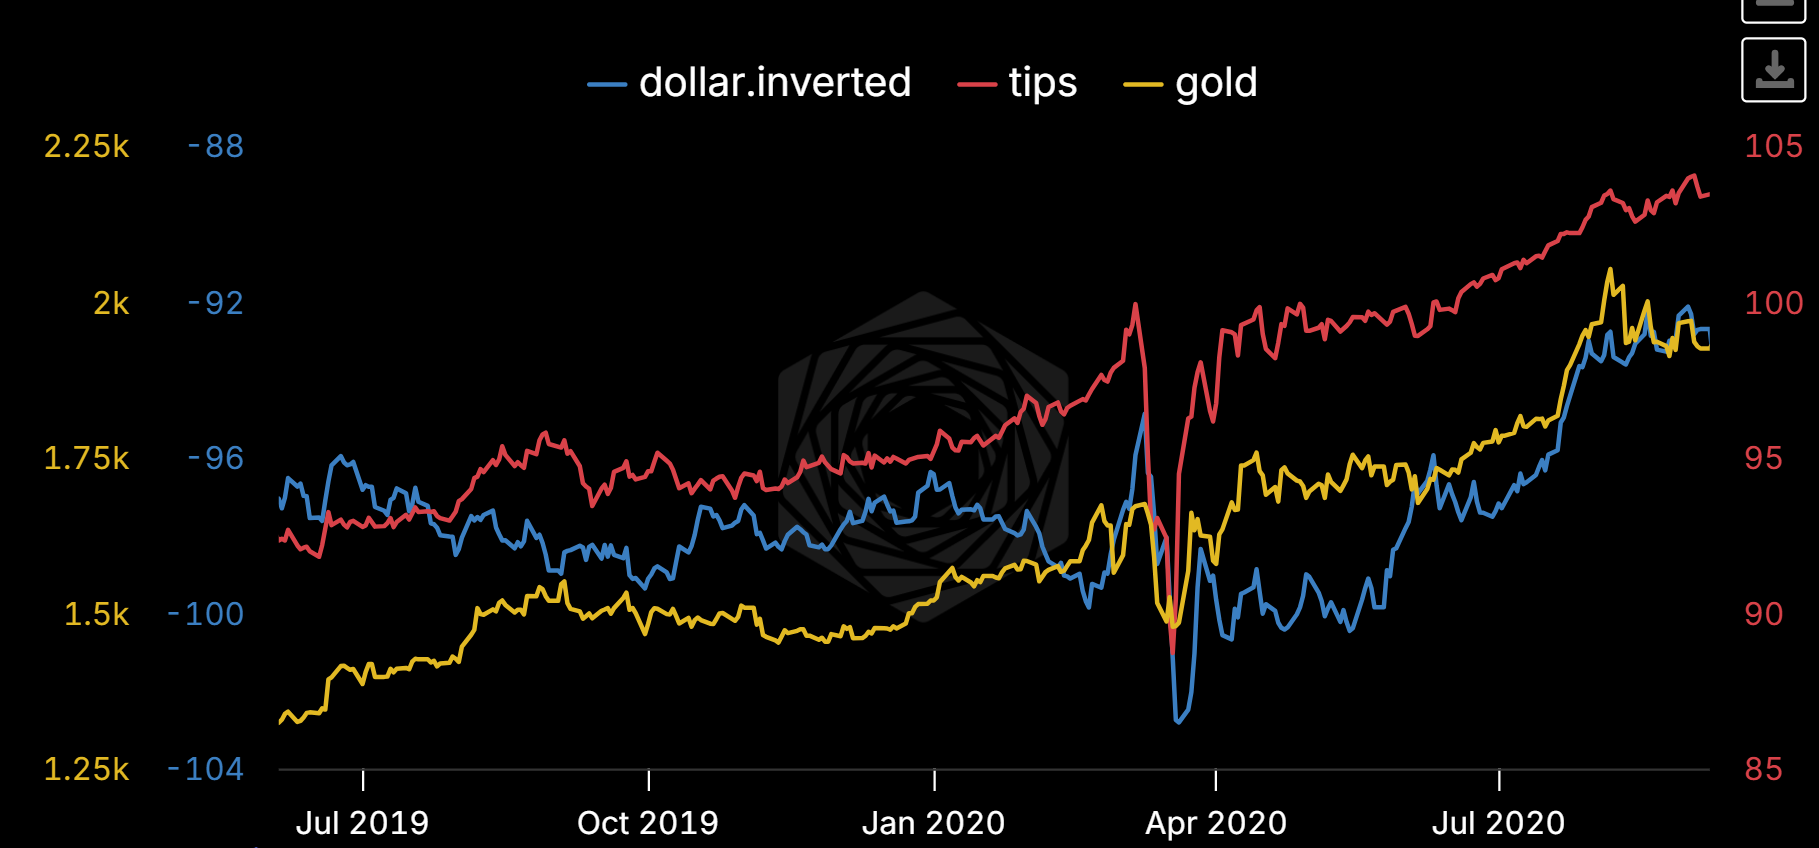
March 2020:
Mid 2022:
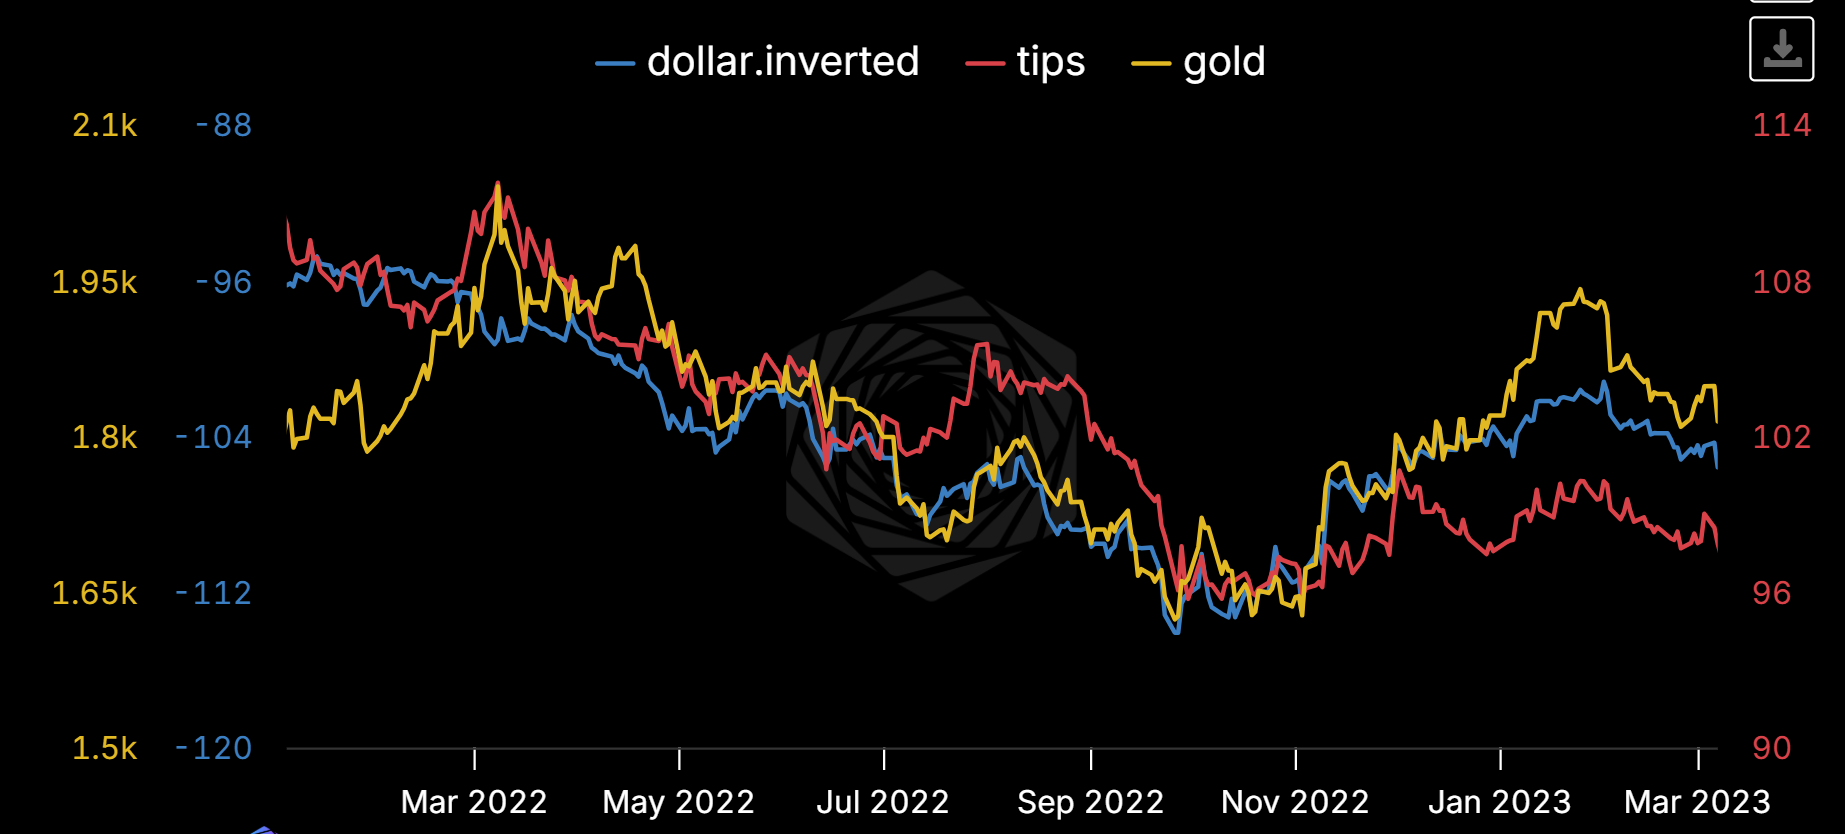
You get the idea. For gold denominated in dollars, tight dollar (and global liquidity) is bad news.
3. Scramble for Liquidity
So who might be scrambling for liquidity right now?
Well, there’s a lot of folks in the Middle East who, coincidentally, are not only having a hard time selling their petroleum, but are finding a lot of the stuff they use to make that equipment on fire.
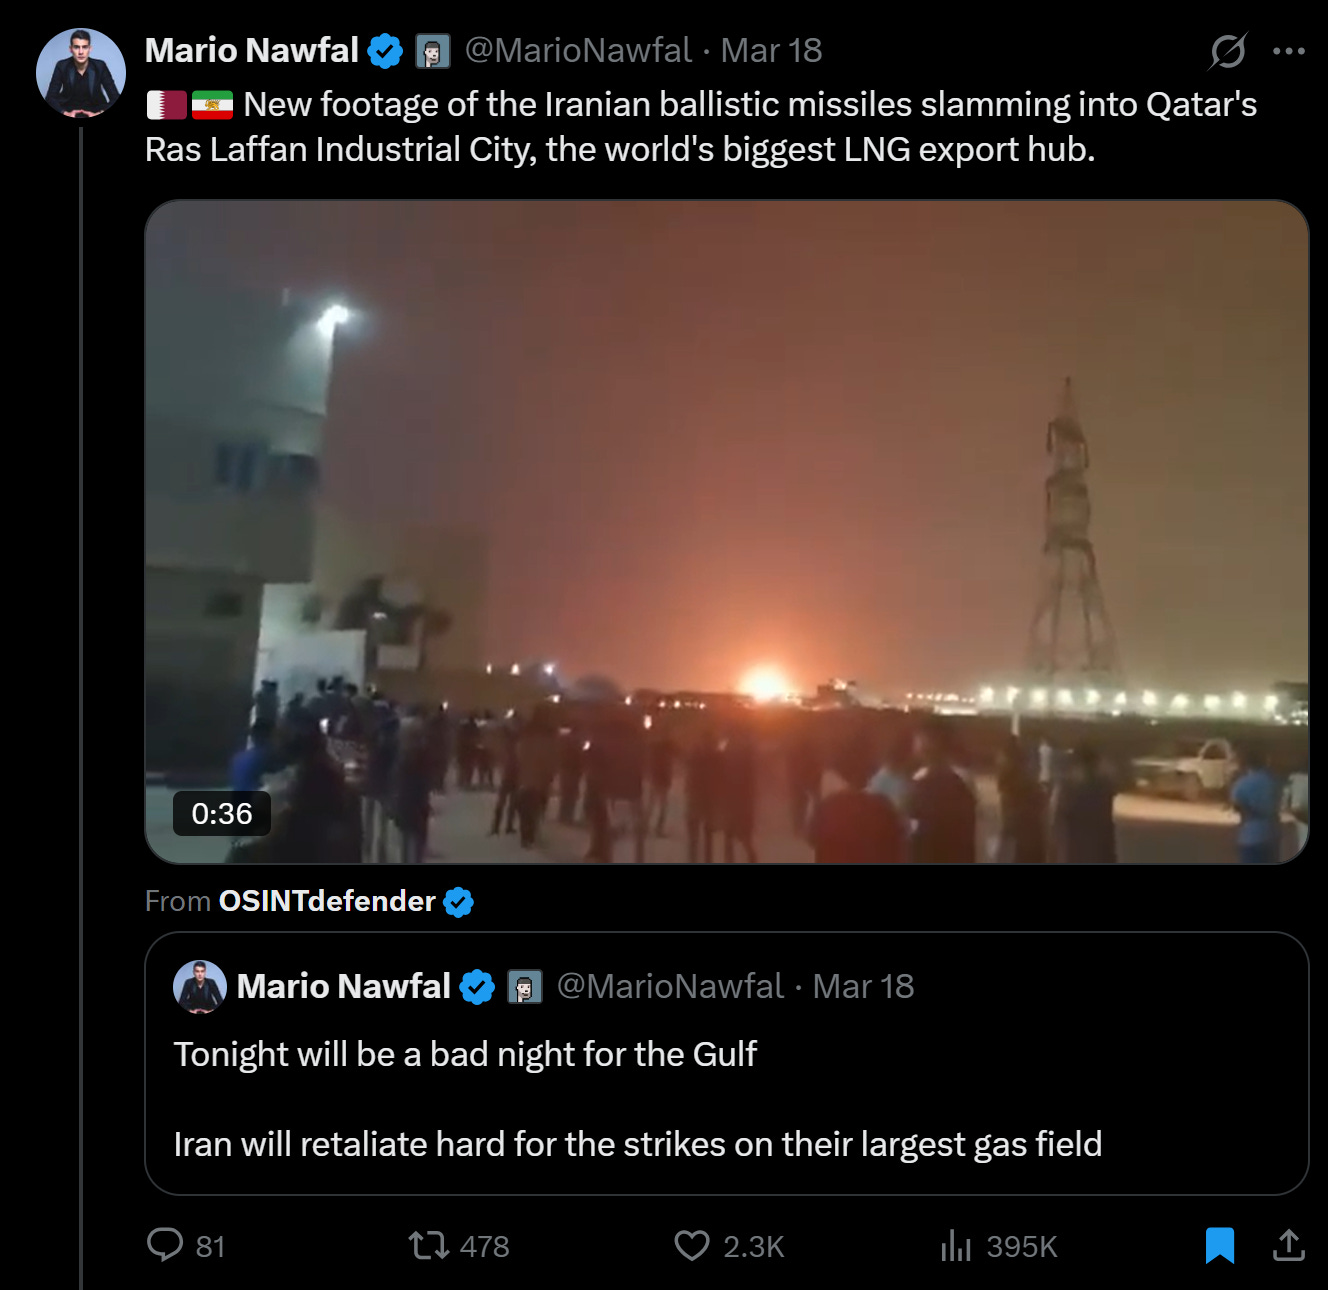
As they say “the pain will continue until I no longer post oil & gas rigs on fire in the blog.” This theory is under debate as we have no official confirmation of private or public flows from Gulf countries.
4. Lack of Middle Eastern / Asian Buyers
What we do know is:
Dubai was serving as the primary hub by which gold went from London sellers to Indian and other Asian buyers. That pipe is broken right now. This isn’t a structural shift in demand, it’s a plumbing problem. But plumbing problems can take months to reroute, and in the meantime the marginal physical buyer can’t get their gold.
Iran was also a decent sized purchaser going into the crisis, running at around 100 tons a year (or close to 3% of total demand).
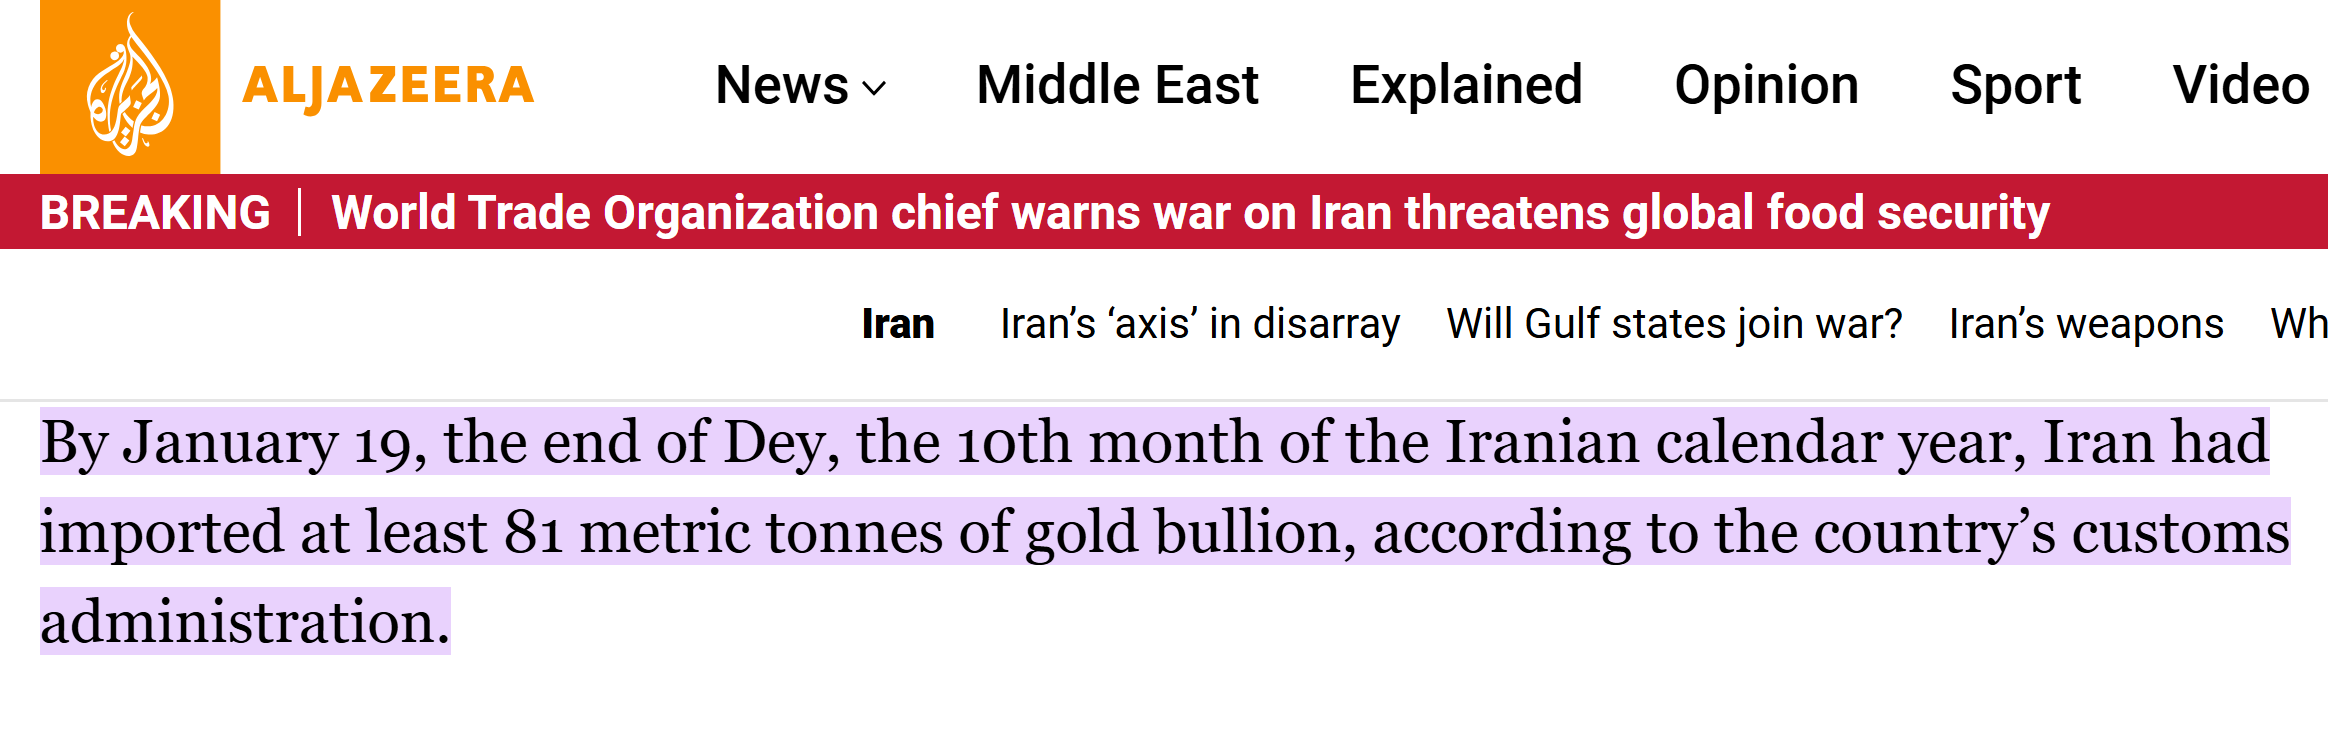
Both of these are war-specific one-offs. They reverse when Hormuz reopens. But right now they’re real, and they’re removing a meaningful chunk of physical demand from the market.
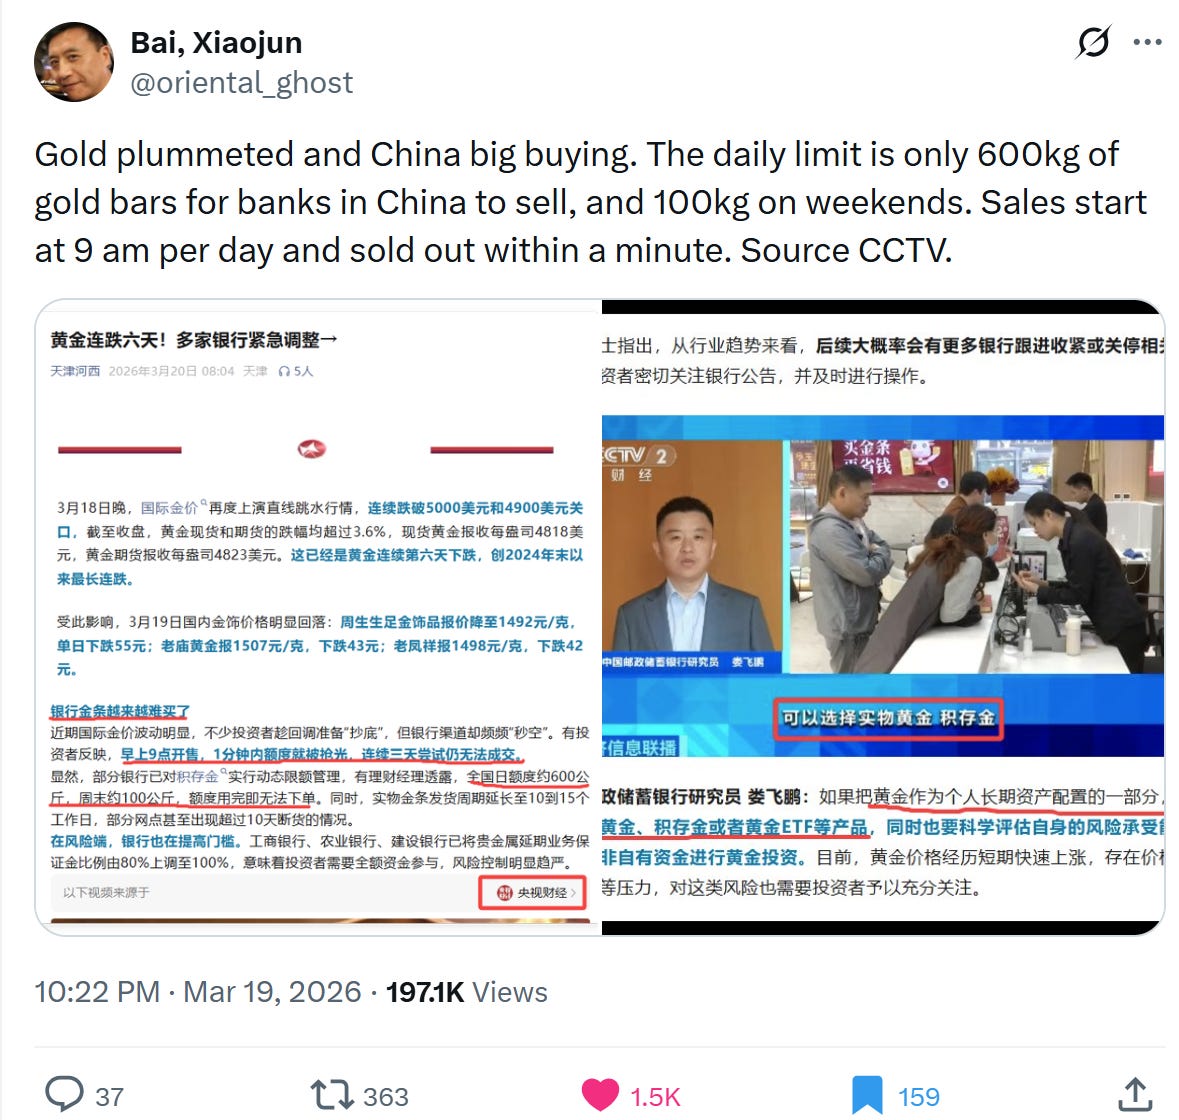
Add in new restrictions on Chinese demand (“Gold in China”) and the pipes for buyers just got much tigher.
5. Ugly Charts & Speculative Flow Reversion
Lastly, the same people who came out of the woodwork at the end of January are now coming out in force, pushing the narrative that not only is gold a ‘bad hedge’ but that, basically, the chart looked crappy and it passed a trend line. This kind of stuff does matter to some extent when you have CTAs (particularly ‘trend followers’ who make investment decisions based solely on charts) moving fast and pushing people through their stops.
So Why Might the Long-Term Picture Be Getting Better?
All of those bearish pressures are real, and they’re dominating price action right now. But here’s what’s weird about this moment: almost every one of them is temporary, while the forces they’re creating are structural. This is what makes gold so maddening to trade. The short-term and the long-term are pointing in opposite directions.
Gold Replaces Bonds in Inflationary Regimes
If we really are entering a period of rising inflation (and more inflation volatility), then gold should be competitive with bonds as ‘the other’ thing people put in a portfolio along with stocks. Not just because it has performed well.
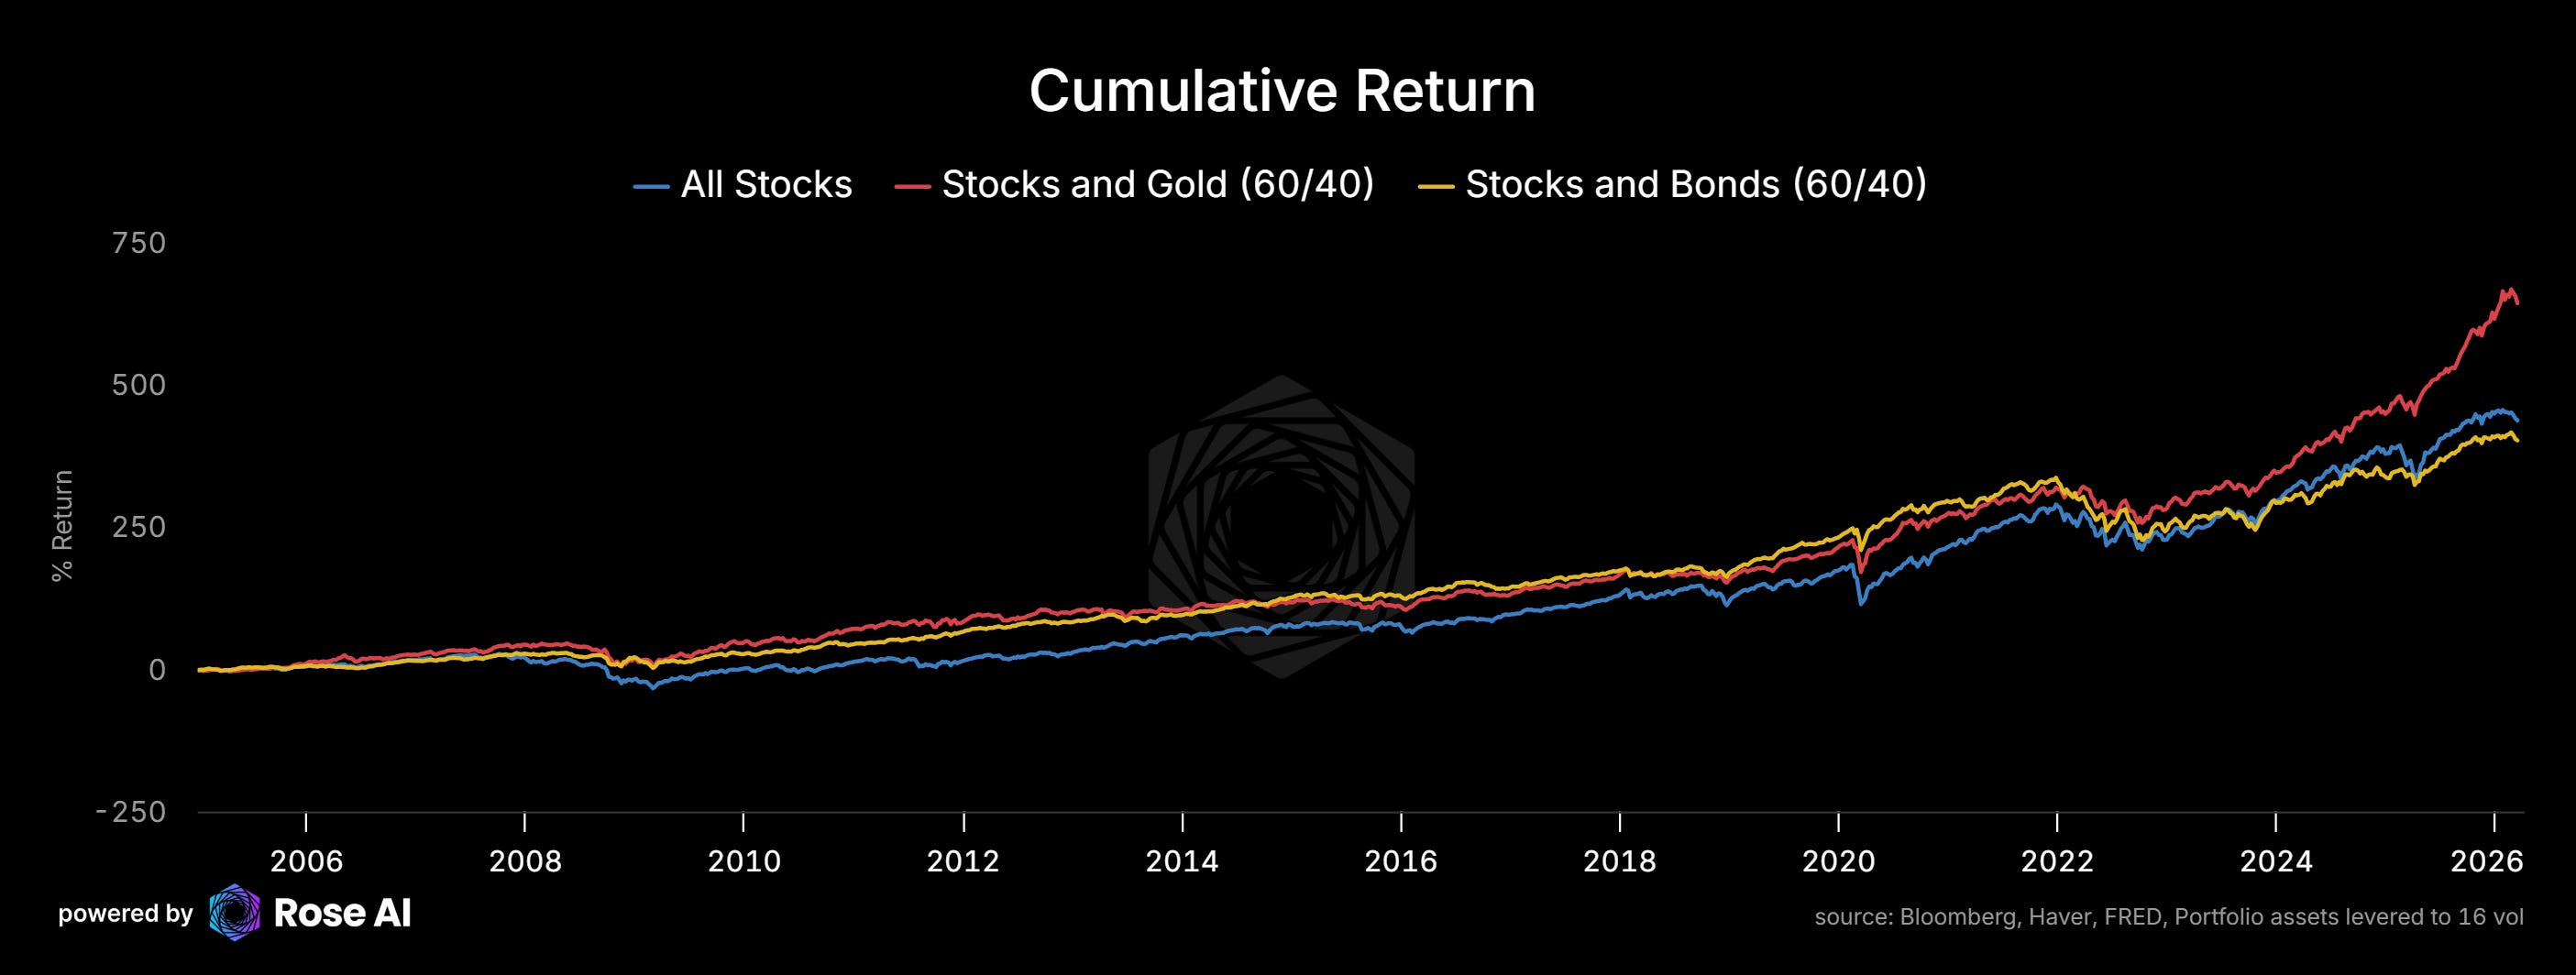
But because of the environments where bonds do particularly poorly, particularly relative to cash. Look at the drawdown history for US bonds in excess return terms. We are living through the worst period for bonds relative to cash since the early 1800s. That’s not a typo.
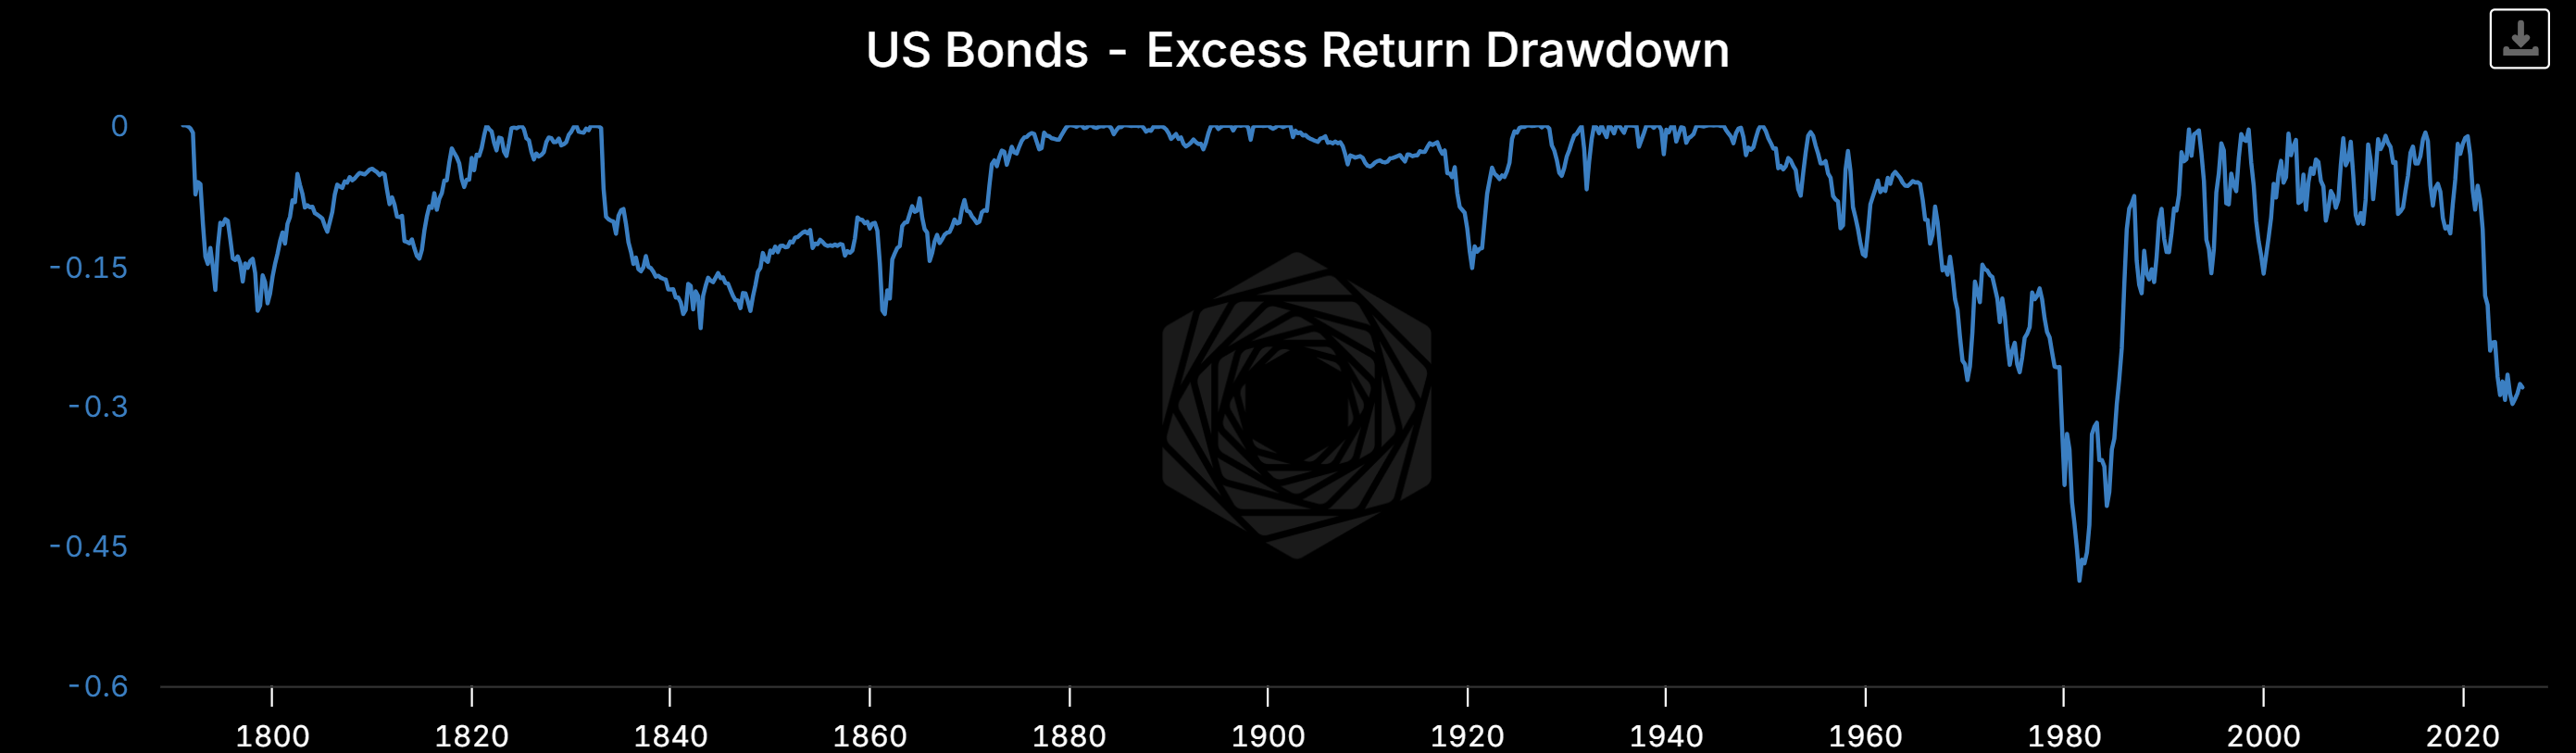
When your “safe” asset is in a 20+ year drawdown, allocators start looking for alternatives. Gold is the obvious one.
Treasuries Are No Longer Risk-Free for Everyone
Though the dollar is strong, there are very real global pressures for folks to diversify. If you’re a central bank sitting in a non-aligned country, watching the US freeze Russian reserves, watching Iran get cut off from SWIFT, watching the yuan-for-Hormuz play unfold in real time, the lesson is pretty clear: Treasuries are no longer risk-free for you. They’re risk-free for Americans. For everyone else, they come with confiscation risk.
This is why central bank gold buying has been running at record levels for three years straight and shows no sign of stopping. The PBoC hasn’t paused. India was importing 79 tonnes a month in January. Poland, Singapore, Czech Republic, all adding. That bid doesn’t disappear because of a dollar rally. It gets temporarily disrupted by the Dubai pipe being broken, but the structural demand is only growing.
The War Itself Is Bullish Medium-Term
This is the part that’s hardest to hold in your head while you’re watching the screen bleed red. The same war that’s causing the selloff (through dollar strength and liquidity scrambles) is making the long-term case for gold stronger every single day.
Every day Hormuz is closed, sovereign budgets deteriorate. Defense spending goes up. The fiscal picture for every Western government gets worse. The case for holding non-dollar reserves gets more compelling. The forces causing the selloff (dollar strength, liquidity squeeze) are temporary. The forces they’re creating (fiscal deterioration, de-dollarization pressure, structural inflation from reshoring and conflict) are permanent.
This is the 2008 analog. Gold sold off 25% during the liquidity crisis in the fall of ‘08. Then it tripled over the next 3 years as the structural consequences of that crisis played out. You had to survive the drawdown to capture the move. Most people didn’t.
The Gold/RMB/Stablecoin Question
The whole ‘price your oil in RMB’ thing, which we talked about last time. Whether or not China wants to actually replace the dollar, or just replace it with gold (that it can accumulate through its mercantilist trade policy and positive current account) is a reasonable question folks have been raising. I could be right that you need an open capital account to be the reserve currency, but wrong in the mechanism by which the dollar is displaced. China doesn’t have to force folks onto the RMB if they can do it via gold. This argument always seemed super extended (there’s no settlement in fractional gold or instantaneous settlement), but it’s the kind of thing you could see crypto rails doing a good job of. Gold-backed stablecoins competitive to dollar-backed stablecoins. Something to watch.
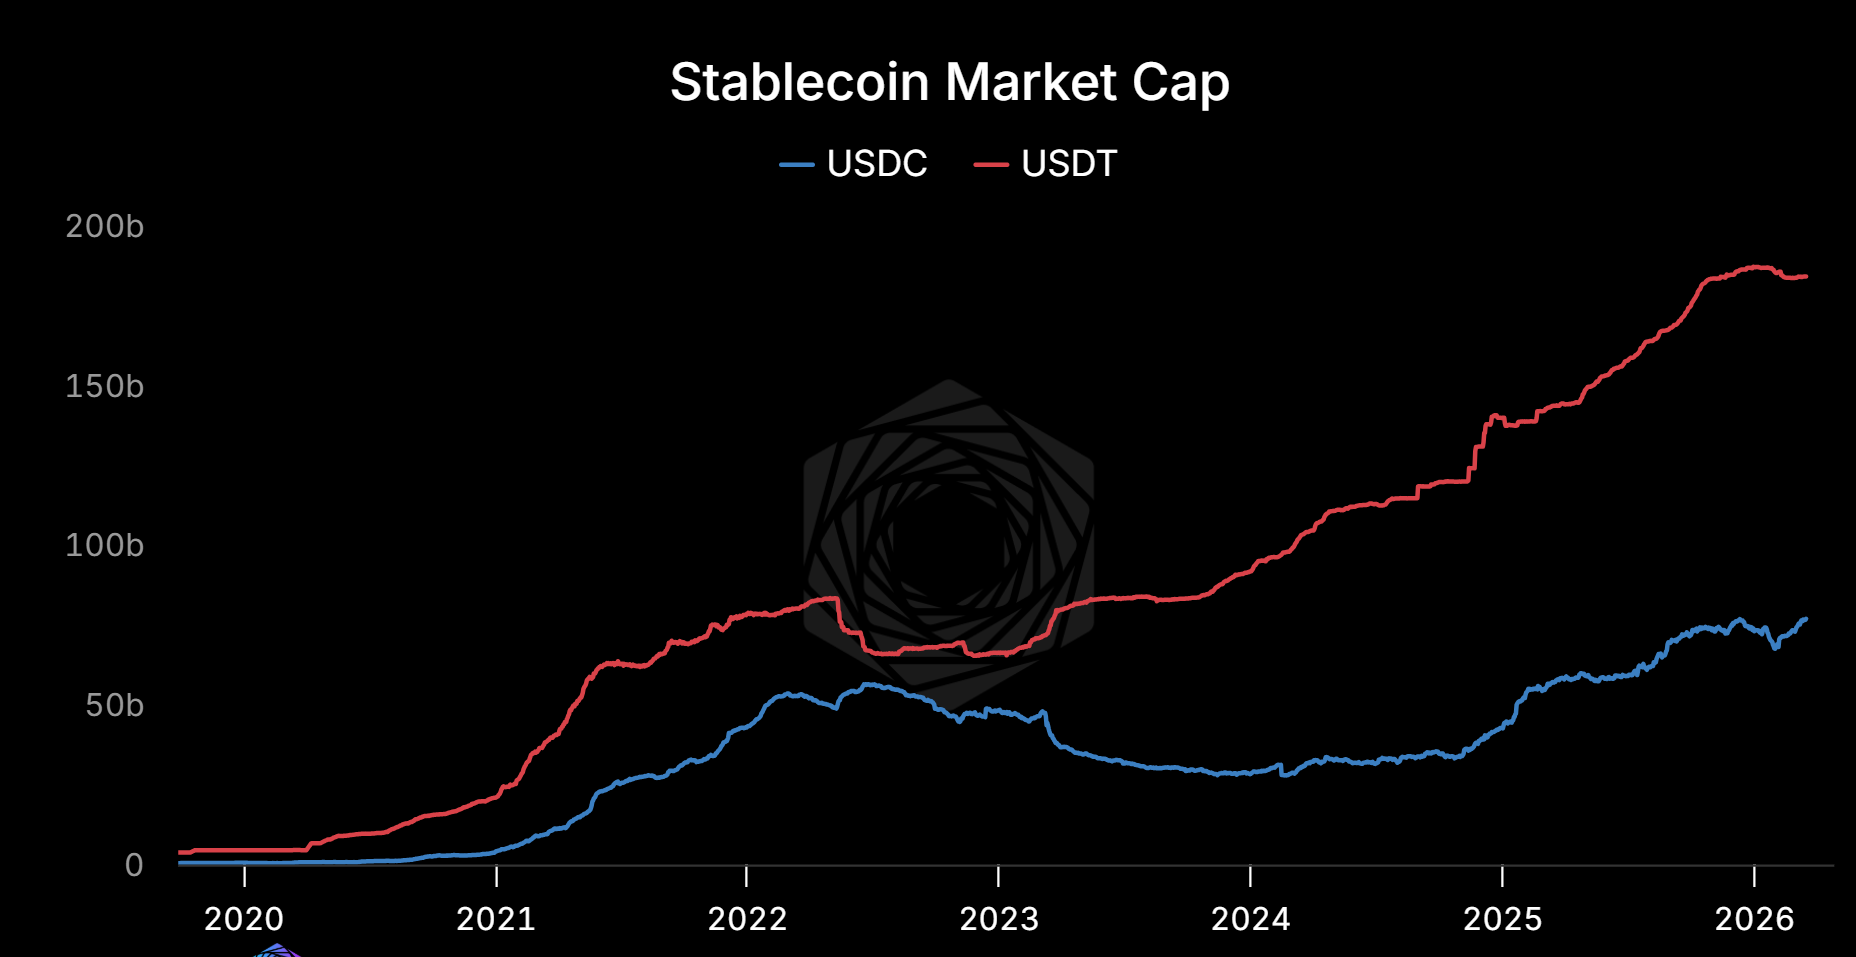
Dollar stables have plateaued the last couple of weeks, which is more indication of general tight liquidity.
How We’re Netting This
So you’ve got a market where every short-term pressure is saying sell and every long-term signal is saying buy. The bear case is all about flows, liquidity, and mechanics. The bull case is about structure, geopolitics, and math. The bear case is right today. The bull case will be right over the next 2-5 years.
The answer isn’t to pick one. It’s to get small enough that you survive the short-term while maintaining exposure to the long-term. Which is what we did this week. Cut 80% of the book. Hedged silver against gold (silver gets hit harder in liquidations — no central bank bid underneath, more spec positioning, higher vol, retail momo crowd panics first) before simplifying it and bringing gold to 5% with some upside calls remaining. And now we wait for the dust to settle before rebuilding.
Where we want to accumulate, when the time comes, is probably the miners. That was the most painful cut but there was too much noise in the portfolio and too many names. They’re getting absolutely destroyed right now, they were a faddish way to get gold exposure with leverage, and the companies themselves are levered", but even 20% lower with higher oil prices should print record profits, which means the value is building. But that’s a topic for the next piece, along with the systems work that will help us figure out when “the time” actually is.
Drawdowns are gonna happen. The goal isn’t to avoid them entirely, it’s to make sure they’re not the final battle for your portfolio.
More soon.
These past scenarios confounded by other things but prob need to sit tight for months..
https://macrodesk.ai/share/oil-supply-shock-safe/4af15ce6/c
great piece! I have a small question: what is the difference between scramble for liquidity and dollar strenghth where you say "dollars get scarce globally because everyone needs them to buy energy" Thanks!