Time to Hedge?
The Dark Arts of 'Implied Correlation"
Today we’re going to take a break from the 100-year time horizon stuff and serve up something tactical.
I get a lot of people saying “Campbell, we love how you predicted Evergrande, Taiwan, Lebanon, Vladivostok, Tiktok, Gold in China, shipping cost inflation, bonds in the stocks, but that’s yesterday’s news! We want alpha!”
Actually no one says these things. But hey whatever keeps you writing in the middle of a fundraise Campbell.
So today we’re going to delve into the wonderful world of options and make the case that: equity optionality is too cheap, it’s NVidia’s fault, so it may be time to load the boat (if that’s your thing). I myself will be buying put options (1yr out, 5-10% below spot) sometime after the open of today’s market.
The Market is Very Concentrated
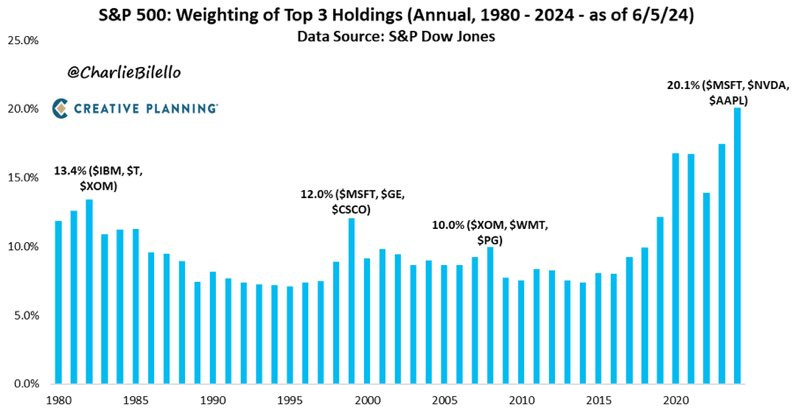
This week NVidia passed Microsoft and Apple for the crown of most valuable listed company on earth. Along the way the three stocks now make up more than 20% of the entire index.
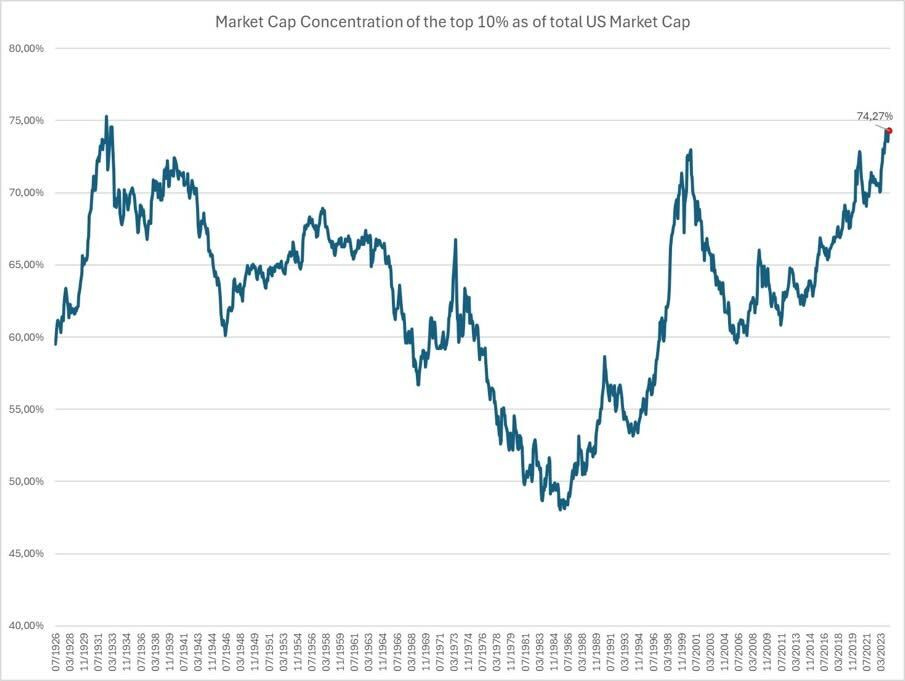
This is a pretty extreme amount of concentration, going back as far as we could find data
What that means is that more and more of ‘the market’ is just ‘what did NVidia do today?”
For fans of diversification, this alone is no bueno. If you are looking for a representative portfolio of American stocks, you might not want 20% of your portfolio is just three stocks.
However, that’s not the point of this piece. That’s the nature of stocks: “run your winners, cut your losers” etc etc.
No, the reason for the piece is what this concentration is doing to the price of volatility for stocks, and in particular, what it’s doing to the price of correlation.
Portfolio Volatility is about Correlation
Before we go there, we need to do a ‘spot of maths’ as they used to say.
See you might recall from your lessons on portfolio construction that there are three important variables that define the overall volatility of a portfolio:
The volatility of the underlying assets.
Their weight in the portfolio.
Their correlation.
The way in which these three variables come together is a little scary, but actually kind of simple. The formula basically says that the volatility of a portfolio increases as
a) the volatility of the individual assets in the basket increase
b) the portfolio weights are allocated to higher volatility assets, and/or
c) the correlation between the assets in the portfolio rises.
This is probably the most important single formula in investing because it provides intuition for some of the most important lessons in investing: diversification is as much about correlation as it is about volatility or choice of assets.
We usually hear about this relationship in the context of trying to minimize volatility (or minimize it relative to some expected or target return). In general we think of volatility as bad. In making a portfolio, the key is to keep as much of the good stuff as you can (the return), without keeping any of the bad stuff (the volatility).
What this formula also highlights is the degree to which you should really really really want assets that are a) negatively correlated to your portfolio, b) positive expected return, and c) high volatility.
Why? Because assets that have a negative correlation and positive expected return help your portfolio on both ends. They add return and they crush portfolio volatility at the same time.
I know, we lost some of you there, but don’t worry we’ll come back.
Perhaps non-coincidentally that was also the goal of my prior hedge fund, Snow. A fund that actually provides positive expected return and negative correlation. If we could have found a way to make the portfolio positively exposed to rising real yields, well, we would have had the Holy Grail of investing…
Anyway, back to the present, why does this matter?
Well, if you re-arrange the formula for your portfolio’s expected return, turns out you can solve for the correlation term:
Who cares?
Well, what if I told you that that correlation term wasn’t just something that fell out of some math but was actually something you could bet millions of dollars on?
What if we told you that simple, confusing correlation term was the critical assumption under the price of risk for every financial asset in the world?
What if we told you that, because of the way NVidia is dominating the S&P, this correlation term was getting artificially suppressed by the very people gambling on it, in a way that would (eventually & inevitably) blow up
Now do I have you attention?
Correlation is Too Cheap
How can the behavior of one stock throw the price of risk for every asset in the world out of whack?
Well it starts with something called a dispersion trade.
See, when you buy an option on an individual stock, the price you pay is connected to the implied (or expected) volatility of that asset. Higher vol, higher price for options.
When you buy an option on a basket of stocks ((like the S&P500, a portfolio of 500 market-cap weighted stocks) it turns out not only are you betting on the volatility of the underlying stocks, but you are also betting on their correlation.
Think of a basket of two stocks, Exxon and Apple. Say you split $1m across both of them evenly. Everyday Exxon and Apple come in and they can do one of two things: they can go up 1% or they can go down 1%.
Now imagine how the volatility of your portfolio changes as the correlation between these stocks moves from positive 1 to negative 1.
At positive 1, they always do the same thing. Every day Exxon goes up, Apple will go up as well. Everyday Exxon goes down 1%, so does Apple.
In that case it’s like you don’t have $500k in two stocks, it’s like all of your money is in one stock, and that stock either goes up 1% or down 1% every day. Let’s call that a vol of 16.
No imagine a separate scenario where everything is the same apart from the correlation. Assume they are perfectly negatively correlated. Every day Exxon goes up 1%, Apple goes down 1%. Every day Exxon is up, Apple is down. To the point where your profit on one leg of the trade is perfectly canceled by the other. What’s your volatility? Well, how much does the portfolio move a day? 0!
This is a practical example whereby you a can see how if you had positive exposure to the volatility of the portfolio (say in the form of a call OR put) you would actually root a bit for correlation. Which is confusing at first, but makes sense! If you are buying a put option on the stock index, to some extent what you are hedging is the day all the stocks go down a lot at the same time.
What we see in markets, is that you can actually make this bet. In fact, the very people who buy and sell equity options FOR you, the market makers, are forced into some version of this bet, by the very nature of their business.
How? Well, these market makers are in the business of buying and selling options on both individual names and the index as a whole. Usually these are actually two different traders/desks/teams, which as we will see plays into the issue here.
Anyway, by applying that formula above we can see that a trader can take a synthetically long or short position in correlation owing to their positioning in volatility across index vs individual name equities.
Options are weird like that. A lot of time you get a more specific slice of risk by chopping off or trading something ‘beneath it.’
Usually we think of trading ‘delta’ (aka the stock itself) as a way to get exposure to the difference between implied and realized correlation.
In this case we have some of that risk, but by taking opposing positions in the individual names and the index, we get exposure to correlation.
The easy way to think of it is from the perspective of the equity index. If you are short volatility on the index (and long volatility on the underlying names) you are betting that the stocks won’t all move the same way. That the correlation that is realized, ends up being much less than what was implied by the market pricing of your equity option.
Which is where I finally show you where implied correlation is.
The reason that concentration is doing this requires a little bit of puzzling but makes intuitive sense if you reason it out. As those three or ten stocks or whatever drive more and more of the index outcome, the average correlation between the index and each of the individual stocks goes down. Because less and less of their returns are ending up in the final output. It’s all NVDA, MSFT, and AAPL anyway, so all of a sudden the index becomes less representative of the performance of the average stock. Which is indeed what is happening by some measures.
That’s the mechanic by which concentration drives down realized correlation, there are also issues having to deal with feedback between how these trades are implemented and the actual pricing of implied correlation, but they are a bit too complicated, and it’s a bit too late to go into them tonight. I’m sure Andy will fill in some of the gaps I missed later this week.
So, Load the Boat?
Well, depends a bit on your book honestly.
If you took my advice years ago to pair your long stocks (which is really long tech/NVDA) with an outrageously large “Gold in China” position, then you probably don’t need to hedge.
But you didn’t, so here we are.
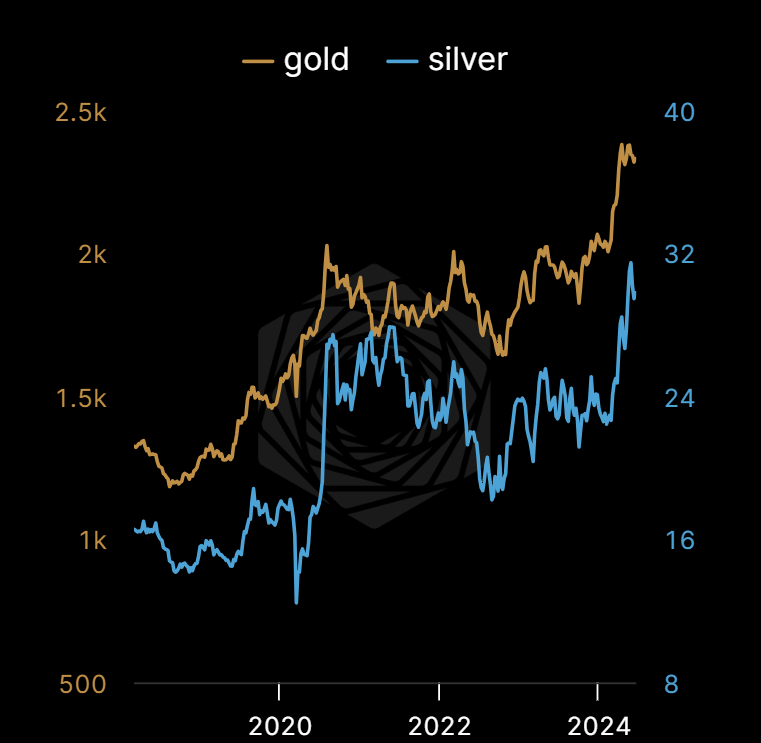
That’s your first step though, go out and buy a bit more physical gold and silver. It might take a 5-10% hit if the dollar really rallies, but it’s worth it. Don’t worry, I’ll wait.
Ok, now that that’s settled, and now that we know it’s cheap to hedge, here are a couple of reasons why now might be a good time.
You will see below I don’t have any particular specific thing that I think will turn the machine over in the near future. Rather I see a lot of small, possibly disruptive events, many of which could set off or be set off by the type of ‘Volmageddon’ we saw back in 2018 when vol sellers puked rather quickly and spectacularly. It’s all connected this go around.
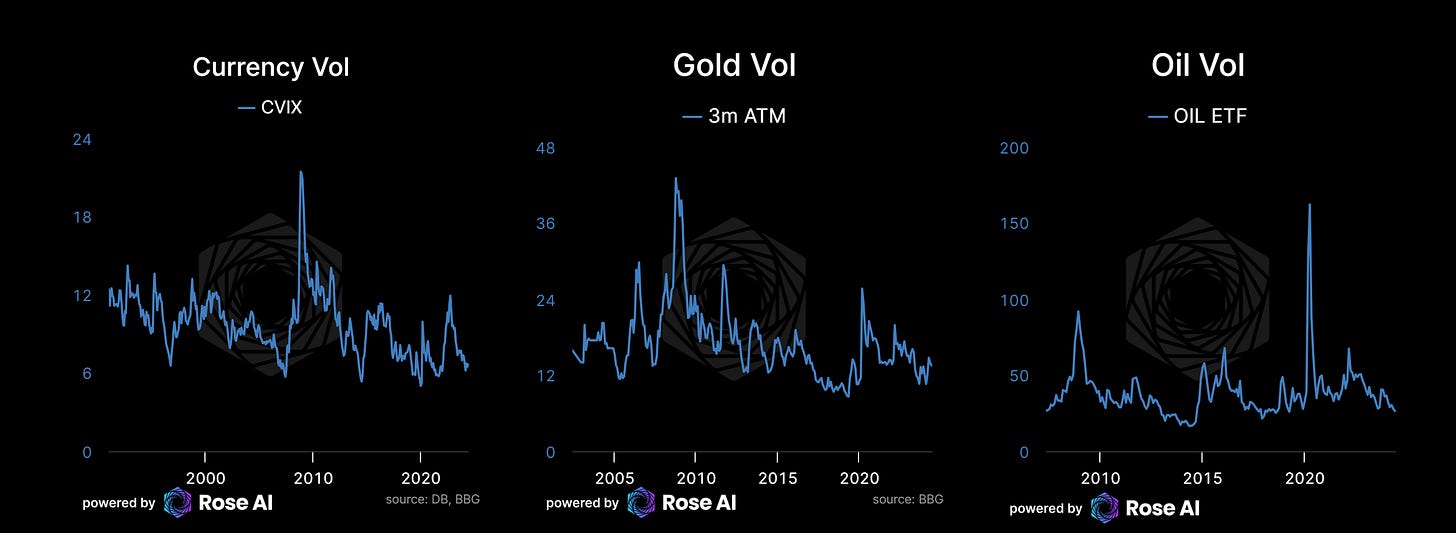
Across the board, volatility is cheap. Many market makers use the VIX (or the price of volatility on US stocks) as a proxy for how much buffer they need to feel comfortable going ‘short vol’ in other asset classes. With VIX at the lows, implied vol is down across the board.
Which means credit spreads, are still ‘tight’ aka low. For those of you with an ISDA, this (or steepner swaptions) is probably where I would play.
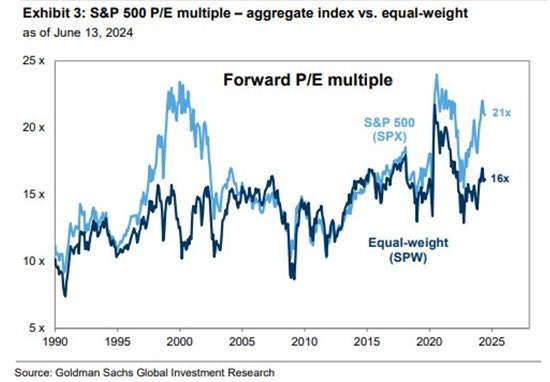
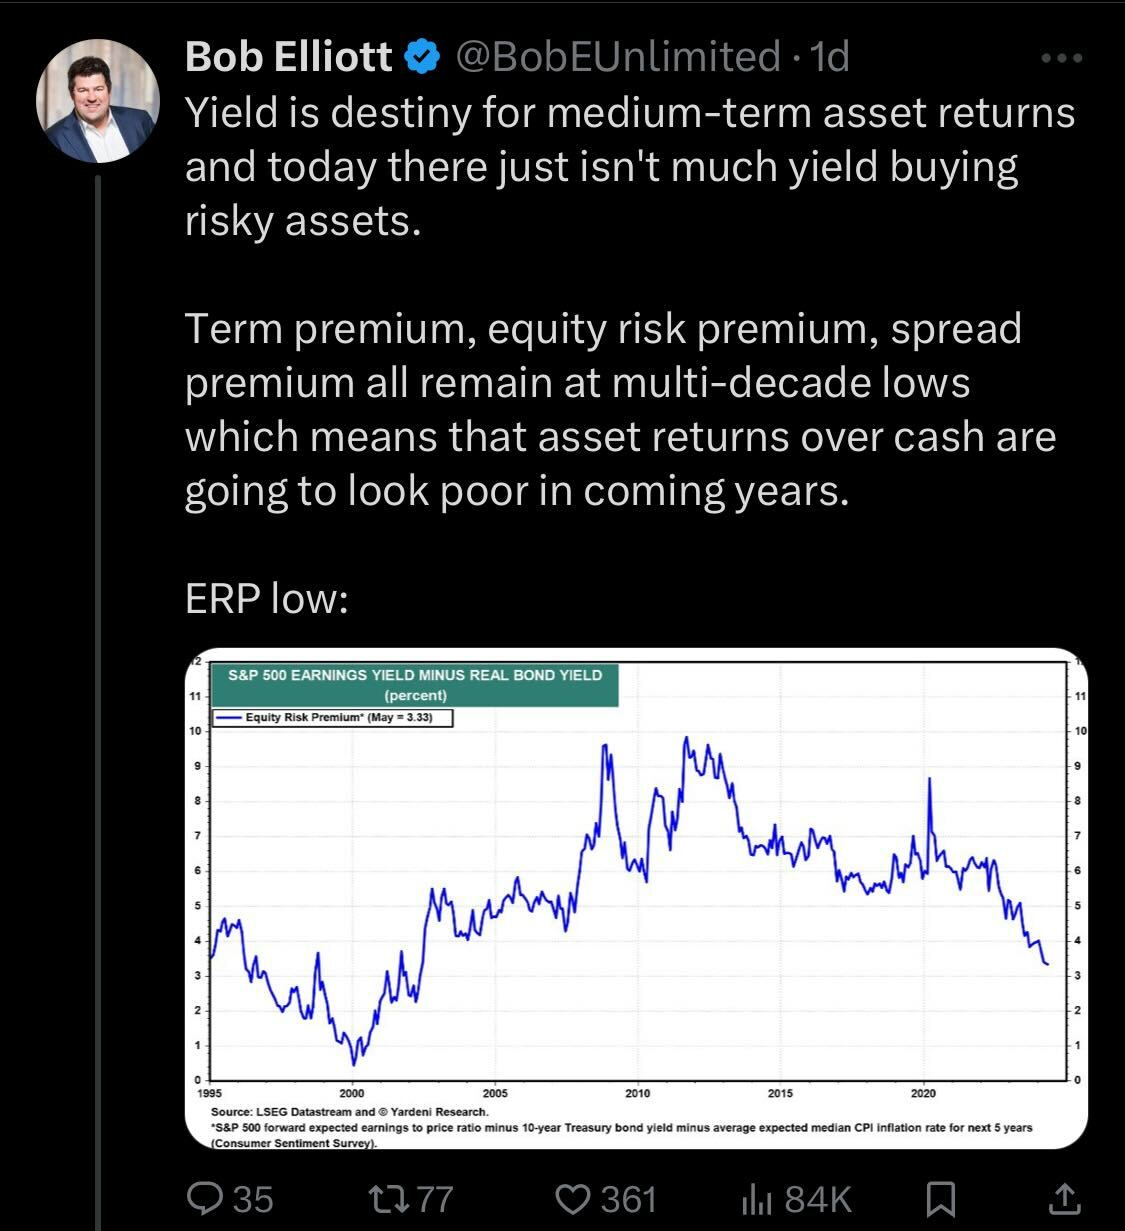
Equities, broadly speaking are still expensive.
Especially given where bonds are priced at the moment.
Inflation is not dead and it does not appear to be dead by the election, barring a recession.
Surveys are still so bad that they are in 100% historical recession territory. But at this point surveys have been this bad for two years!
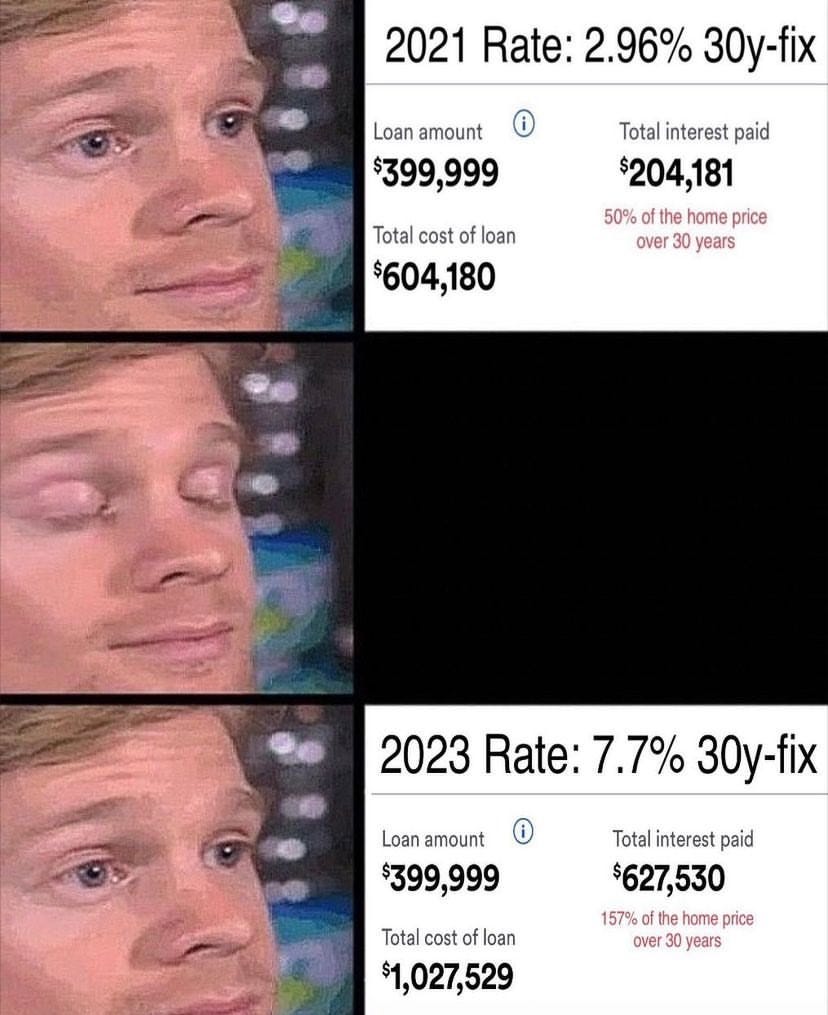
Monetary policy is still very restrictive for residential real estate.
CRE (or Commercial Real Estate) is still imploding…
Unclear how quickly these losses flow back to the banking system. Which by the way is still not hedged for a move to 7%…
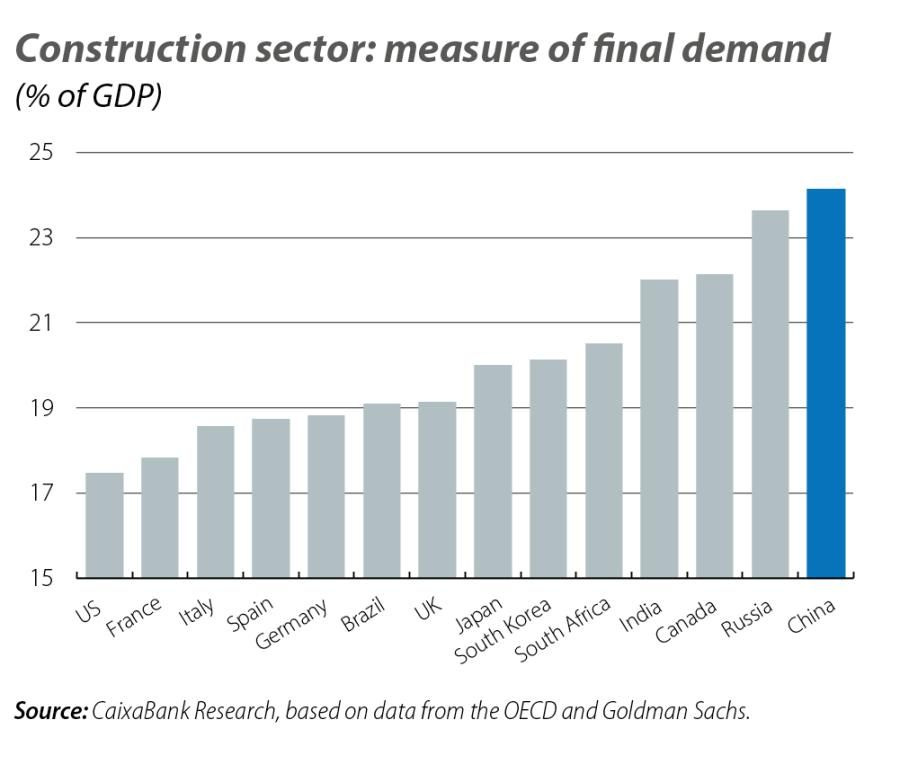
China’s property implosion is still so bad, they are trying to meme the world into thinking their whole economy is solar panels and electric vehicles. Just don’t tell the Stop Oil people how much coal they consume.
These are the things you do when 20% of your economy is property that just got nuked but you still want to claim 5% growth a year.
Wait for the banks here, nothing pressing while the market still(!) figures out what happens to Evergrande onshore creditors.
Global conflict isn’t going anywhere, which as you know means inflation will likely be stubborn. Which means even though the market is pricing in easing in September and 150bps of cuts, I still the Fed hikes before it cuts unless things get weird. If they get weird, then you will want to hedge.
Quantitative tightening is still ongoing.
The deficit is too big. Biden’s not going to cut back before the election obviously, but I would expect chaos on these terms next time there is a change in power. Any paring back of the 7% deficit would be very bearish for the US economy.
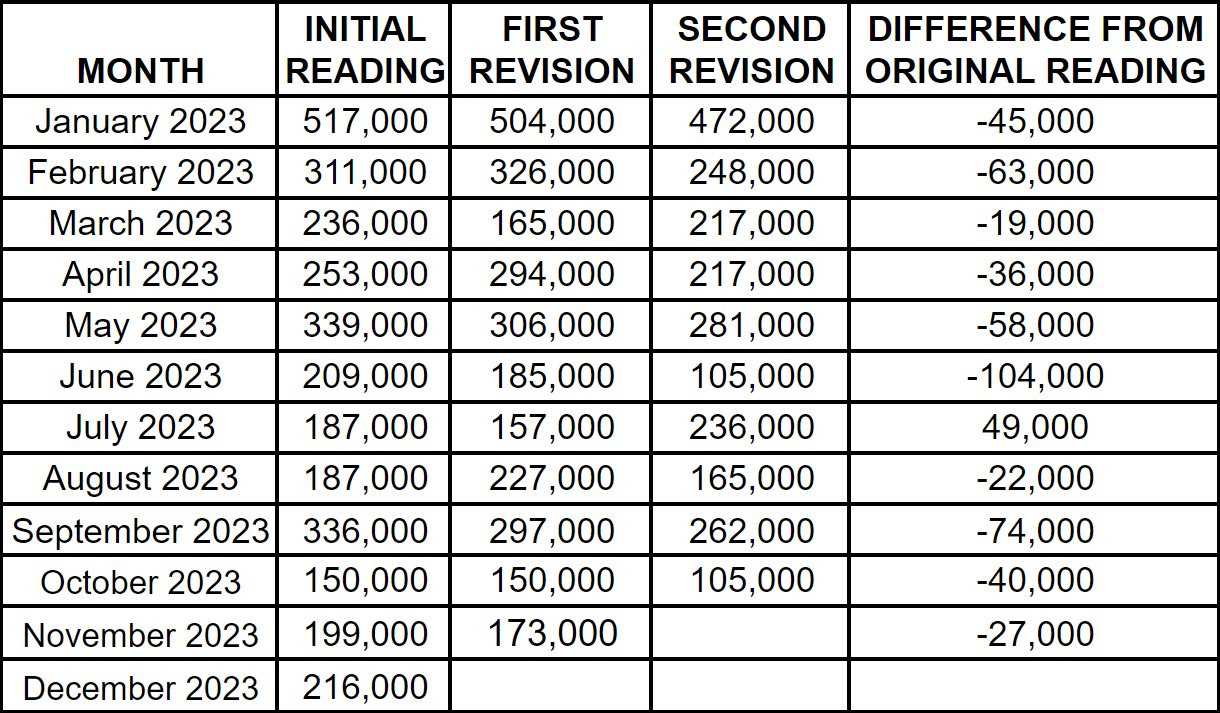
Speaking of, we’re not even sure if the great jobs reports we have been seeing are legit. Partially because the government has been doing a lot of revision (Show housing and employment).
A LOT of this is probably shenanigans associated with 3m new people showing up, and a lot of them getting to work in roles that fall outside the existing classification schema.
But still, there’s no excuse to misstate US median home prices by more than 7%, that’s a lot for someone with a 90LTV mortgage!
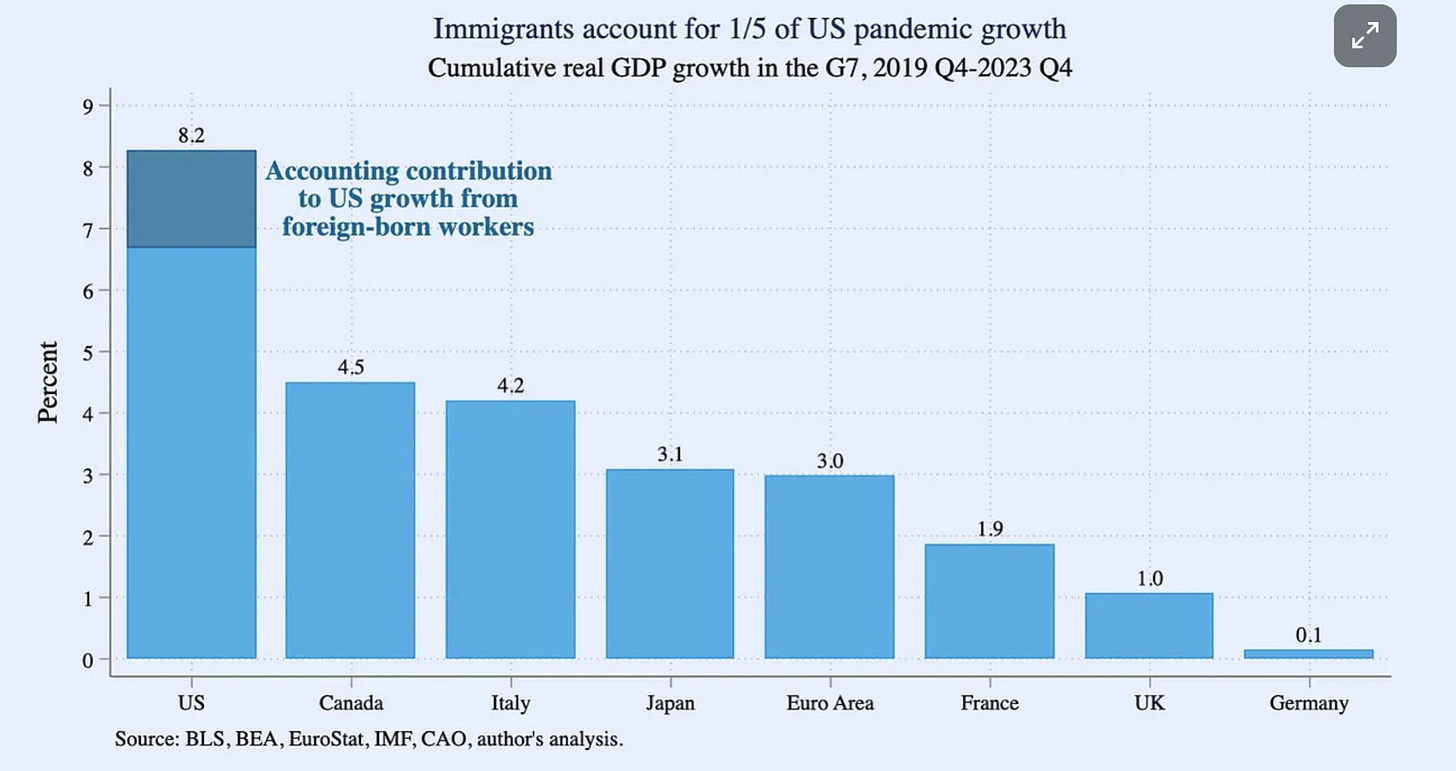
Putting this together, we have a set up for a nice end of bull market run here. If each of these don’t play out, we should be in for a nice ride here, as AI hype slowly turns into investment, which drives asset prices and incomes higher. What Bob Elliot has been calling an income not credit driven expansion. This looks by and large intact, and probably helped by stuff like immigration, which in retrospect was probably pretty supportive to the economy.
On the other hand, if one of these problems really deteriorates, it looks a lot like many of these issues will come to the fore at the same time. Especially as you know I am want to worry about China selling bonds, which drives up rates, which puts a big enough dent in asset prices to force a credit contraction (led by the small banks and then followed by the big ones), which means if you are exposed to risk (aka everyone) you have an interest in what’s playing out in the South China Sea and Taiwan.
Conflict is not only inflationary, it’s contagious, and the whole world looks like it could use a booster shot.
Disclaimers
Charts and graphs included in these materials are intended for educational purposes only and should not function as the sole basis for any investment decision.













Dumb question maybe but yolo. How does one have a basket of names that are negatively correlated, while also mostly positive returning? Isn't that a paradox? If DIS goes up and FOX goes down, then one of these has to be a loser. Unless your RR is skewed to strong winnings net, then negative correlation seems like a poor approach.