

Systems 102: The Pursuit of Alpha

Part 2 of the Systems series. Part 1: Overconfidence
The most important question in investing is also the most humbling: is this already priced in?
If you think gold miners are cheap, the market has had that same thought, processed it, and spit out a price. If you think Hormuz closing will spike LNG demand, every energy desk on the planet is running the same math. The question is never whether you’re right about the world. The question is whether you’re right about something the market hasn’t already figured out.
That gap, between the market’s view and yours, is called alpha. And the pursuit of it is an act of overconfidence, which, if you read yesterday’s piece, is where this whole series begins.
Today we'll define the terms, lay out how quants and discretionary traders each pursue alpha in their own overconfident way, and then get practical about how you can use AI right now to improve your process. The paid section walks through our gold and copper miner screeners as a concrete example. As we go through this series we'll discuss the value (and difficulty) of wiring those screeners up with live data, how to turn them into strategies, how to construct a portfolio comprised of strategies, and finally, how to backtest and risk-control this "book." Over time we'll likely make not only the snapshots and outputs of these systems transparent to paid subscribers, but live versions will go to founding members.
Alpha vs. Beta
Beta is the return you get from holding the market portfolio. Buy the S&P 500, hold it, collect the equity risk premium. It’s there. It’s cheap. Its construction is essentially free.
Alpha is what you earn (or lose) by deviating from that portfolio. Say the market is 60/40 stocks and bonds. You look at it and think: “bonds are going to get crushed, I’m going 90/10.” The difference between your return and the 60/40 return is a rough measure of alpha. You made a choice to be different from the market, and alpha is the scorecard for that choice.
Any deviation from the market portfolio is implicitly a statement that you think you are smarter than the market. The Efficient Market Hypothesis says this is a fool’s errand: the market already incorporates all available information, so any deviation is just noise plus transaction costs. Most of us who trade for a living don’t fully subscribe to the strong form, but the burden of proof is on us, not on the market.
There are numerous technical ways to measure alpha: risk-adjusted, excess, information ratio, Sharpe ratio. All trying to get at the same underlying question: did this person make money because they held a genuinely different portfolio? Or did they just lever up the market?
Quants vs. Discretionary Traders
For a lot of folks on this list, this is novice stuff, so I won’t be offended if you skip it. But for the engineers, the students, the allocators, it helps to define our terms.
A quant uses data to trade markets. The day job of a pure quant is painstakingly acquiring, cleaning, modeling, and testing millions of relationships between some X indicator and some Y market, selecting the strongest, then throwing them in a big witches’ brew with a bunch of other “signals” and torturing that data until they feel comfortable enough to say: give me money to bet on this.
All quants are fundamentally overconfident in data. Which is why they spend just as much time stress testing as signal hunting. “Hold out.” “In sample, out of sample.” “Transaction slippage adjusted.” “Live vs. paper.” These are the mechanisms by which they try to adjust for that overconfidence.
A discretionary trader thinks their own judgment is better than the market. They are fundamentally overconfident in themselves. Which you kind of have to be, just to play the game. EMH be damned, I am going to personally beat the market.
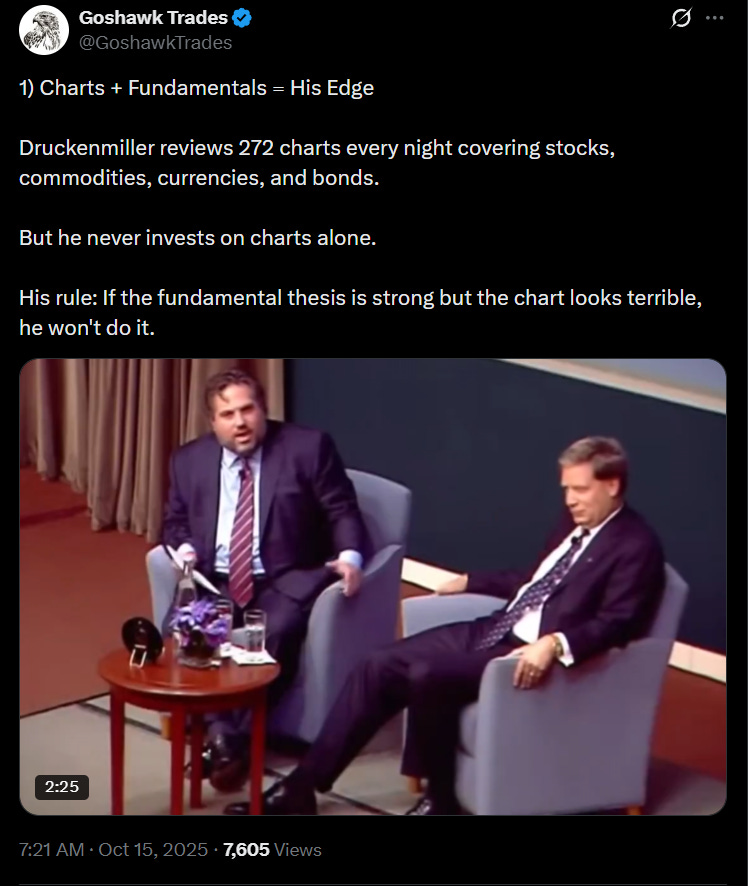
Most discretionary traders can describe their process, but it might not sound that different from what the average retirement investor does. “I read the news, I look at the chart, I punt the stonks” was basically Druckenmiller’s process, and he’s maybe the GOAT.
Which is why track record matters so much in this world. I don’t need to understand your process. I just want to see the outcomes, see when and in what ways you made or lost money, and then underwrite the risk of giving you $200m.
Back to Black Snow
When I was raising for Black Snow, allocators had two boxes. I had bad answers to both.
Are you discretionary? Where is your track record?
Are you a quant? What is your backtest?
I was mildly offended by both questions. Partially because I thought it was a false dichotomy, partially because I was defensive about not having good answers. My track wasn’t portable, my systems were in their infancy. Rather than lie, I made the classic mistake of a first-time entrepreneur: I told the wrong version of the truth.
Investors wanted certainty and transparency. Which is totally fair. I provided neither. They wanted an easy story (private credit, 10%+ returns, CLOs didn’t take a realized loss even in the financial crisis!). I was offering uncertainty dressed as exoticism: “We sit at the border between discretionary and quant investing, we use systems to inform our investment process, but the robot is never in total control. We deploy capital across alpha, beta, and gamma (aaah). Further, if you think there’s not a human sitting behind the robot at every quant shop dialing it up and down, tinkering with ‘the weights,’ you are in for a bloody surprise.”
Again, I never claimed to be a great salesman. But if I had just said “I’m a discretionary manager,” they would have said “ok, where’s the track?!” I didn’t have one I could show. Which led to the word salad above.
What’s interesting is that these two schools pretty nicely cover each other’s biases. Force a discretionary manager to only trade signals from a data-driven algorithm, and you might iron out their behavioral biases. Put a discretionary trader on top of a quant system, and the human can react to conditions that aren’t yet “in the model.” Bridgewater always called this “fundamental and systematic”: write down how the human thinks, then do the years-long data work to build that logic into a machine. As we go through this series, we’ll talk about how AI might actually deliver on that fusion. But as our experiments over the past four years have shown, the machines aren’t quite ready, and the groundwork required is extraordinary.
So today we stay in the world of the discretionary trader and talk about how you can use AI right now to improve your process. As the series goes deeper, we’ll leave this world behind. But it helps to build up from first principles.
Using AI to Trade (Starting Simple)
Most good discretionary traders approach the market with a framework. Before you open a chatbot or look at any asset in particular, it helps to have a thesis. A real one. Something falsifiable, with cause-and-effect linkages:
Hormuz is closed. Energy infrastructure is getting destroyed. US natural gas exporting capacity is near peak utilization. There will be large demand for capital to invest in and expand US capacity to export gas. The reward to capital will be higher than what the market currently discounts, and hence these assets will provide good risk-adjusted returns.
Notice the linkages. Each sentence connects to the next. Each one could, in principle, be wrong. That’s the point. You want something that is both falsifiable and contains more than a pure X→Y relationship. You need to see inside the machine, so that when you are wrong, you can evolve your understanding of why.
What follows is a rough spectrum from pure discretionary trading toward something more systematic.
Level 1: AI as Supercharged Search
“Find me US natural gas exporters and pipeline companies.”
You’re using an LLM as a supercharged version of Google, which is in turn much faster than calling up people in the oil industry (which is what people did in 1970). This is also why allocators like sector-specialist managers: someone who has been trading energy equities for 20 years already has this map in their head. Level 1 just gets you the map faster.
There’s no real data in this process. You aren’t betting on more than one linkage. But if the move is big enough and you are fast enough, there are probably decent returns to be had. Decent, because it’s also a great way to blow up on names you don’t understand. You don’t know anything about profitability, growth, debt, management, corporate actions, competitive landscape, or input costs. And even if you did, you still wouldn’t know how the market is currently discounting them.
Level 2: AI as Analyst
This is where AI genuinely helps. Each of those fundamental variables is knowable, but expensive in terms of time, energy, and money to extract. There’s tradecraft, commercially available data that isn’t cheap, and many sources of increasing returns to scale (which explains 50 years of asset management consolidation).
“Find me the 10 most liquid US natural gas exporters, then fill in this framework with their fundamentals, convert them to z-scores, and rank them.”
Pretty much what we learned on Day 5 on the vol prop desk at Lehman. Though the variables were things like implied minus realized vol, skew, term structure, momentum, and distance from the high/low. And it took Sumit and me about 4 hours to run overnight, every day.
For the average discretionary trader, this is where I’d leave off. Know your linkages, build rankings, visualize the information, and prioritize where you spend your alpha-generating attention.
Level 3: Toward Strategy Construction
The last step is to assemble a portfolio of these ranked assets and look at how they would have performed over time. This is still a long way from a real system. A true systematic approach requires doing this continuously, at some regular cadence, and finding ways to do it that aren’t backtesting theater. Alpha decay notwithstanding, there are real pitfalls in the gap between “this looks good on paper” and “this actually works with real money.”
But as a stepping stone from pure discretionary trading toward something more rigorous, it’s a meaningful upgrade. And it’s where the paid section picks up.
Till next time.
Level 2 in Practice: The Gold Miner Screener
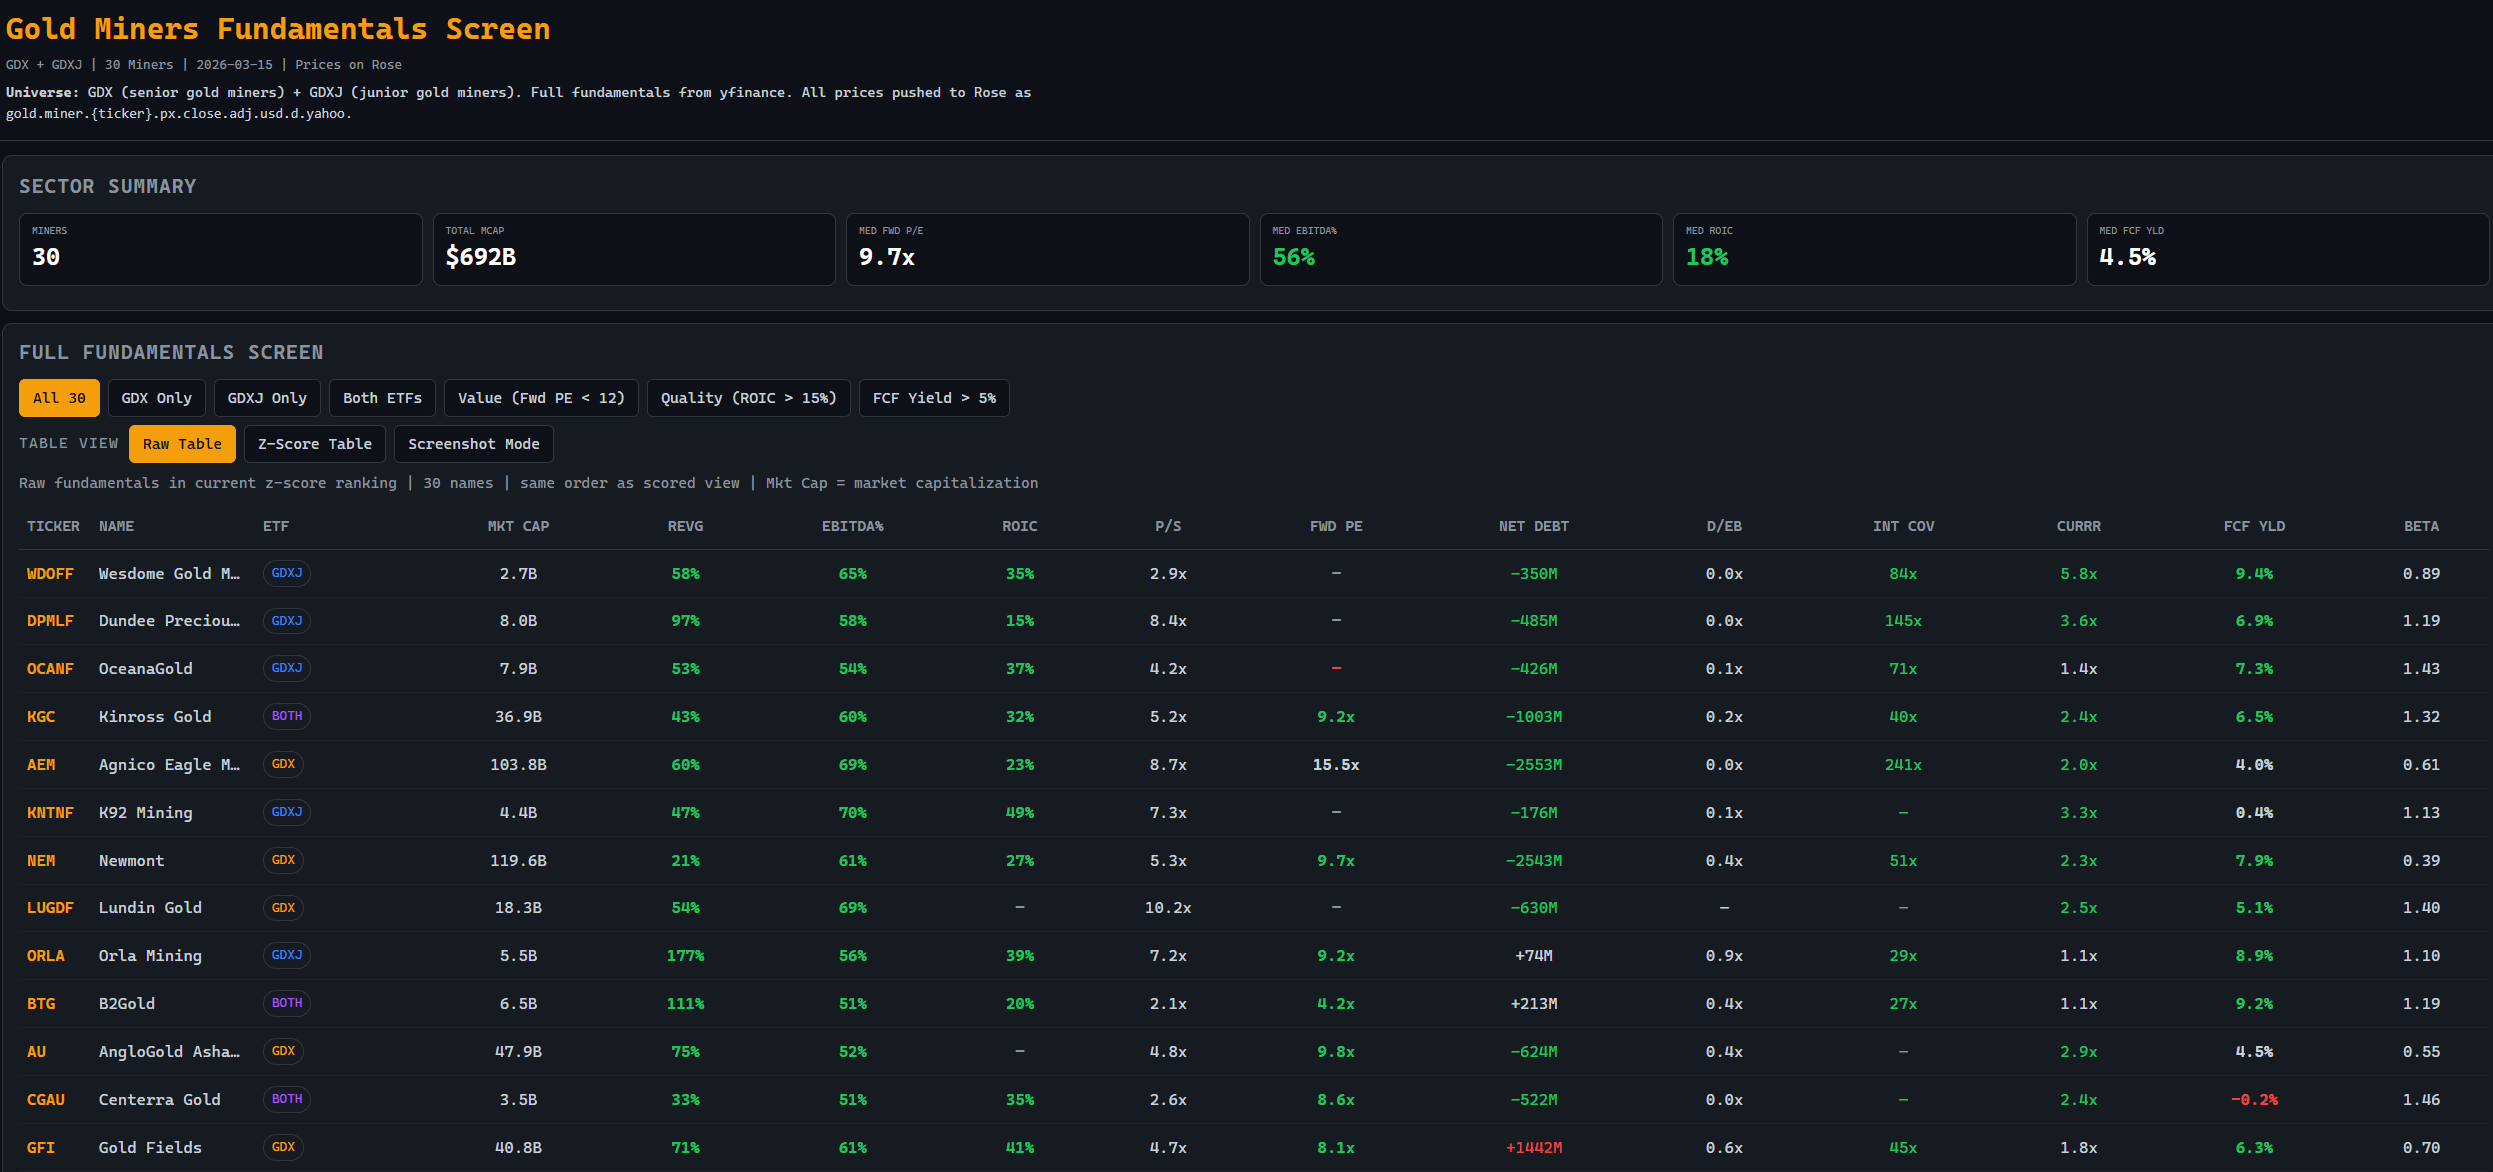
Let’s walk through what this actually looks like. Below is a screener we built for the gold mining universe: 30 names spanning GDX (senior miners) and GDXJ (junior miners), with full fundamentals pulled from yfinance and prices pushed to Rose.
The Act of Building the Screener
Even before you look at the output, the screener is doing something valuable: it’s forcing you to decide what you actually care about.
That sounds trivial. It isn’t. Most discretionary traders carry around a vague sense that they want “cheap, high quality gold miners.” But what does cheap mean? Low P/S? Low forward P/E? High FCF yield? What does quality mean? High ROIC? Low leverage? Strong interest coverage? The act of building the screener forces you to commit to a definition, and that definition becomes the skeleton of your process.
Look at the raw table. Newmont at $119B: 21% revenue growth, 61% EBITDA margins, 27% ROIC, 9.7x forward P/E, 7.9% FCF yield. Harmony Gold at $9.6B: 20% revenue growth, 38% EBITDA, 25% ROIC, but 5.9x forward P/E. Royal Gold: 6% revenue growth, 80% EBITDA margins, only 6% ROIC, 17.7x forward P/E. Three very different profiles. The screener doesn’t tell you which one to buy. It tells you what questions to ask.
From Raw Numbers to Z-Scores
Raw numbers are hard to compare across companies with different business models. So we convert everything to z-scores: for each metric, how many standard deviations is this name from the universe average?
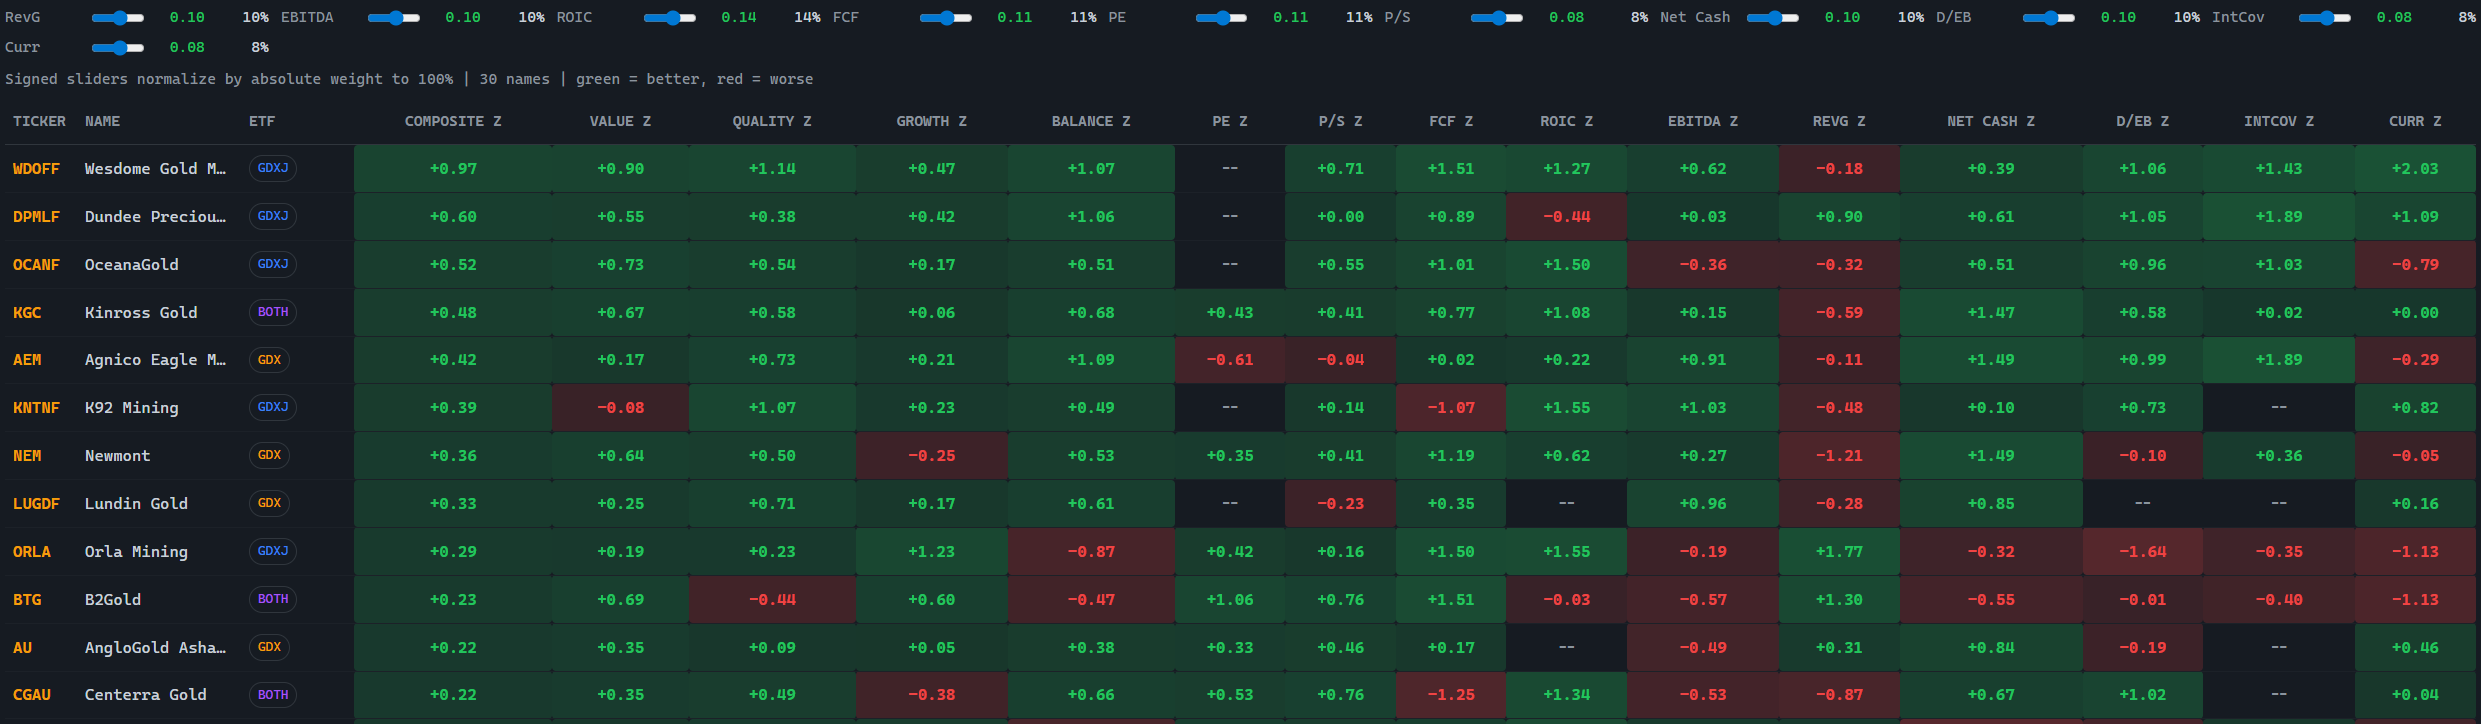
Green means better than average, red means worse. The composite z-score at the left is a weighted average across all factors, and those weights are the sliders at the top. This is where your thesis lives.
Value investor? Crank up P/E, P/S, and FCF yield. Care about balance sheet safety in a downturn? Weight net cash and D/EB higher. Think margins are mean-reverting and want to buy cheap operators about to inflect? Weight EBITDA and ROIC higher. The presets (Balanced, Value, Quality, Growth, Balance Sheet) are starting points. The real value is in moving the sliders and watching the ranking change, because that tells you what your thesis actually implies across 30 names.
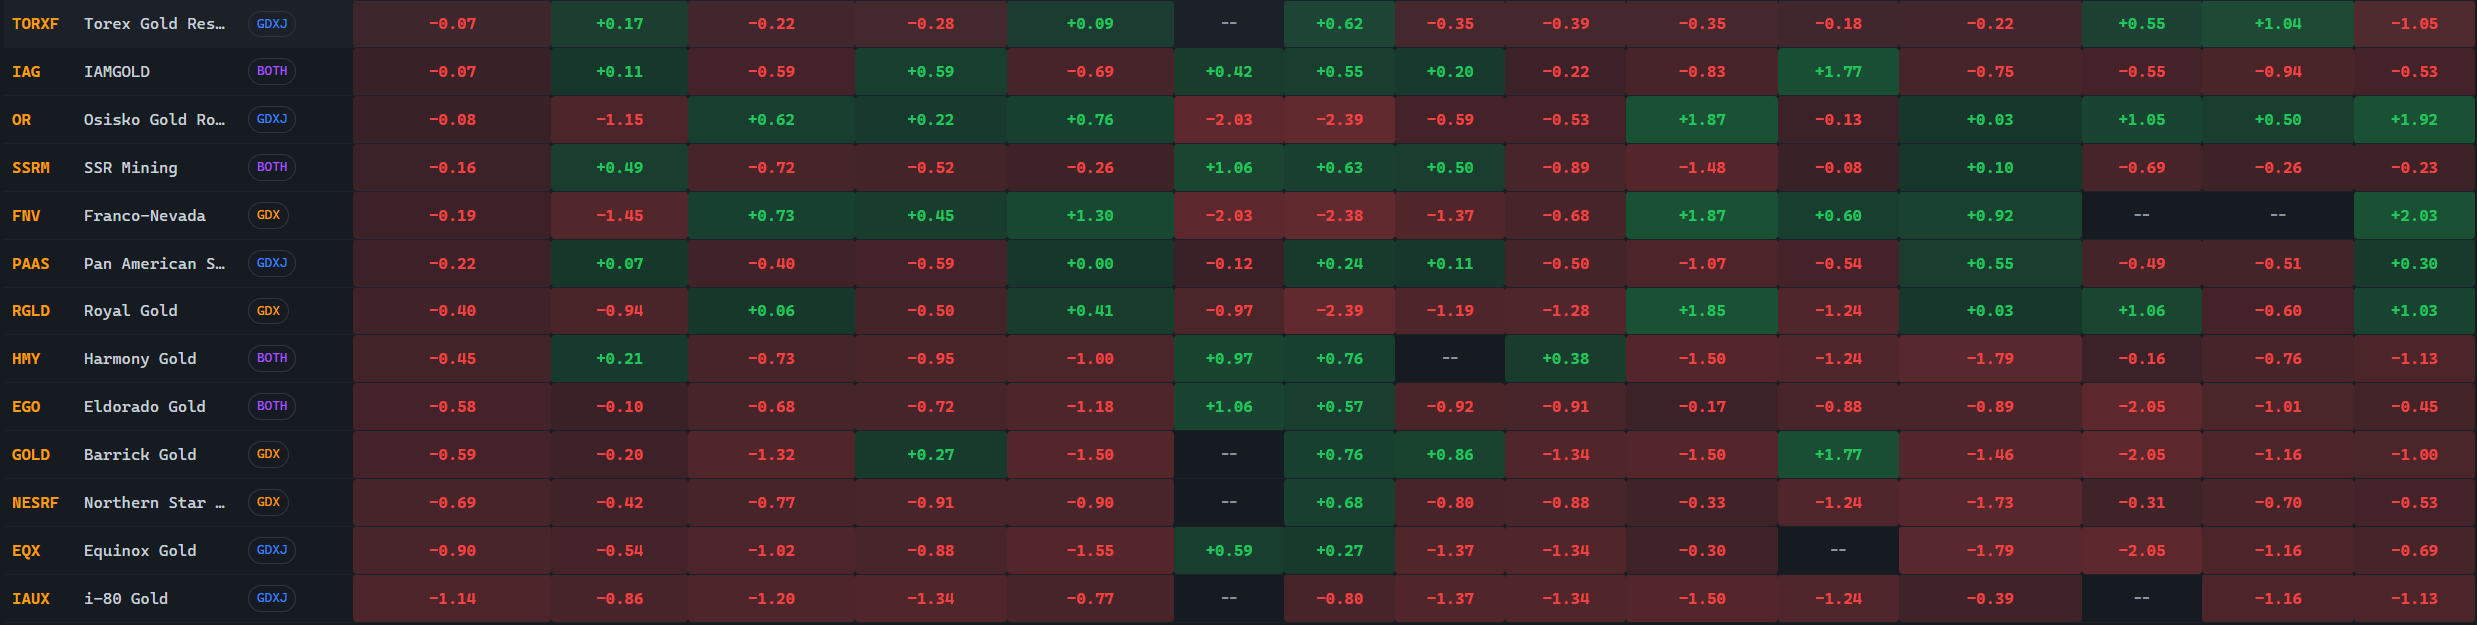
Wesdome Gold Mines tops the balanced composite. Dundee Precious Metals is second. Agnico Eagle, the second largest name in the universe, ranks third. Franco-Nevada and Pan American Silver rank near the bottom, which might surprise you if you think of them as “blue chip” miners, but makes sense when Franco-Nevada trades at 26x forward earnings with negative revenue growth. The market is paying a huge premium for the royalty model. Whether that’s justified is a separate question, but the screener makes the tradeoff visible.
I don't necessarily think you should equal weight all these indicators. When we get to strategy construction we'll talk about approaches to the weighting problem.
Seeing the Outliers
The bubble charts show you the shape of the universe and where the outliers live.
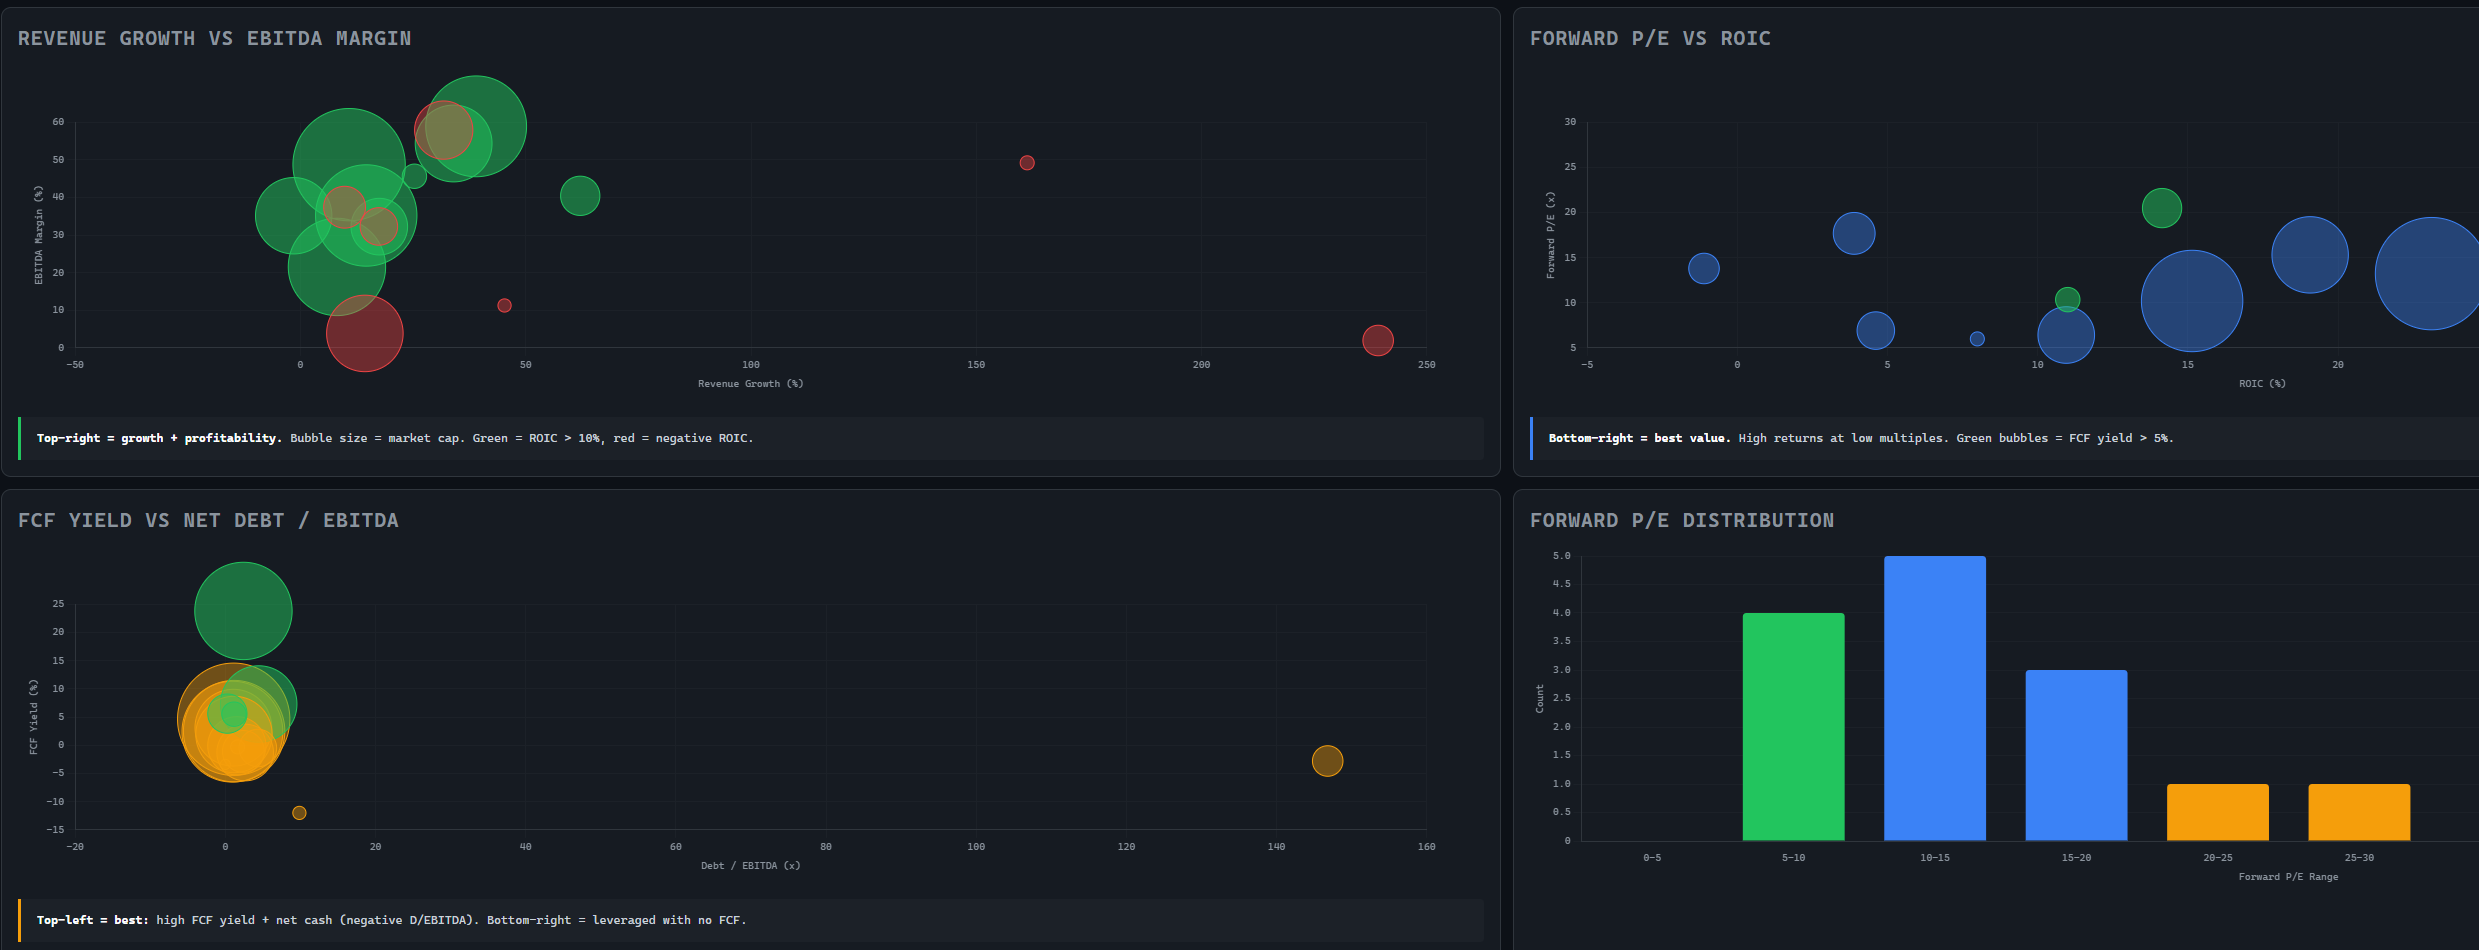
Top-left: Revenue Growth vs. EBITDA Margin. Bubble size is market cap. Green means ROIC above 10%, red means negative. The cluster in the upper-left quadrant are your high-margin, moderate-growth names. The red outlier on the far right with huge revenue growth but low margins is a turnaround story or a mine ramp. Worth investigating, probably not your first position.
Top-right: Forward P/E vs. ROIC. Bottom-right is the sweet spot: high returns on capital at a low multiple. The big bubble at the far right with a 30x P/E and 40%+ ROIC is paying up for exceptional capital efficiency.
Bottom-left: FCF Yield vs. Net Debt / EBITDA. Top-left is best: high free cash flow with net cash on the balance sheet. The outlier way off to the right, highly levered with negative FCF, is your “avoid” signal, or your short candidate.
What You Can Do With This
Once you have the screener, several things open up.
You can prioritize your longs. If you’re bullish gold, focus your deeper research on the top 5 or 10 rather than trying to analyze all 30.
More interestingly, you can build a long-short. Long the top-ranked names, short GDX or GDXJ to hedge out beta. Now your return is driven by the quality of your ranking, not by whether gold goes up or down. In a crude sense, this is the beginning of alpha extraction.
You also now have something you can backtest. If you had rebalanced into the top 5 names every month based on this composite score, how would that have performed relative to GDX? That question only becomes askable once you’ve done this work. We’ll get into backtesting properly in the portfolio construction series.
One caveat worth flagging: this data is lagged. The screenshots are from March 15, and miners have moved a lot since then. The screener is only as good as the data feeding it, and freshness matters. If you’re running this monthly, stale fundamentals are fine. If you’re trading around earnings, you need something closer to real-time. Building and maintaining those data pipelines is its own layer of infrastructure, one we’ll get into when we talk about systems.
Link to Gold Screener Dashboard
The Copper Screener
For comparison, the same framework applied to copper miners: 17 names from pure-play to diversified majors.
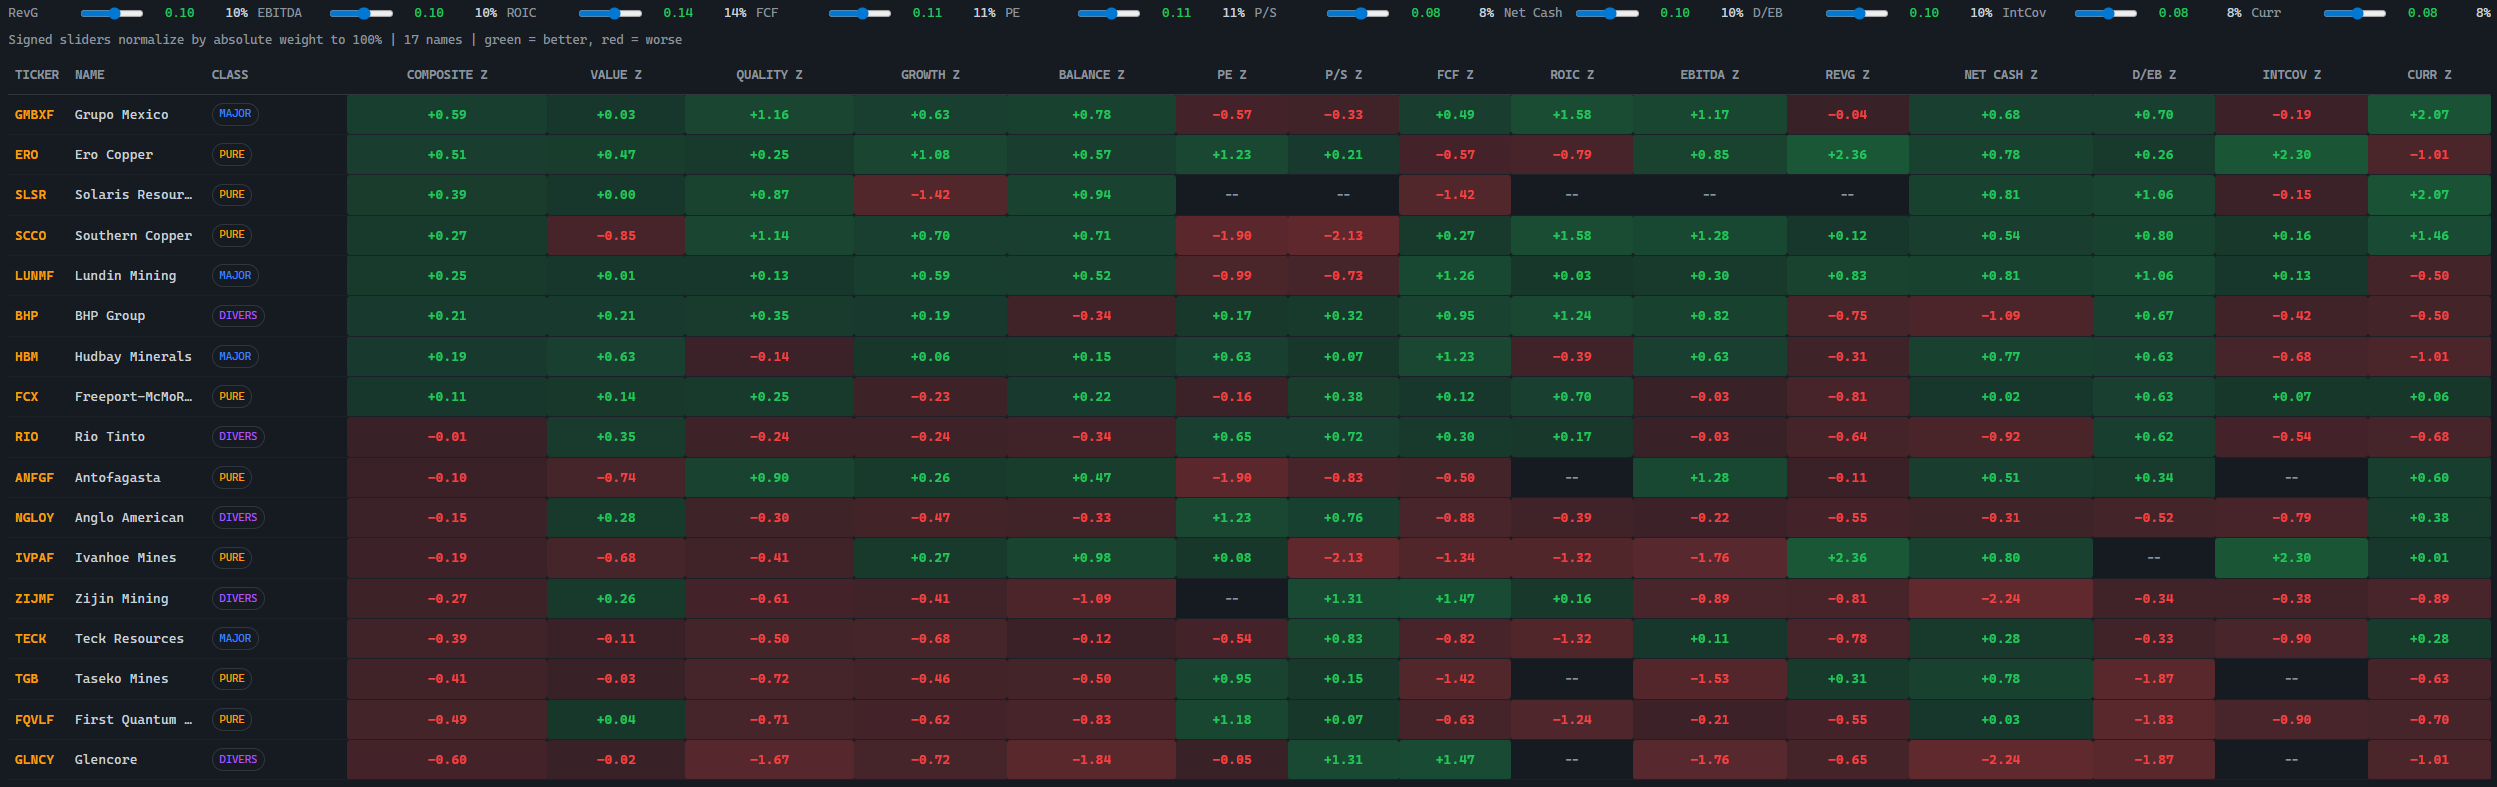
Same logic, same sliders, different universe. Grupo Mexico tops the balanced composite. Ero Copper and Solaris Resources rank second and third. The diversified majors (BHP, Rio Tinto, Glencore) rank lower because their copper exposure is diluted and their multiples reflect conglomerate structure. The screener makes that tradeoff visible without requiring you to do the mental math.
Where This Goes Next
What we’ve walked through is solidly Level 2: AI and code doing the work of an analyst, organizing information so a human can make better decisions. The key thing is that this is still fundamentally discretionary. You chose the universe, the metrics, and the weights. The screener just makes those choices explicit and applies them consistently.
Systematization means doing this repeatedly. Every day, every week, every month. Watching how the rankings evolve. Seeing which factors actually predicted returns and which were noise. That’s when you cross the bridge from discretionary into something more rigorous.
Later in this series, we’ll cover how to do this with options, which adds a whole layer of complexity (implied vol, skew, term structure, gamma) but also opens up convex payoffs that equity-only approaches can’t access.
For now, the homework is simpler: pick a universe, decide what matters, build the table, and see what it tells you.
I'm so glad I subscribed to the Ramble
Got it sensei. Getting on top of the homework now!