


“Only when the tide goes out do you discover who’s been swimming naked.” — Warren Buffett
“The time to buy is when there’s blood in the streets.” — Baron Rothschild
In a weird way these two quotes are different lenses on the same idea. An idea essential to our stoic macro investment philosophy. The notion that markets are truth-seeking mechanisms, and sometimes that process requires pain in order to function.
There’s a parallel at the level of an economy. If you conceptualize the economy “like a machine” and then put those machines in a context of “competition,” either directly or indirectly, you realize that there’s some evolutionary thing going on when we talk about how nations “compete.” Even though in reality there is no single unitary thing that is the “American economy” or “Chinese economy” or “European economy” but rather a bunch of individuals and organizations running individual optimization processes, pursuing their version of the good or the profitable. Such that when we say things like “The Chinese are destroying the European automobile industry” we don’t mean that literally. Even when conceptualized at senior levels by policymakers, you can’t just dictate that folks stop buying BMWs and start buying BYDs. You need people to make the cars, people to transport them across oceans, people to sell them, and critically, people to BUY them.
This last part, at least in my opinion, is part of the super power of markets. The notion that for the most part you have this great engine which does a pretty great job of aggregating information through consolidating billions and trillions of these little decisions into something which can be (usually inaccurately) summarized as “Taiwan GDP grew by 8.7% last year.” Forgetting, for the moment, the vagaries of nominal vs real GDP, or CPI vs PPI vs PPP vs GDP deflators and all the technocratic caveats baked into that statement.
So yes, we can think about these machines in aggregate as being in competition when they are representative of markets which are competitive, and in doing so, providing value by bringing the best products to markets at the lowest cost for the greatest number of people.
So where does pain come in?
Well, there’s the pain of losing. The pain of shutting down. The pain of changing ways of operating. Add in a financial system to this engine, and you get the pain of losing money, or going under, the second-order consequences of the fact that my liabilities are your assets, and if I don’t come up with the goods (or mortgage payment), then your asset isn’t worth as much. Add in the notion of leverage, and maybe the fact that your claim on me isn’t worth as much as you thought means your assets are now lower in aggregate than the value of your liabilities, and we start to have a problem which has the possibility to cascade.
A lesson borne out by everything from Lehman, to FTX, to the bank “panics” that used to hit the American economy like clockwork every 5-8 years before the emergence of the Fed as lender of last resort and bailout-in-chief.
You can imagine a world where all this pain goes away, but that’s also a world with pretty terrible incentives, and probably a much worse machine. How many football teams would go through the pain of preseason “double sessions” (aka 12hr practice/workout marathons that last two weeks) if not for the very real pain of losing? How many monopolies lose their way, when buttressed for too long against the fire of competition?
The two quotes that started this ramble kind of represent the “bottoming” part of what some would call a panic, or credit crisis, or deleveraging, or depression. The notion that a) sometimes you don’t really know who’s been running a bad machine until you put the stress of tough times on everyone, and b) sometimes in order to restore confidence (investor or otherwise) you need to actually see the folks who “got over their skis” the most in pain. You need to know the machine worked.
And at the economy level, we kind of get this. Productivity ironically rises in the teeth of a recession, as firms tend to fire (on balance) their least efficient workers, and make do with less. Steam cleaning the pipes and refining their production processes to the bare essentials. This then creates “slack,” at least in the labor markets, and often in the input markets like commodities and energy, which some enterprising young sort decides to pick up and put to better use. Something we all can kind of see coming with the potential explosion of automation on the near-term horizon.
Anyway, there’s a point to all this meandering which isn’t just to say that yes the pain is necessary and in some cases good, but also to reexamine one of our favorite topics, the Chinese financial system, and ask a) what’s going on, b) what can we infer about the goals of policymakers from their revealed preferences, c) where this whole machine is going.
Which brings us, finally, back to the title of this ramble: blood transfusion or blood on the streets.
The Short Version (What We Found)
Before we get into the details, here’s the punchline.
The Chinese banking system is sitting on somewhere between $4.4 trillion (base case) and $7.7 trillion (stress) in direct losses. Losses that haven’t been recognized and are being actively concealed through extend-and-pretend lending, shadow banking, and regulatory forbearance. (All USD conversions at ~7.1 RMB/USD unless noted)
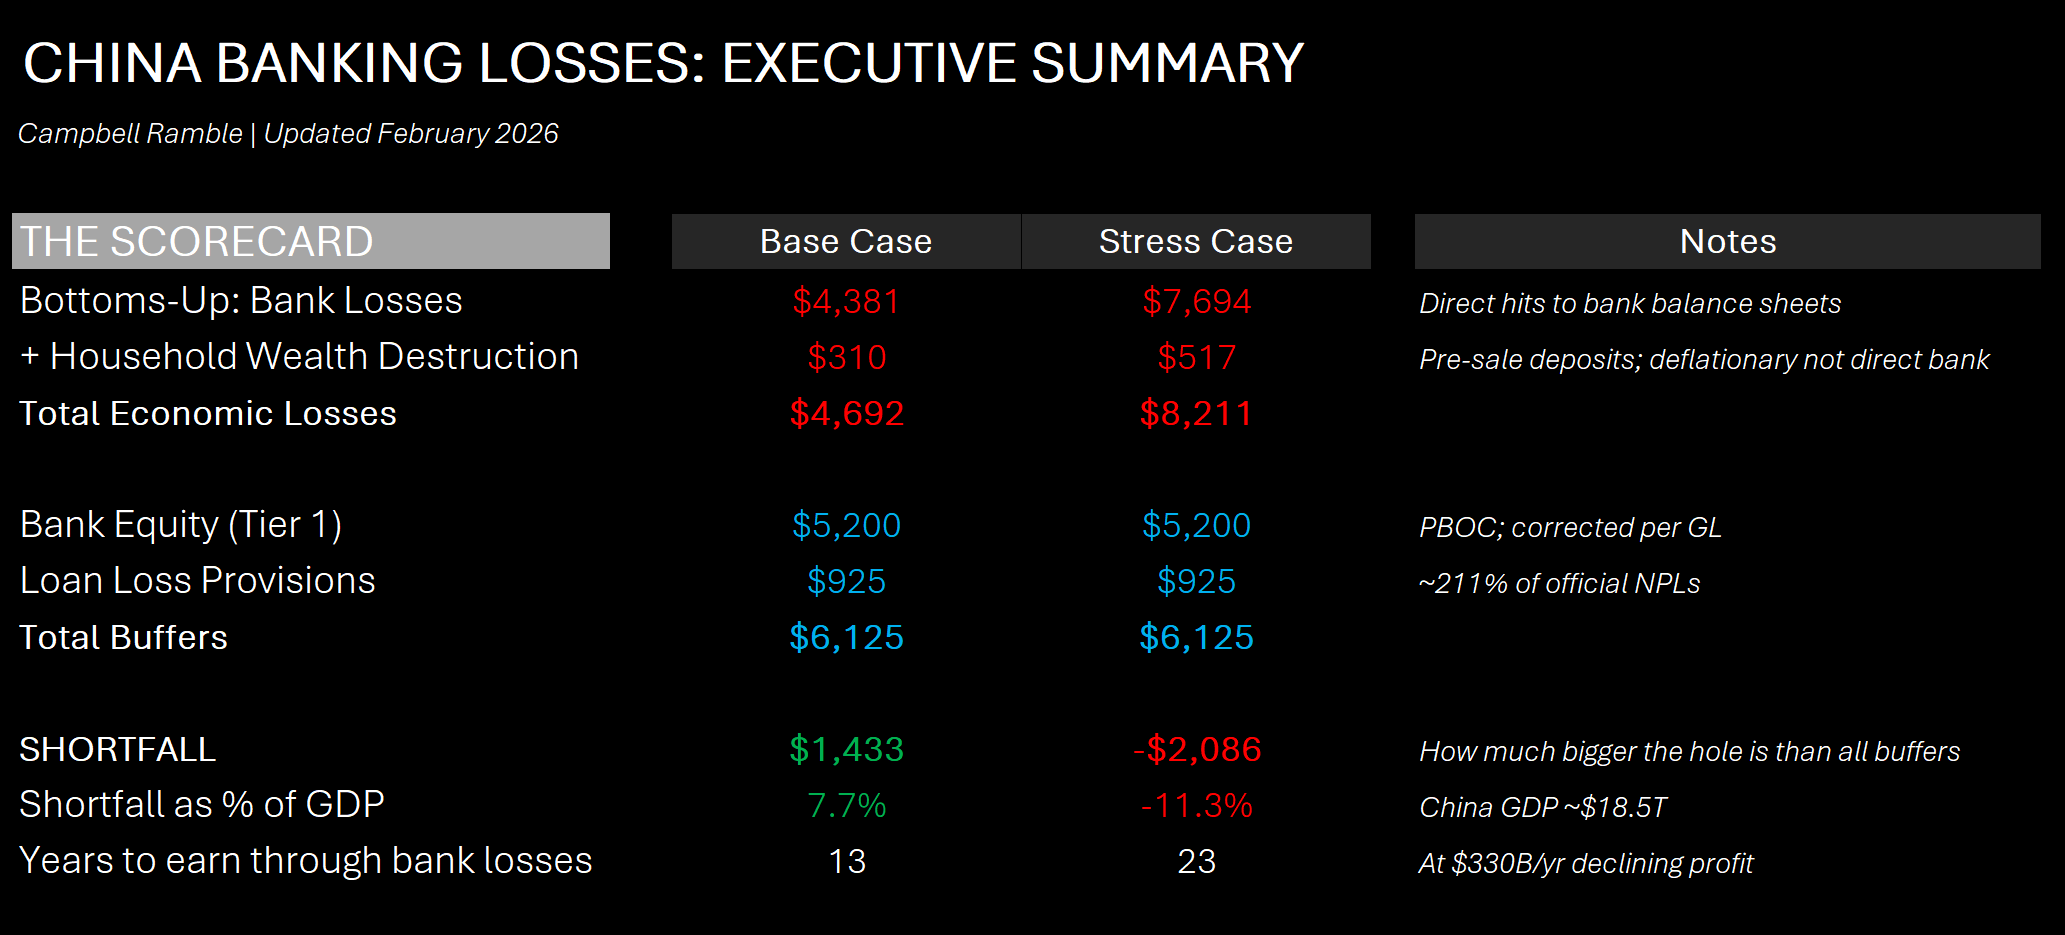
The total buffers in the system (equity, provisions, Tier 2 capital, government recapitalization) nominally add up to about $6.9 trillion. Sounds like enough to cover the base case, right? But you can’t deploy all of that without breaching regulatory capital minimums. Once you subtract the ~$4.1 trillion locked up by CAR floors and G-SIB surcharges, the actually usable buffer is closer to $2.8 trillion. In the base case, the system needs to fill a shortfall of roughly $1.1 trillion to get back to regulatory minimums — that's the gap after netting provisions already taken against specific exposures, not a simple subtraction of usable buffers from gross losses. In stress, that gap blows out to $4.4 trillion.
The strategy makes sense on its own terms: the dynamics are reflexive. If they force recognition of the losses, the panic itself makes the stress scenario more likely. Bank stocks crater, margin calls cascade, depositors bolt for the exits, and the $4.4 trillion stress hole becomes the actual hole. But if they can keep things calm — extend, pretend, let the NIM do its work — the math says they can earn their way back to adequate capitalization in roughly 3-4 years on the base case numbers. The system generates ~$330 billion a year in profits. Divide the $1.1 trillion shortfall by that and you get your timeline. Doesn’t mean the banks are healthy, but it would imply the system is solvent, as opposed to now.
So the bet isn’t crazy. It’s the same bet Japan made. The difference is what happens when it doesn’t work.
Because unlike Japan, China has a closed capital account. And that cuts both ways. On one hand, it’s harder for money to flee, which is precisely why gold-in-China has become the trade of the decade, as 1.4 billion people look for anything portable and non-RMB denominated to park their savings. On the other hand, a closed capital account means there’s more pressure building behind the dam. Japan’s savers could diversify globally during the lost decades, releasing steam gradually. In China, when the pressure finds a crack, and it always finds a crack, the force behind it is going to be something else entirely.
The response from policymakers isn’t denial exactly. It’s more deliberate than that. They understand the math. The strategy is to bleed the losses out slowly through NIM compression and regulatory forbearance over the next two decades, rather than recognize them all at once and trigger the systemic event they’re trying to prevent. The problem is that the conditions required for it to work, stable NIM, growing earnings, a solvent funding base, are all deteriorating simultaneously, and the tools to fix them are running out.
What that means in practice: the banking system is generating roughly $1.1 trillion per year in implicit losses through four channels. $550B from collapsed land-sale revenues, $183B from loan write-offs, $300B in LGFV debt service at artificially low rates, and $100B in annual NIM compression. Every year that number compounds. Every year the earn-through timeline gets longer.
The full 40 page analysis follows for paid subscribers below….
I. The Property Market: Prices in Managed Decline
The property collapse in China is, by now, well understood in outline. But the details still have the capacity to surprise.
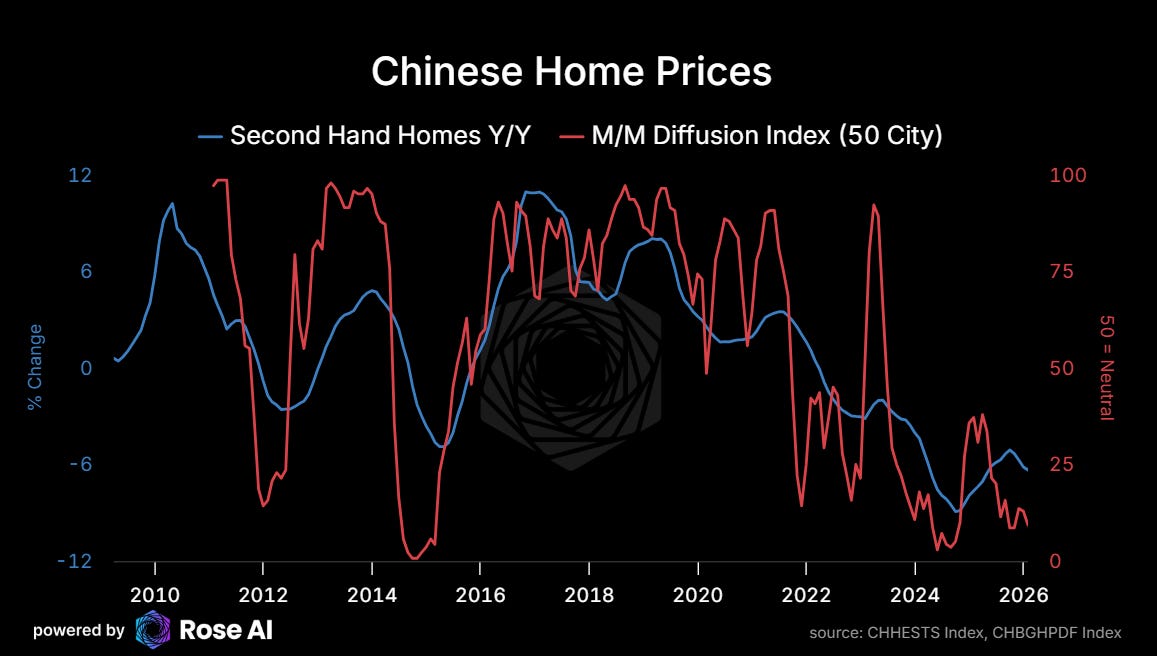
Home prices are falling across almost all cities, with second-hand prices down 6-7% year-over-year and the month-over-month diffusion index for 50 cities sitting below 25, meaning roughly three quarters of cities are still seeing monthly price declines. That’s been the case for most of the last two years. The official line is “managed decline.” The reality is a market with no natural floor in sight.
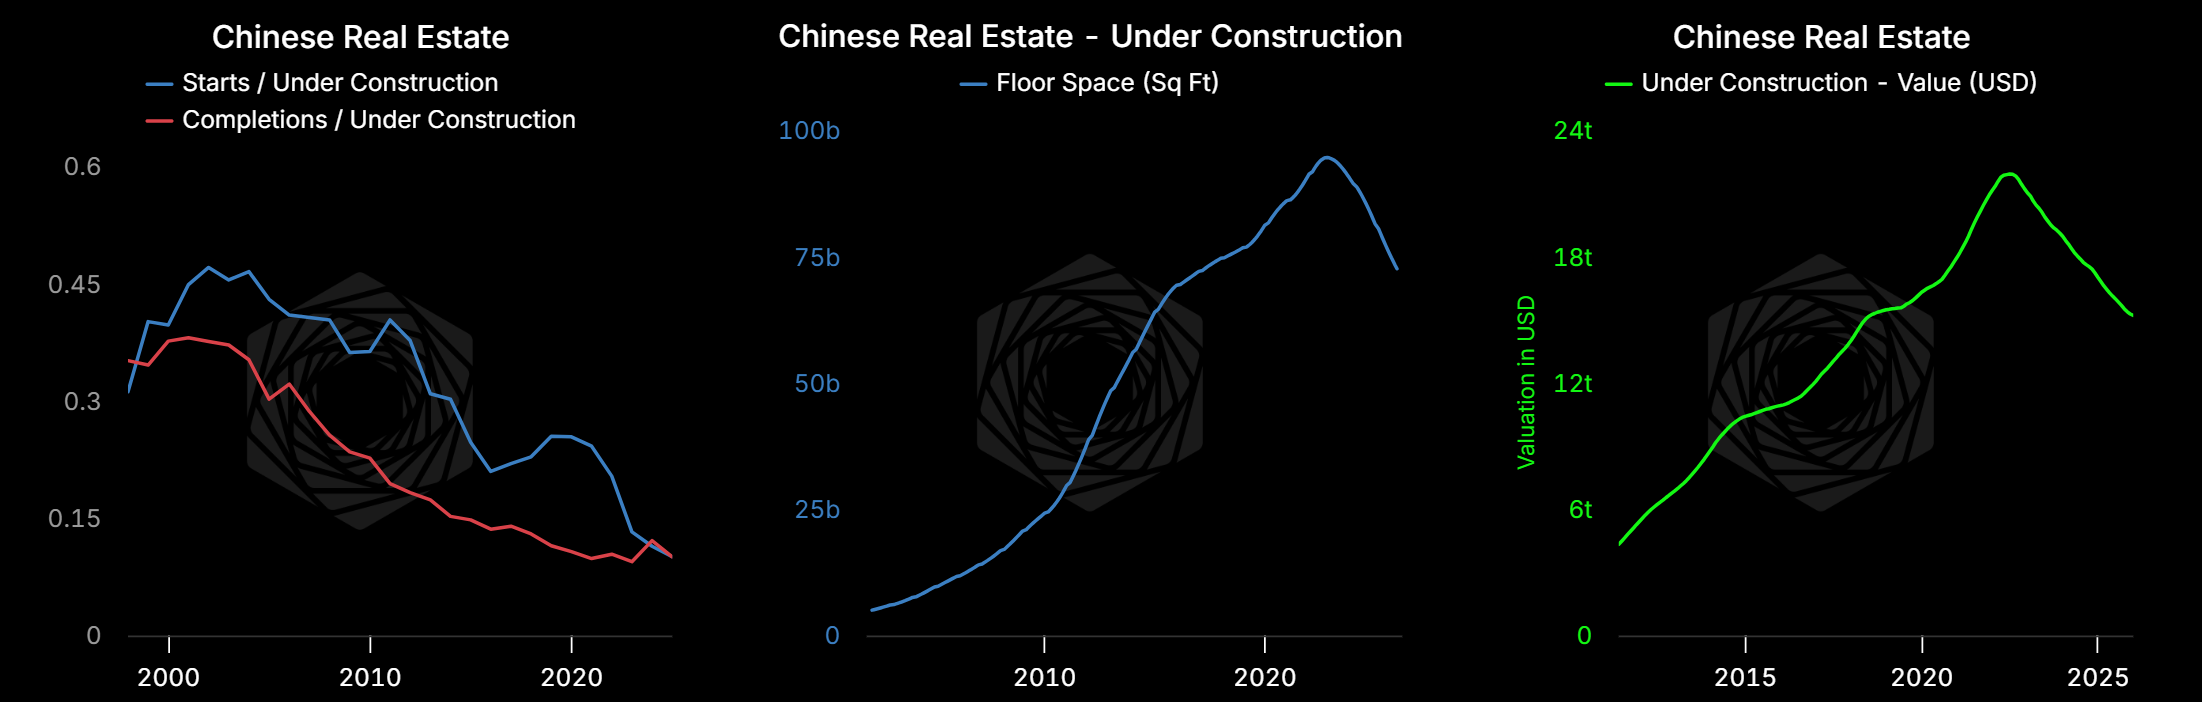
But what people keep missing is the supply overhang. Only in 2023 did completions start to outpace new housing starts in terms of floor area. There’s still around 72 billion square feet under construction. Roughly $15 trillion of land and half-finished inventory sitting on developer balance sheets, waiting for a buyer that may never materialize. Every time a developer dies, that shadow inventory hits the market, sucking up capital and dragging out the clearing process.
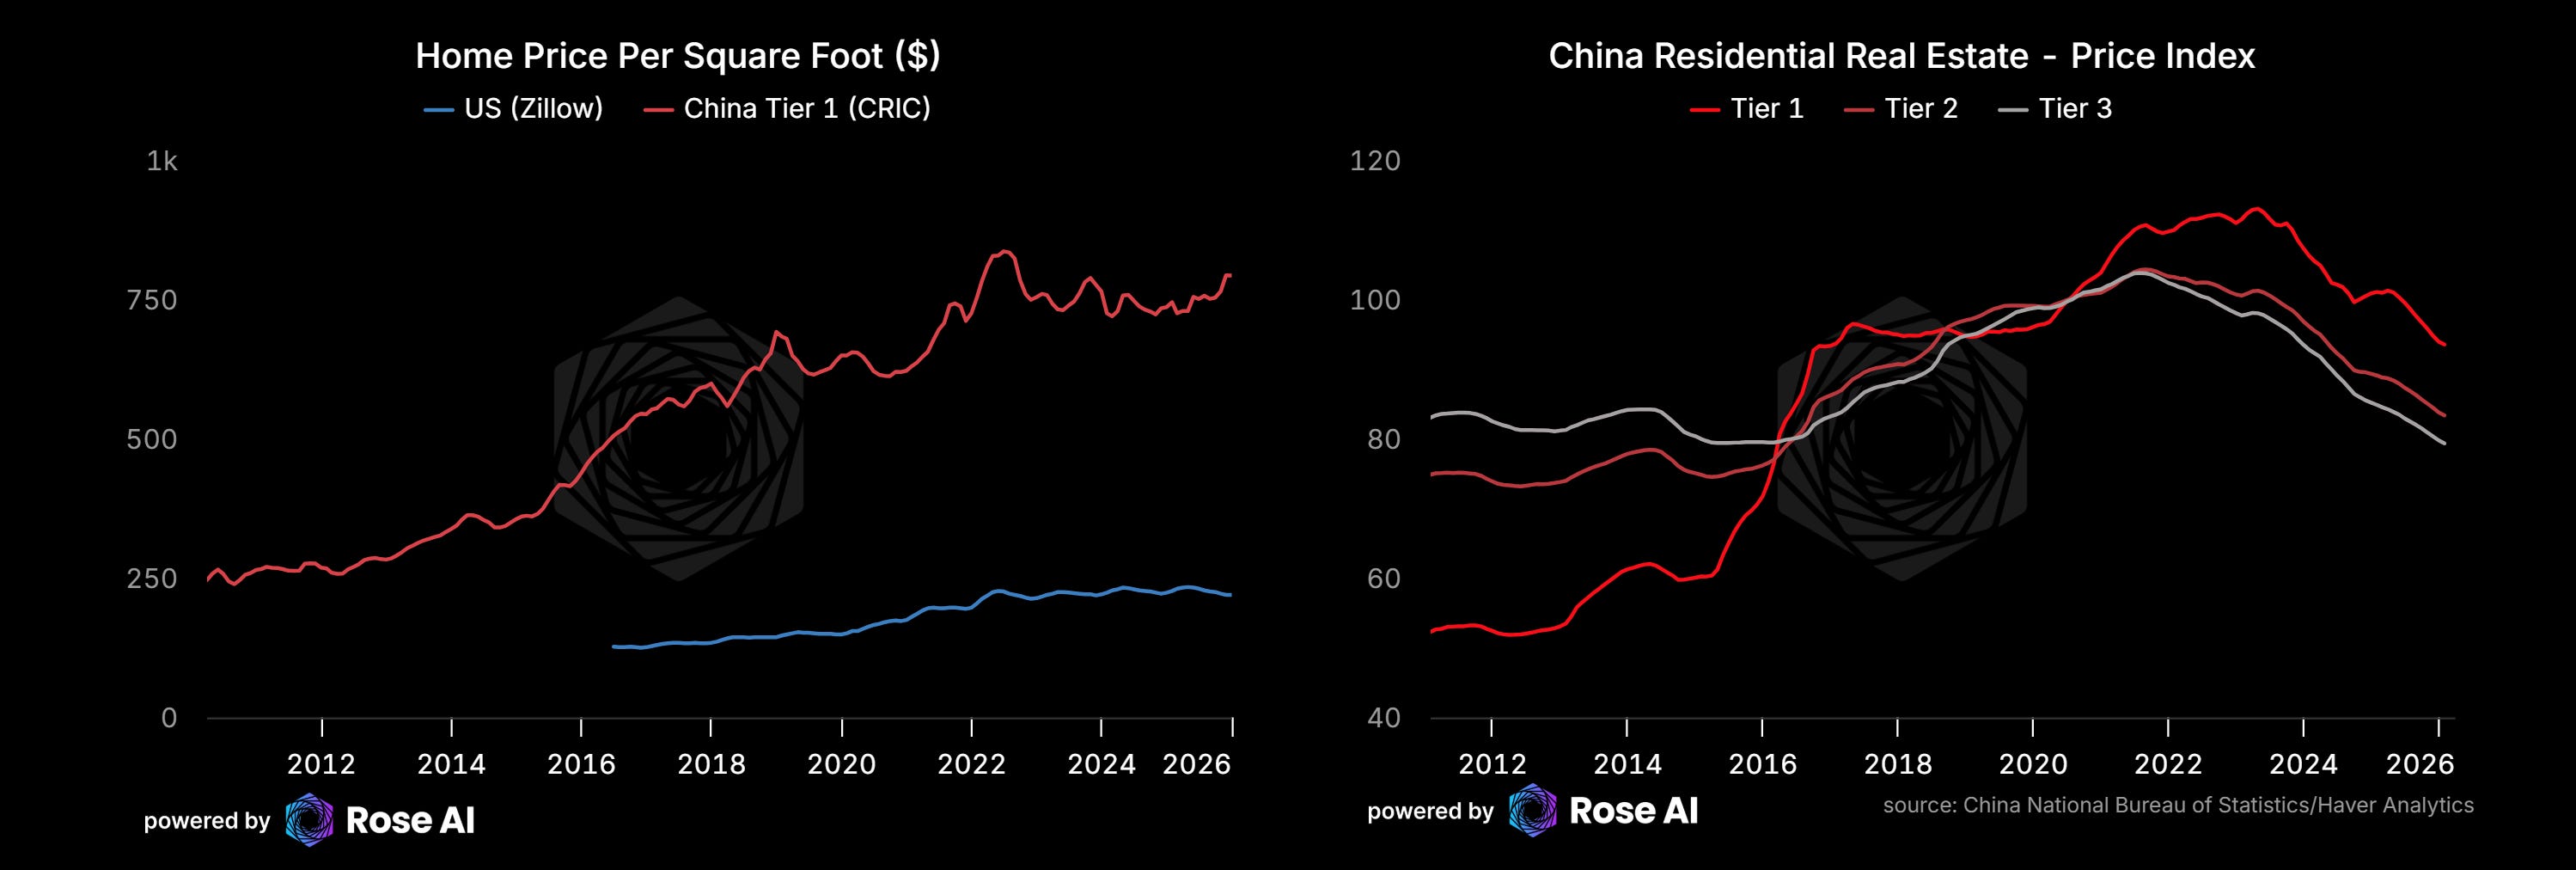
And prices, even after the decline, are still expensive by any reasonable international comparison. Chinese first-tier cities are running around $700-750 per square foot, versus roughly $250-275 for the US Zillow average. The US comparison becomes even more jarring when you factor in income. China’s GDP per capita is around $12,000 versus $80,000 for the US. The bubble had a lot further to deflate than people appreciated when Xi pulled the punch bowl in 2020.
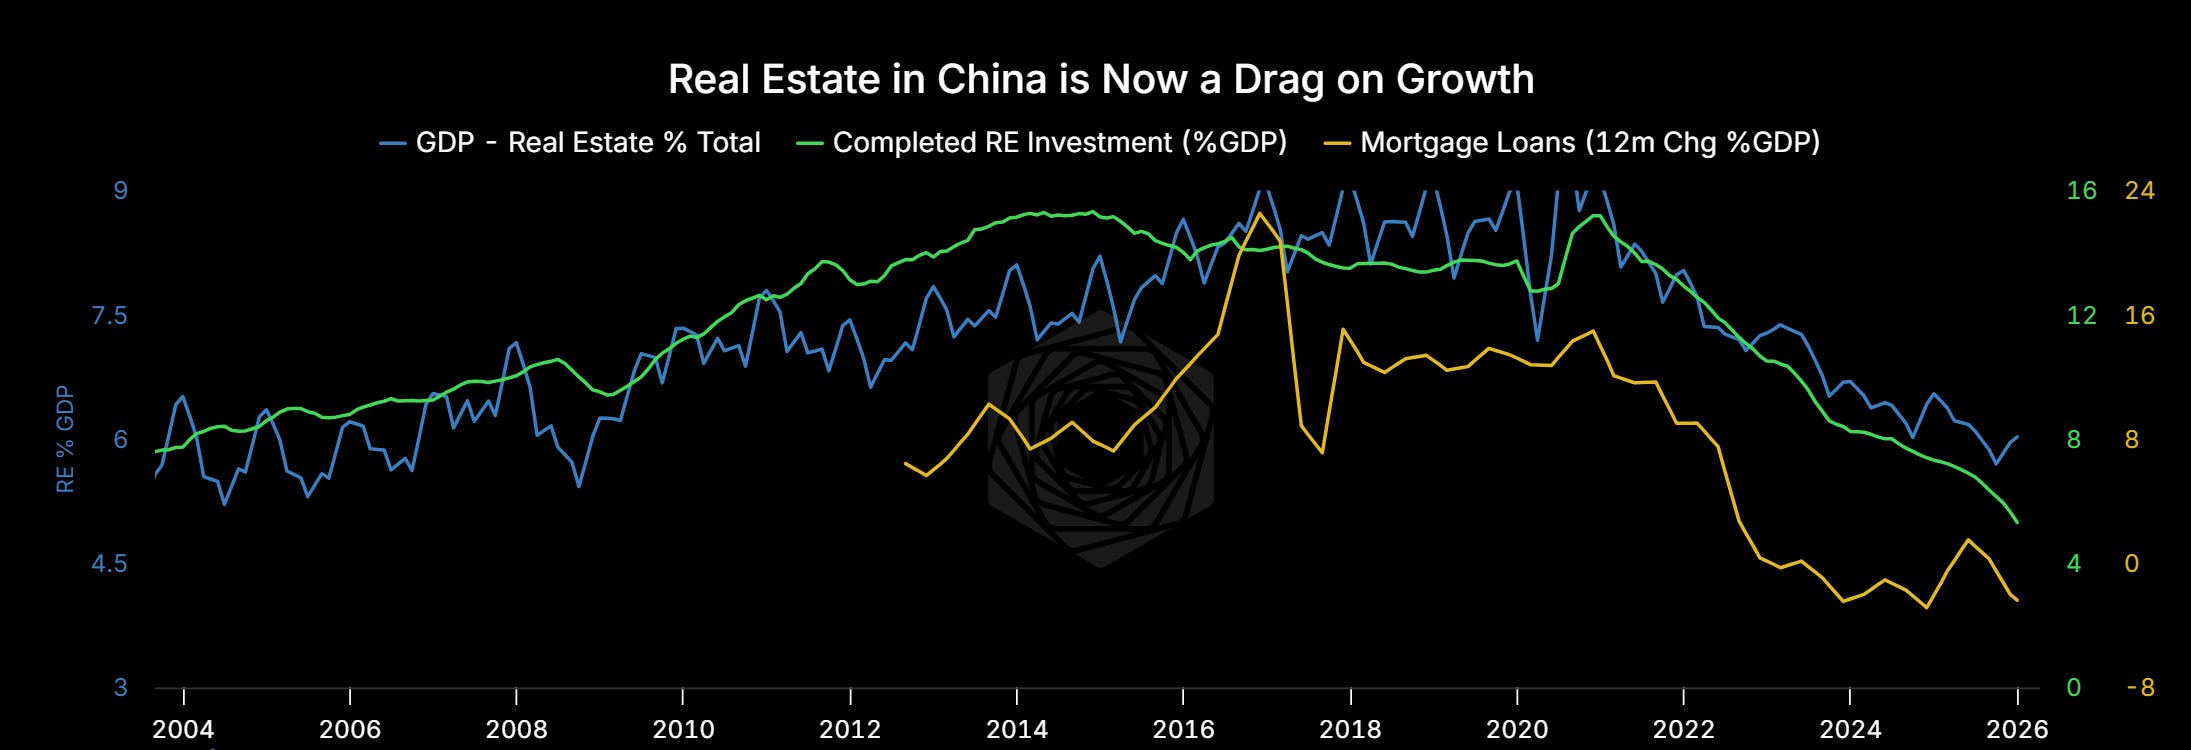
Real estate went from contributing 15-16% of GDP at peak to somewhere around 4-5% now, dragging directly on growth while the mortgage loan share of GDP is still contracting.
II. The Developer Debt Crisis
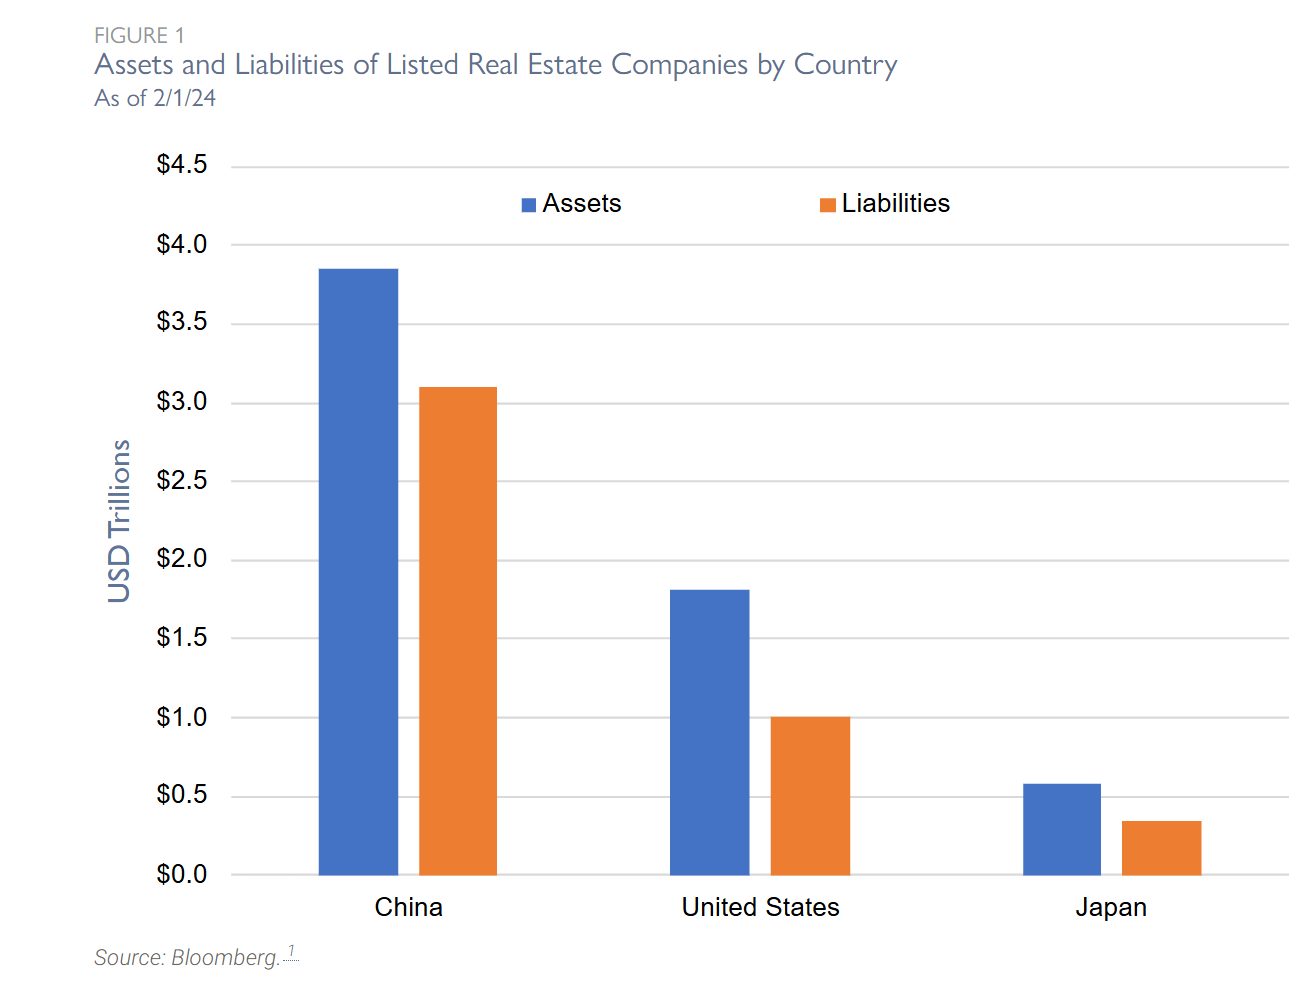
The listed Chinese property developers are, as a sector, more or less finished in their current form. Total assets around $4 trillion, total liabilities around $3 trillion. And those assets are largely land and unfinished apartments worth maybe 50-60 cents of the stated value, while those liabilities are largely bank debt and bonds that need to be serviced in cash.
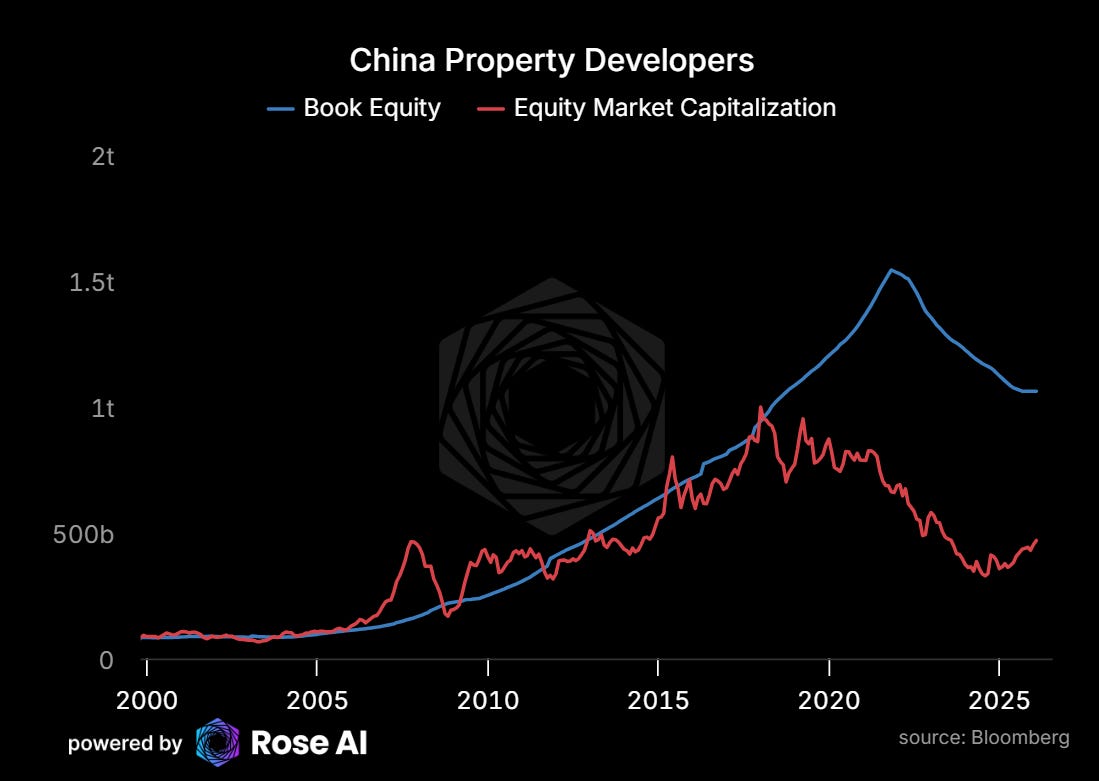
The market cap of Chinese listed developers has collapsed from around $1.2 trillion to somewhere south of $300 billion. That’s more than a correction. The market has effectively declared the entire sector insolvent.
The restructuring terms that have emerged tell you exactly what offshore creditors actually recovered.
Evergrande: Liquidated, January 2024. $19.1B in offshore bonds. The restructuring proposal (2-4% coupon, 10-12 year extension) never actually happened. A Hong Kong court ordered liquidation, and bondholders are looking at 2-3 cents recovery. Loss: 97%.
Country Garden: $17.7B, effective December 2025. Five restructuring options, the most “generous” of which involves a cash buyback at a 90% haircut. The mandatory convertible bonds price conversion at HK$2.60 versus a current share price of HK$0.54. A 380% premium, meaning the equity kicker is essentially worthless. Old coupon 6%, new coupon 2%, term cut to 7.5 years with a 3-year grace. NPV loss at 8% discount rate: 30.7%.
Sunac China: $10.2B, billed by restructuring advisors as the “success story” of Chinese developer restructurings. Six tranches at stepped 5.0-6.25% coupons, PIK for the first two years, plus $2.75B in mandatory convertibles and $1B zero-coupon converts. But the converts are now facing a second restructuring, proposed as equity conversion. NPV loss at 8%: 8.2% on the bonds themselves. But the equity conversion is worth maybe 20 cents. “Success” is doing a lot of work.
Kaisa: $12.3B, effective September 2025. Pre-restructuring bonds trading at 4 cents. Largest sanctioned developer restructuring. NPV loss at 8%: 8.7%.
Shimao: $11.5B, effective July 2025. Coupon cut from 7% to 3.5%, extended to 8 years with a 3-year grace period. NPV loss at 8%: 20.6%.
The offshore bond market tells you everything. Total offshore bonds restructured or in default: roughly $115 billion across ~40 developers since 2021. Recovery rates in the 2-40 cent range depending on who you were and how early you got out.
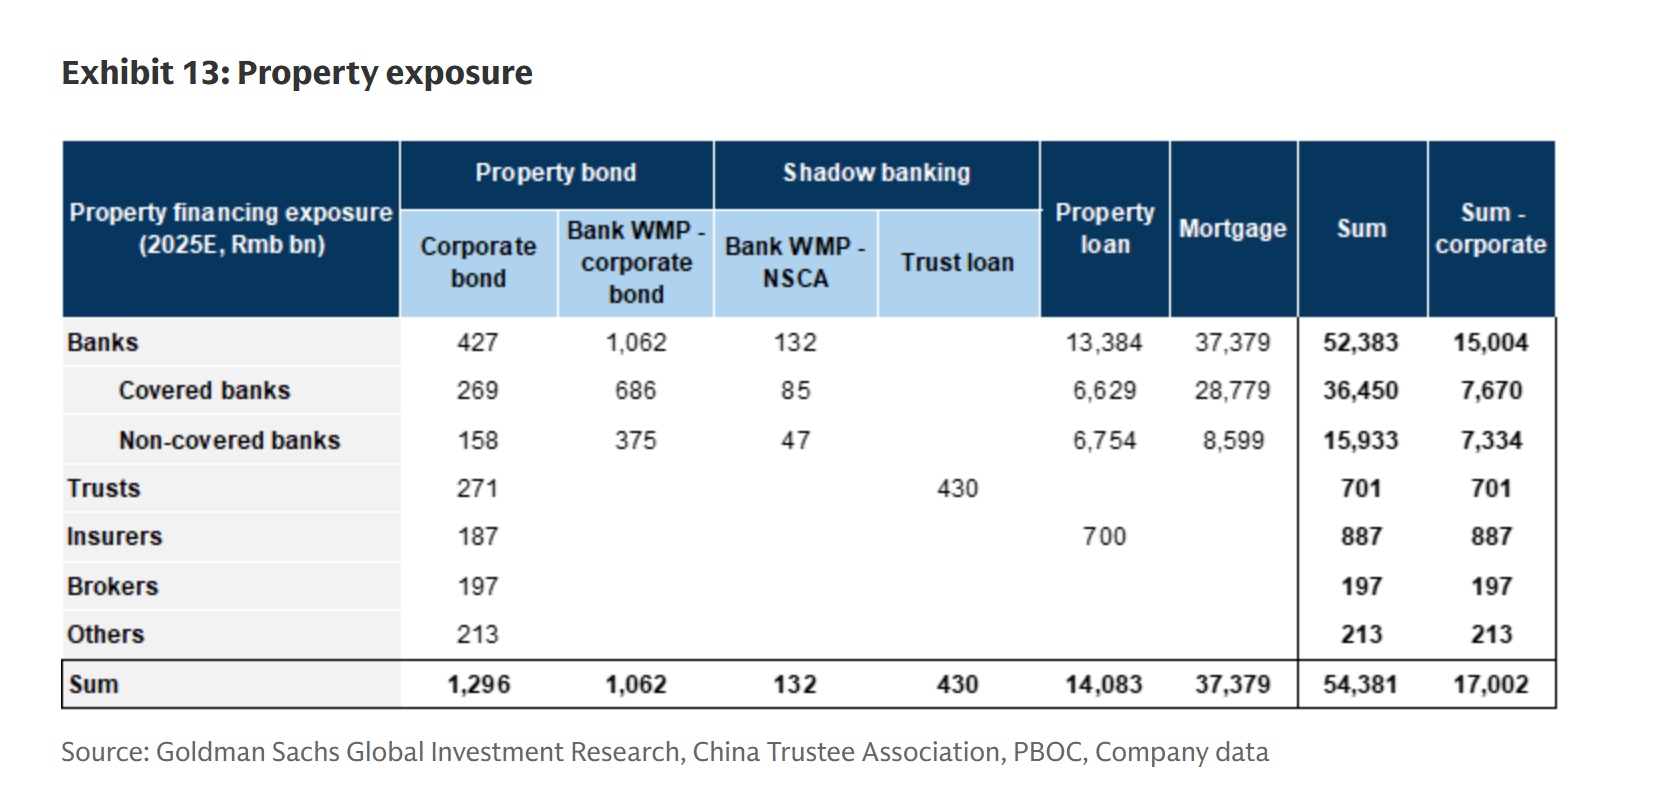
And that’s the offshore bonds. Maybe $115B of a much larger problem. The onshore bank exposure to developers is around RMB 16.7 trillion ($2.3T). Those loans are being rolled, extended, and reclassified at loss rates the market is not pricing.
III. Getting to the Number: Bottoms-Up Loss Estimates
The frustrating thing about the China banking thesis is that nobody credible has published a single comprehensive loss estimate for the whole system. Goldman Sachs published a good stress test in December 2025, but it only covers property and mortgages. BBVA’s annual banking monitor has the best data but pulls every punch in its conclusions. Everyone is looking at one leg of a four-legged table.
So here’s our bottoms-up. Five categories, each with base and stress assumptions drawn from actual restructuring terms, market prices, and where available, official stress test results.
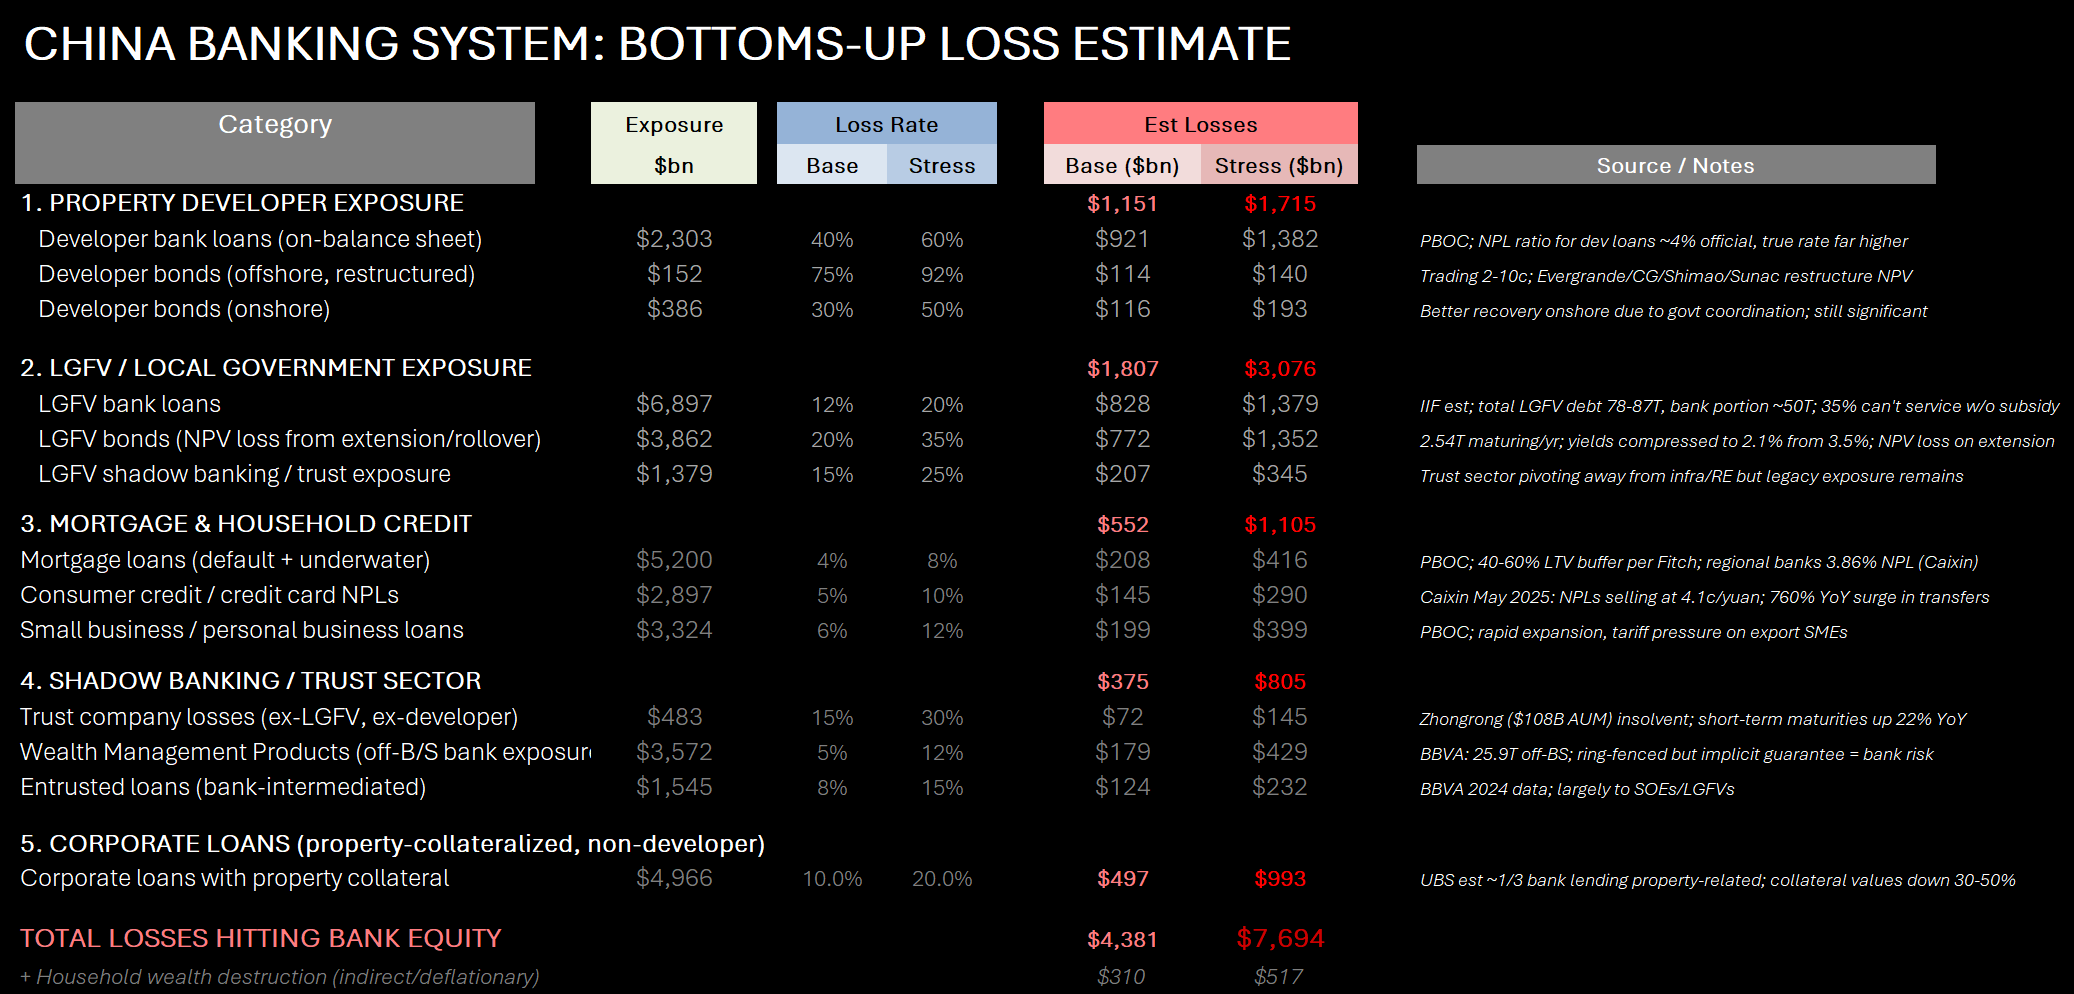
A few notes on the assumptions, because the assumptions are the argument.
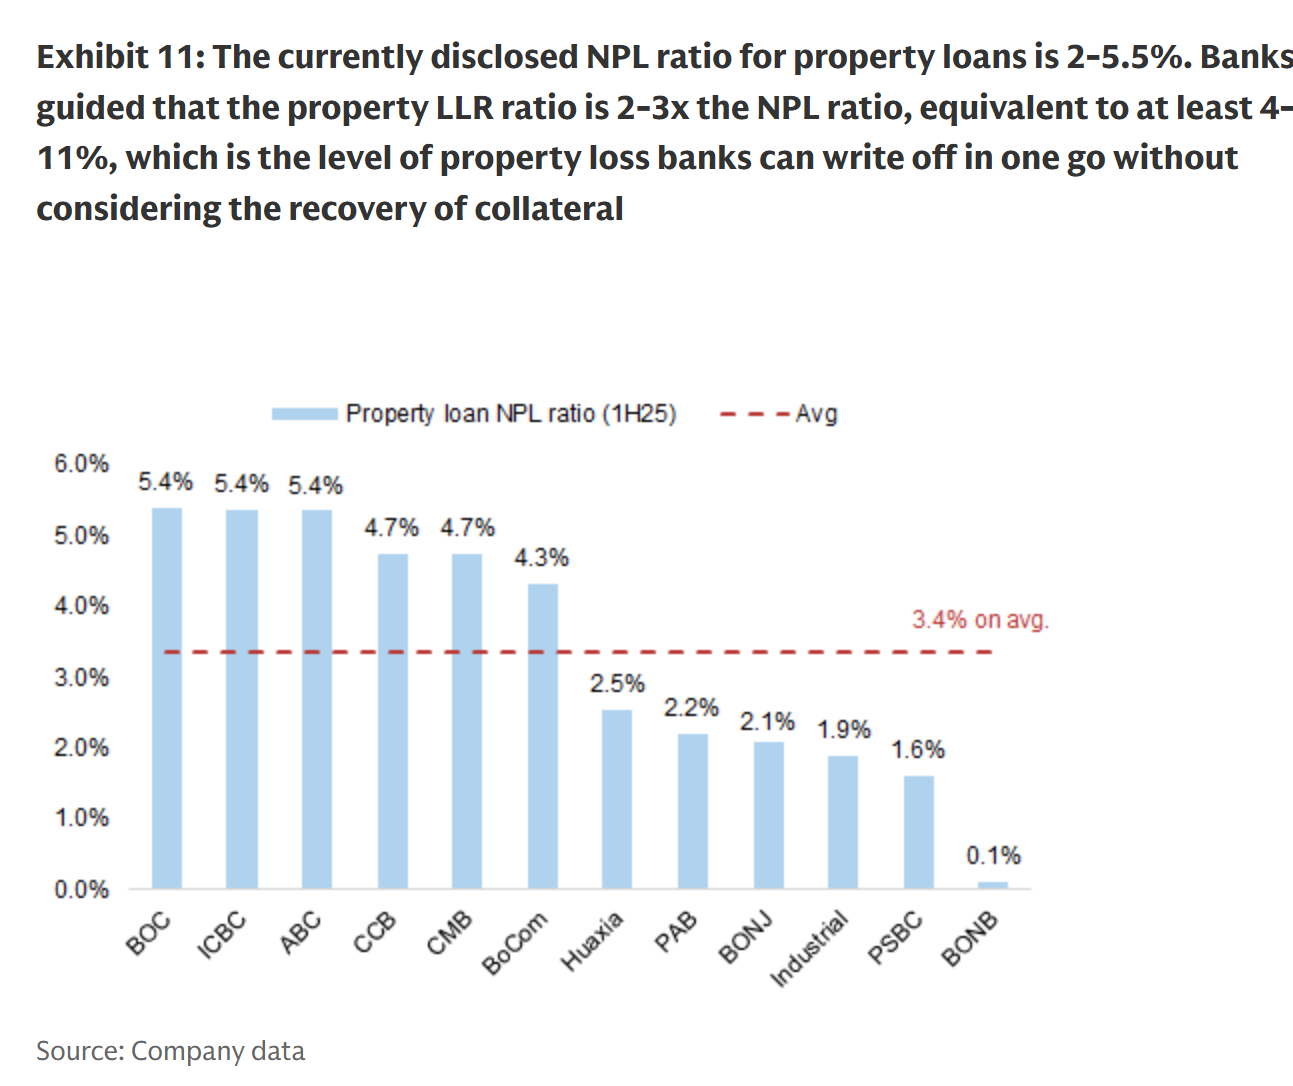
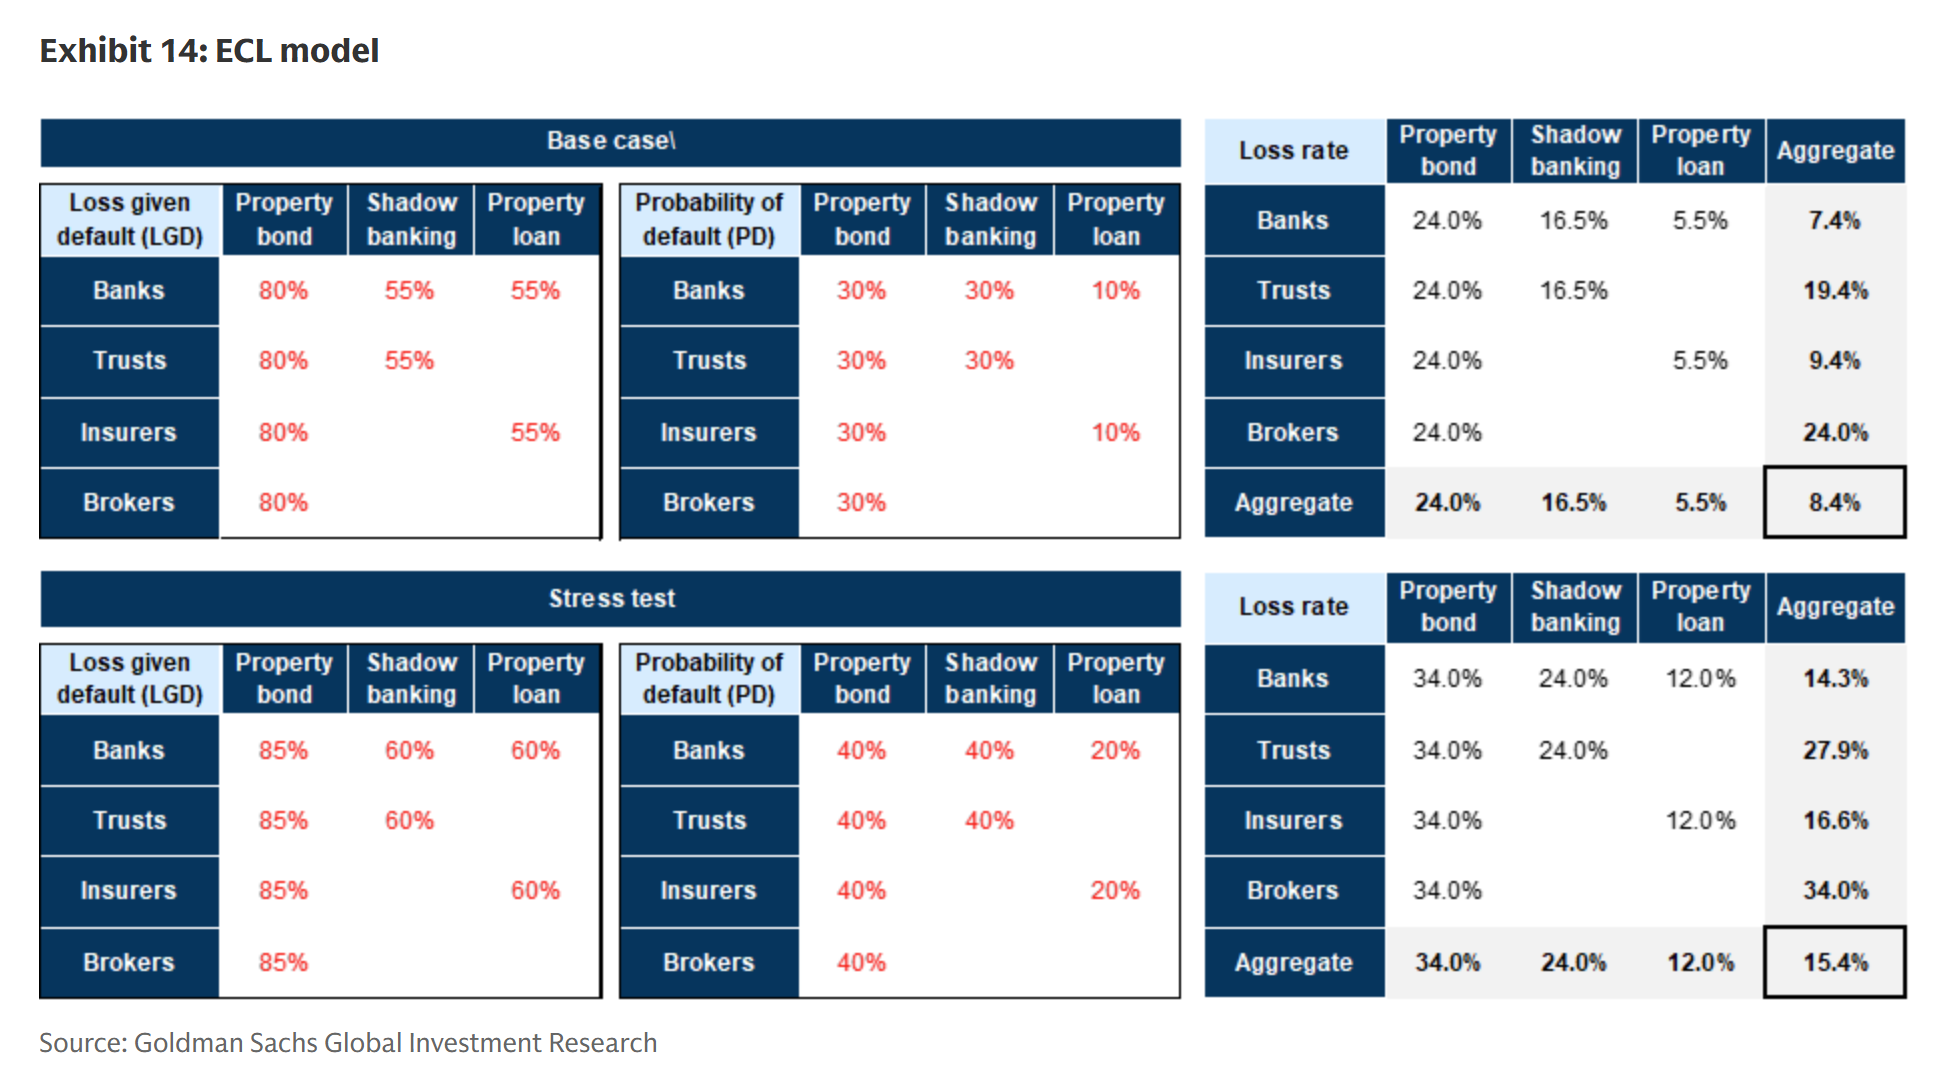
On developers: the 40-60% loss rate on RMB 16.7 trillion in on-balance-sheet bank loans is anchored to actual recovery rates. Personal NPLs are selling at 4.1 cents on the yuan as of May 2025 (Caixin). Offshore developer bonds are trading at 2-40 cents. Goldman’s own stress test uses 5.5-12% loss rates on property loans, roughly four times lower than what the market is actually pricing. The gap between GS and us isn’t methodology. It’s whether you believe the official NPL classification or the market price.
On LGFV: this is where the bottoms-up analysis is most uncertain, but also where the losses are largest. More on this below.
On mortgages: GS’s stress scenario generates 2.4-3.6% NPL ratios by 2027 on a 30% price decline. We’re using 4-8% base/stress loss rates on $5.2T in mortgages, which is consistent with GS’s own stress test outcome.
IV. What Are the LGFVs Actually Doing
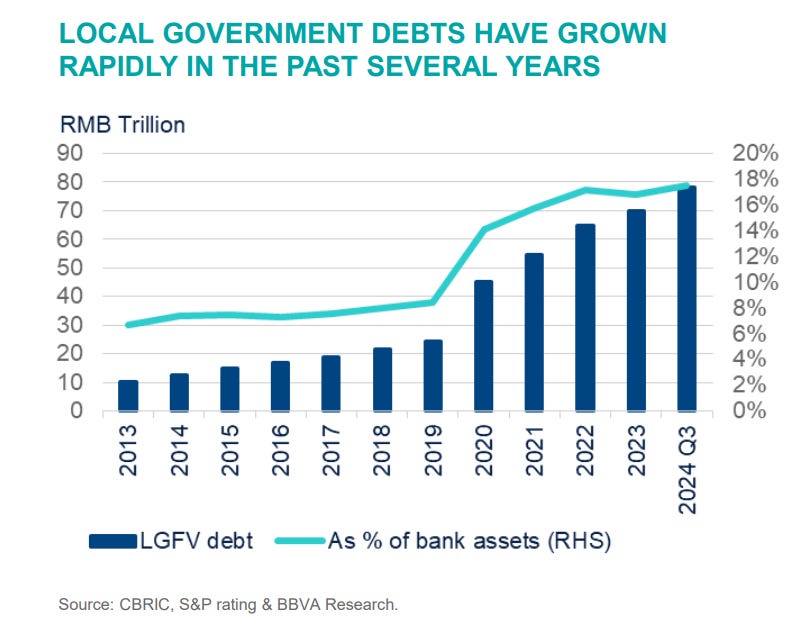
Local Government Financing Vehicles are the part of this story most people miss. And it’s the biggest piece. Most Western analysis focuses on the developer crisis. The LGFV problem is bigger.
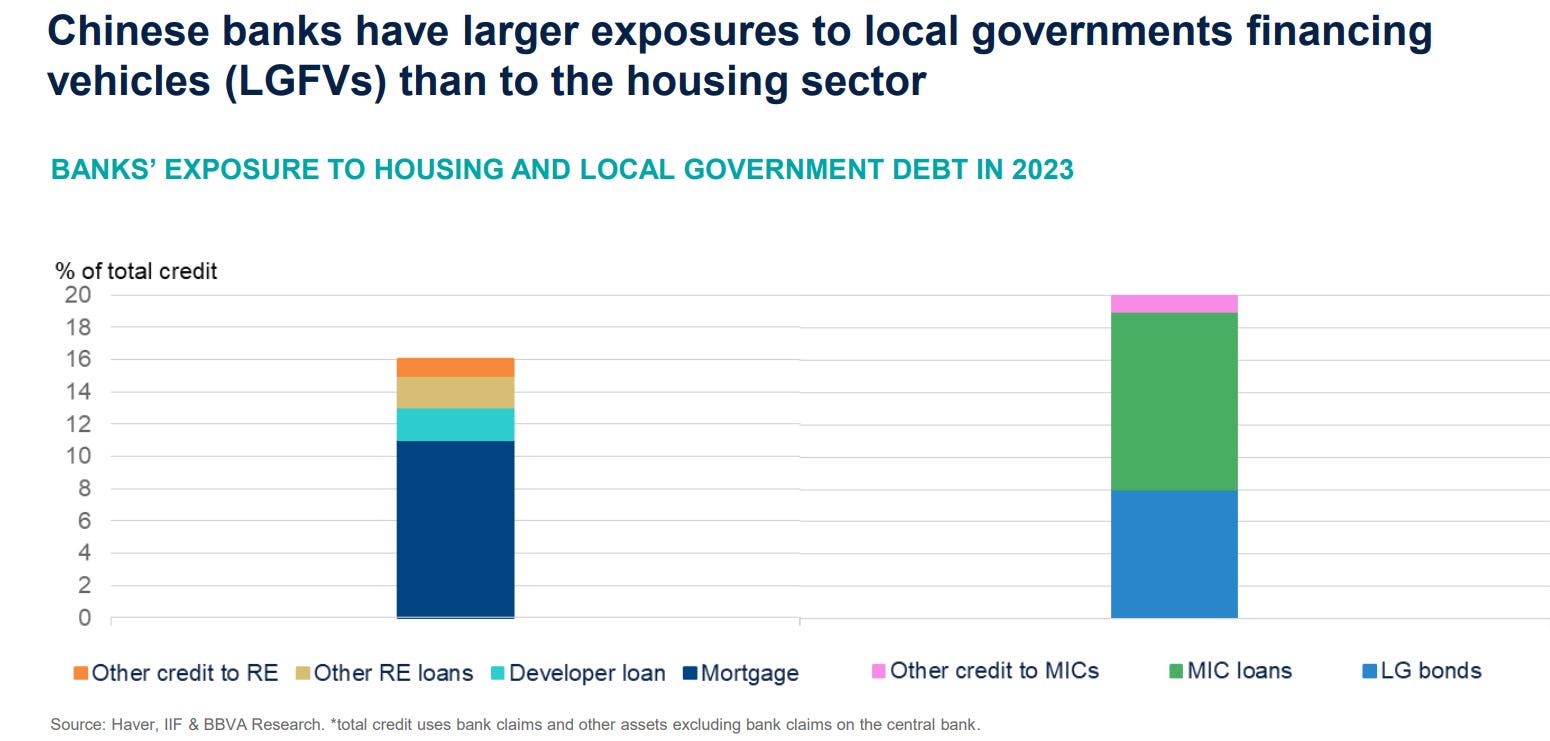
Total LGFV debt: RMB 78-87 trillion depending on which estimate you use, equivalent to around 58-65% of GDP. For context, that’s grown from roughly RMB 10 trillion in 2013. Banks now have more exposure to LGFVs than to the housing sector directly.
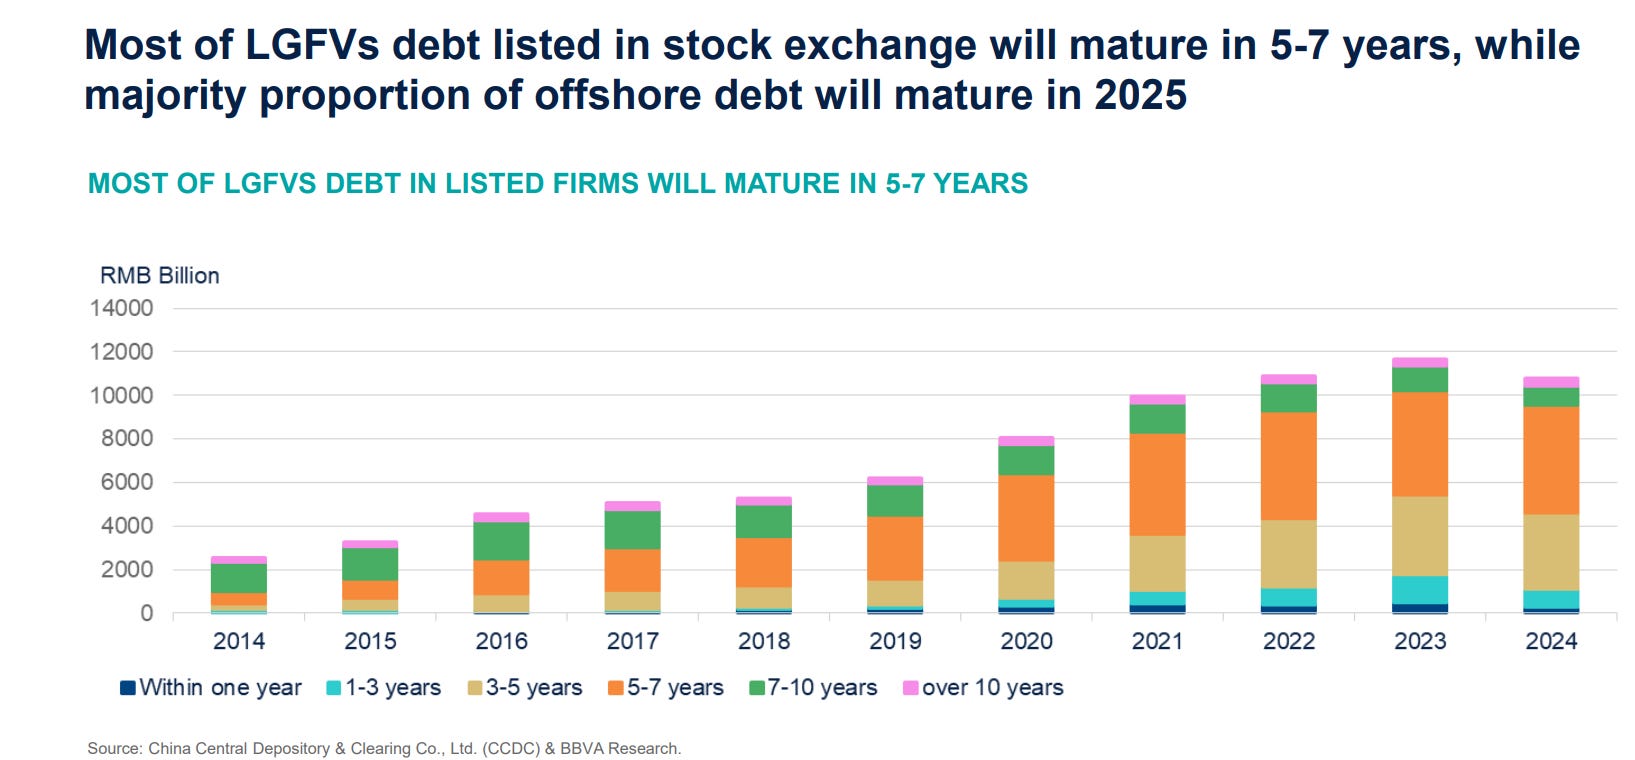
The debt is coming due. Most of it matures in 5-7 years. A lot of the offshore portion was due in 2025. Offshore maturities surged 69% to $48.2B this year. The maturity wall is not abstract anymore.
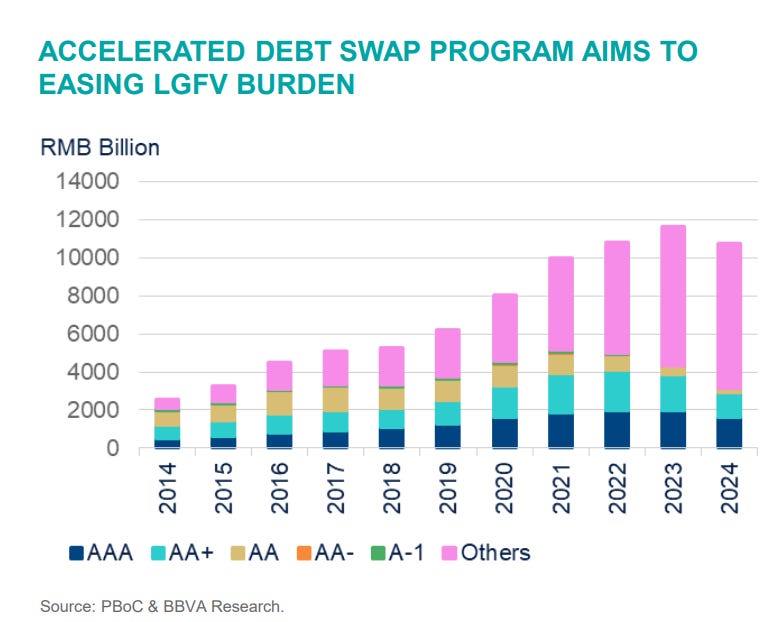
Here’s the part that needs a second to sink in. The credit profile of these LGFV bonds is almost entirely made up of a category called “Others,” meaning unrated. The AAA/AA bucket is a small fraction of the total issuance. This is a $12+ trillion credit market where the majority of bonds have no formal credit assessment.
And then there’s the yield engineering that happens at issuance, documented with unusual specificity by Bloomberg. An LGFV issues a bond at 8%, but the bank registered in the British Virgin Islands buys it at ¥93 (not ¥100), receives a ¥7 “consultation fee” later, and the investor gets a 16% effective yield despite the stated coupon. The LGFV gets ¥93 net proceeds while reporting an 8% borrowing cost.
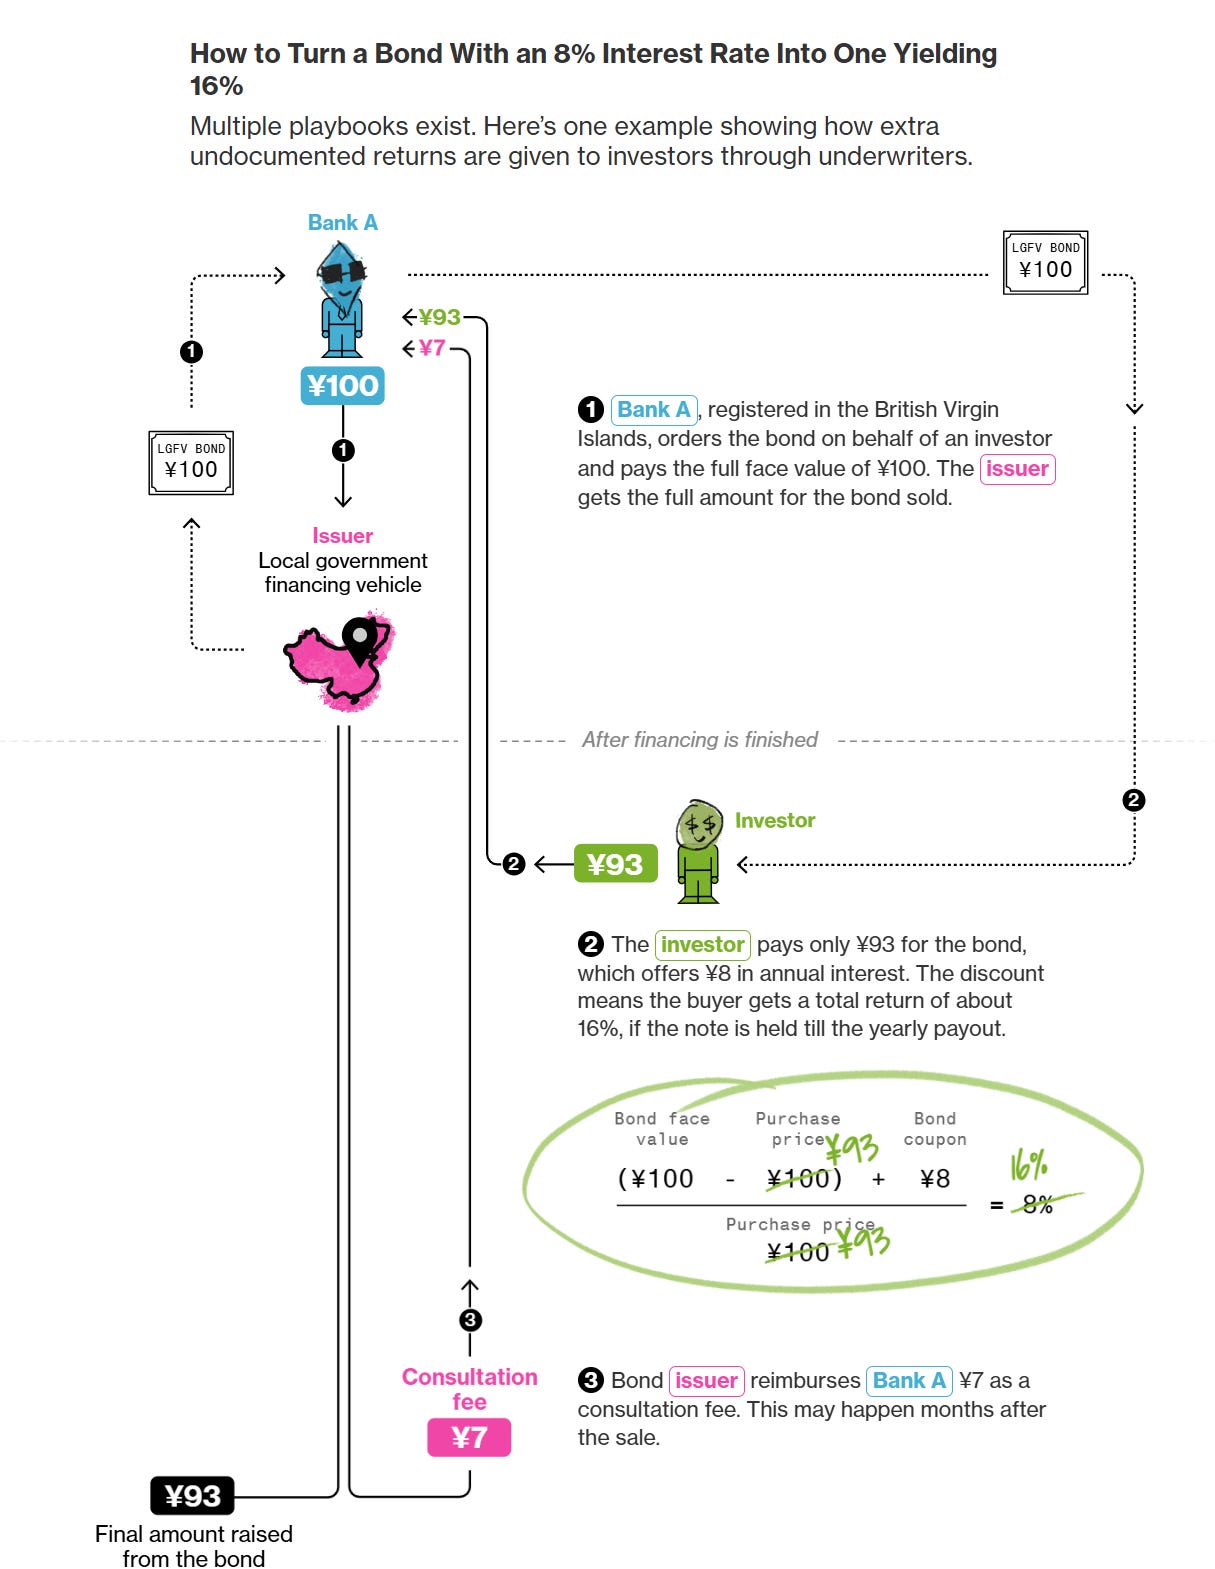
The consequence: the real cost of LGFV borrowing is systematically higher than what’s reported. You can’t trust the face rate on these bonds. The actual yields investors were demanding, once the secondary market adjusted, were consistently 300-800bps above the stated coupon.
Now the 10 trillion debt swap program arrives to fix this. And here’s the part that makes me want to flip tables.
The swap moves LGFV debt onto local government balance sheets as lower-cost bonds. But who buys those bonds? The same banks that held the LGFV loans. Bank lends to LGFV at 4%, LGFV can’t pay, government issues a bond at 2.5%, bank buys the bond. Bank now earns 2.5% on the same underlying credit risk instead of 4%. That’s 150bps of NIM compression per year, per renminbi swapped. On 10 trillion yuan, that’s about 150 billion yuan ($21B) in annual income the banks no longer collect. Every year. Forever.
Don’t call it a rescue. It’s a structured bail-in of bank earnings.
V. The NPV Destruction
Most loss estimates for the LGFV sector look at default probability, but the more important number is the NPV loss embedded in the restructuring terms. These loans aren’t defaulting. They’re being extended under political pressure at below-market rates. That destroys value without creating a reported NPL.
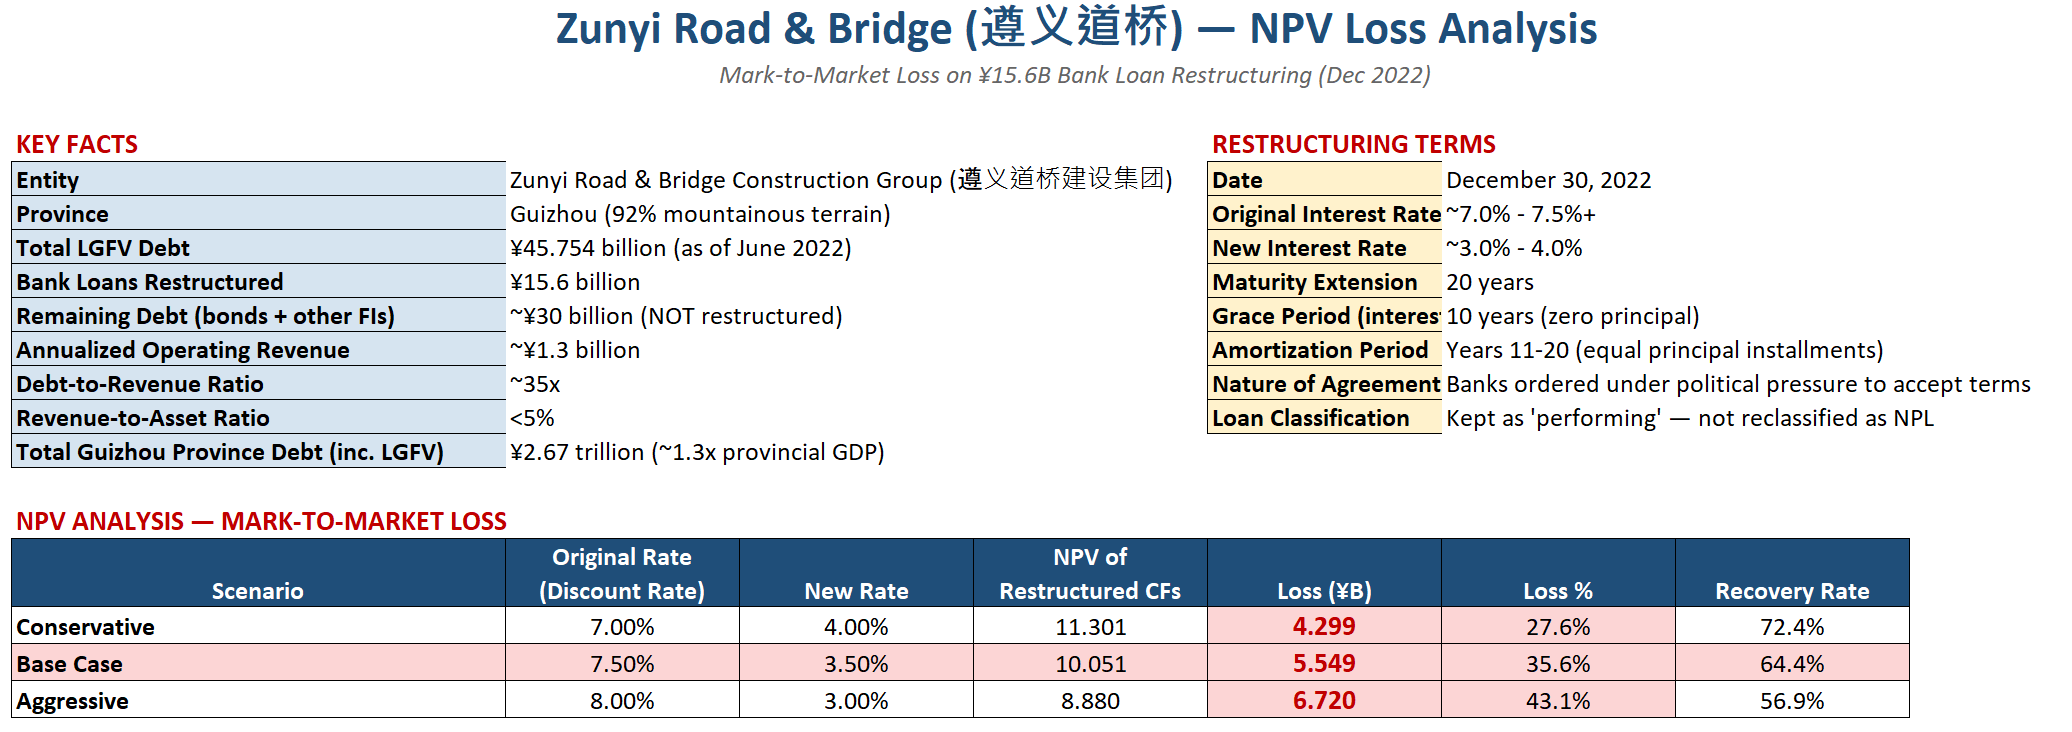
The Zunyi Road & Bridge restructuring from December 2022 is the template case and the most fully documented.
Zunyi Daoqiao sat within Guizhou province's roughly RMB 1.6 trillion in total LGFV debt. The bank loans (RMB 15.6B) were restructured from 7-7.5% to 3-4%, extended to 20 years with a 10-year interest-only grace period. Debt-to-revenue ratio: 35x. Revenue-to-assets: less than 5%. This entity cannot service its debt under any realistic scenario, but the loans are kept classified as “performing.”
NPV loss on the Zunyi restructuring at a 5% discount rate: 15.8%. At 7.5%: 35.6%.
Apply the Zunyi template systemically:
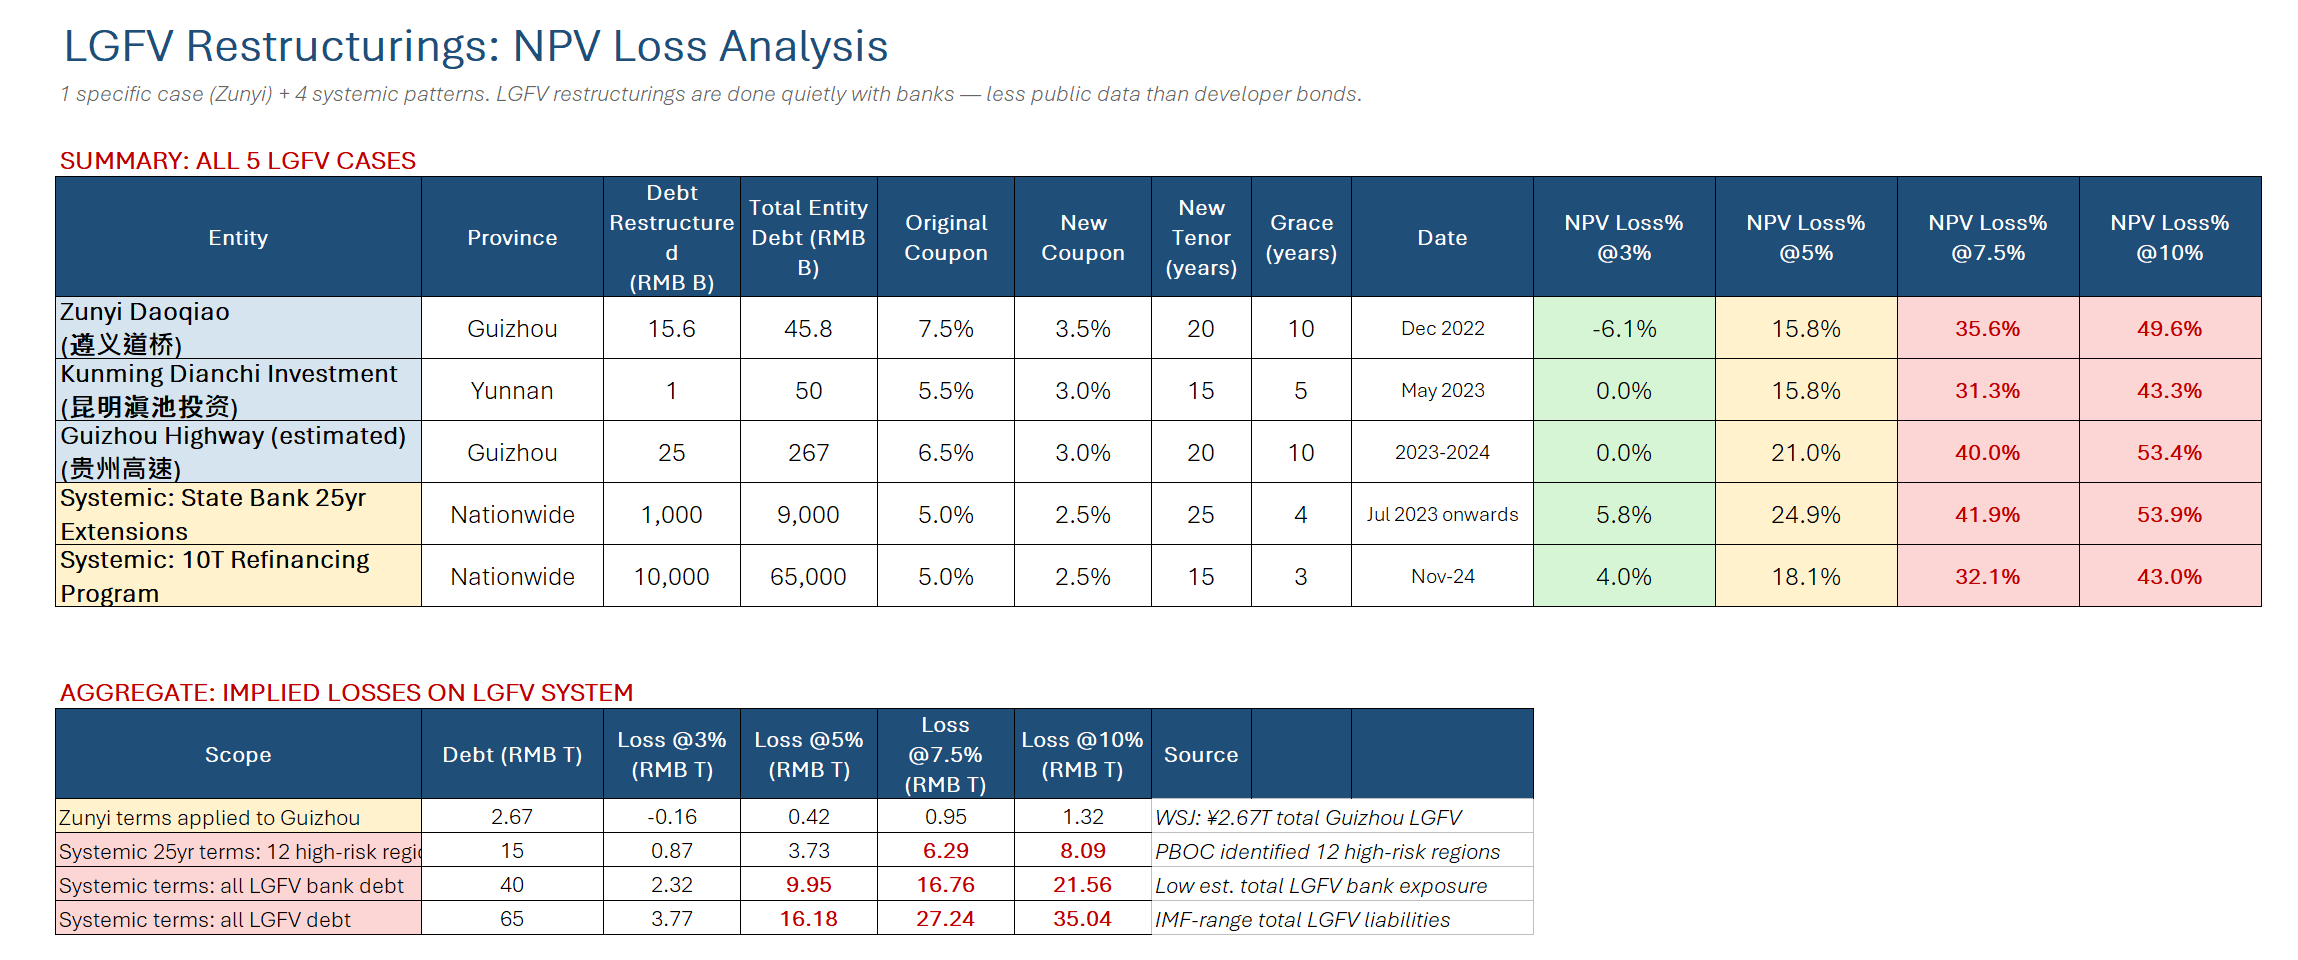
The state bank 25-year extension program (which moved RMB 1 trillion of high-risk LGFV debt to 25-year paper at 2.5%) destroys 24.9% of NPV at a 5% discount rate. Applied to the 12 PBOC-identified high-risk regions (around RMB 15 trillion in total LGFV debt), you get $515B-$1.1 trillion in invisible NPV destruction depending on your discount assumptions.
The 10 trillion refinancing program announced in November 2024 destroys 18.1% NPV at 5%. That's RMB 1.8 trillion (~$255B) in value destruction that appears nowhere in any official statistic and isn’t in any analyst’s loss estimate.
Which is why our LGFV estimates are probably understated. The base case 12% loss assumption is below the most conservative NPV scenario from actual restructuring terms. Even at a 5% discount rate, the losses are 16-25%. Which means the corrected base case is probably $5.0-5.5 trillion, not $4.4 trillion.
A note on the gap between the 35x debt-to-revenue ratio (which implies most LGFV loans can’t be serviced without perpetual subsidy) and our 12% base case loss rate: the 12% accounts for partial government backstop, some operational revenue recovery, and collateral value on the better-quality LGFVs. The Zunyi case is the worst of the worst. But even adjusting for the healthier half of the LGFV universe, the corrected numbers above suggest the base case is materially higher than $4.4 trillion.
VI. Capitalization: How Big Is the Buffer?
Let’s look at what the system has available to absorb these losses.
The nominal buffer exceeds the base case loss estimate. This is what the bulls point to.
Here’s the problem: you cannot deploy all of the equity. Banks are required to maintain minimum capital adequacy ratios — roughly 9% blended Tier 1 for the big banks, 8% for the rest, plus G-SIB surcharges and TLAC requirements (though the latter can be partially met with eligible debt instruments, so actual equity lockup is somewhat lower). All told, the regulatory floor locks up approximately $4.1 trillion. The actually usable buffer: residual equity above CAR minimums, plus provisions, plus the announced recap, is closer to $2.8 trillion.
This is the framing that matters: we’re not asking whether total buffers cover total losses. We’re asking how big the shortfall is between total losses and the capital the system must maintain in order to keep functioning under regulatory minimums. That shortfall (call it the recapitalization gap) is roughly $1.1 trillion in the base case and $4.4 trillion under stress.
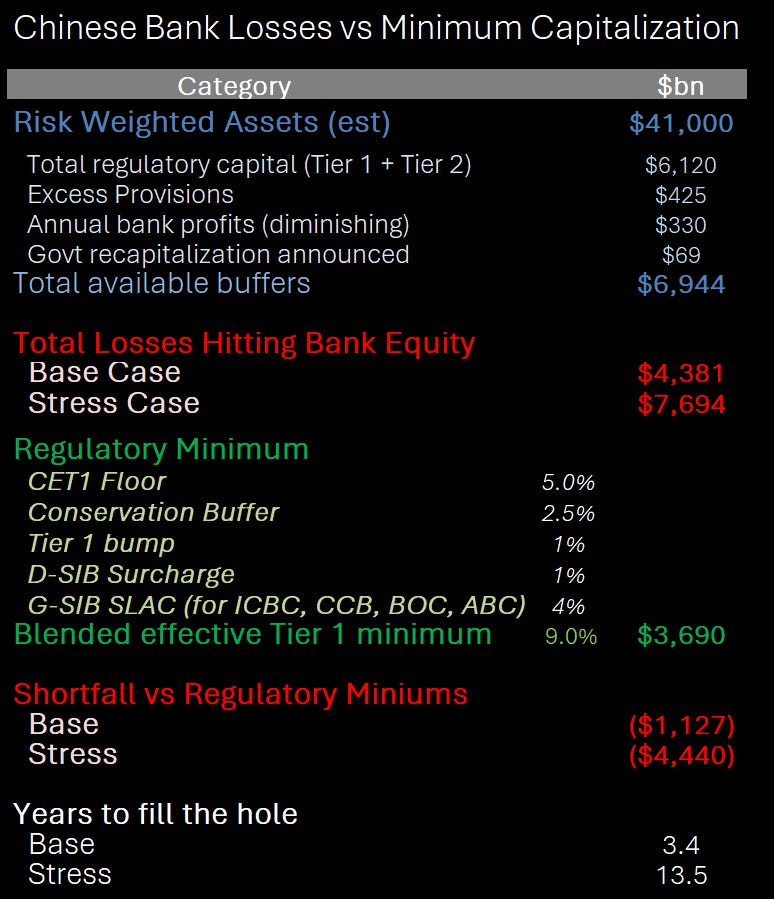
Note: annual profits of ~$330B appear in the buffer total as a one-year flow and serve as the denominator for years-to-fill. The earn-through timeline assumes continued annual generation at this rate, which is optimistic given NIM compression toward $250B by 2027.
And this is exactly why the reflexivity matters. In the base case — calm markets, no panic, steady NIM — 3.4 years is survivable. Painful, but survivable. That’s the bet Beijing is making with the blood transfusion strategy: keep things quiet, let the banks earn it back, and nobody has to know how close the system came. The problem is that the stress case isn’t some theoretical exercise. It’s what happens when the market figures out the base case numbers. The moment confidence breaks, 3.4 years becomes 13.5 years, the recapitalization gap quadruples, and the earn-through math becomes impossible.
Classic Soros reflexivity. If everyone stays calm, the losses are manageable. If they panic, the losses become unmanageable. The entire strategy depends on making sure the market never does the math we just did.
The large commercial banks sit at 18% CAR, comfortable. Rural commercial banks are at 12%, just above the regulatory floor. The PBOC’s own stress test from 2022 showed the nearly 4,000 smaller banks’ aggregate CAR getting cut from 11.91% to 6.00% under stress. On a per-bank basis, 64% of small banks would breach regulatory minimums. Beijing’s own numbers confirm the thesis. They just buried it in a stress test nobody reads.
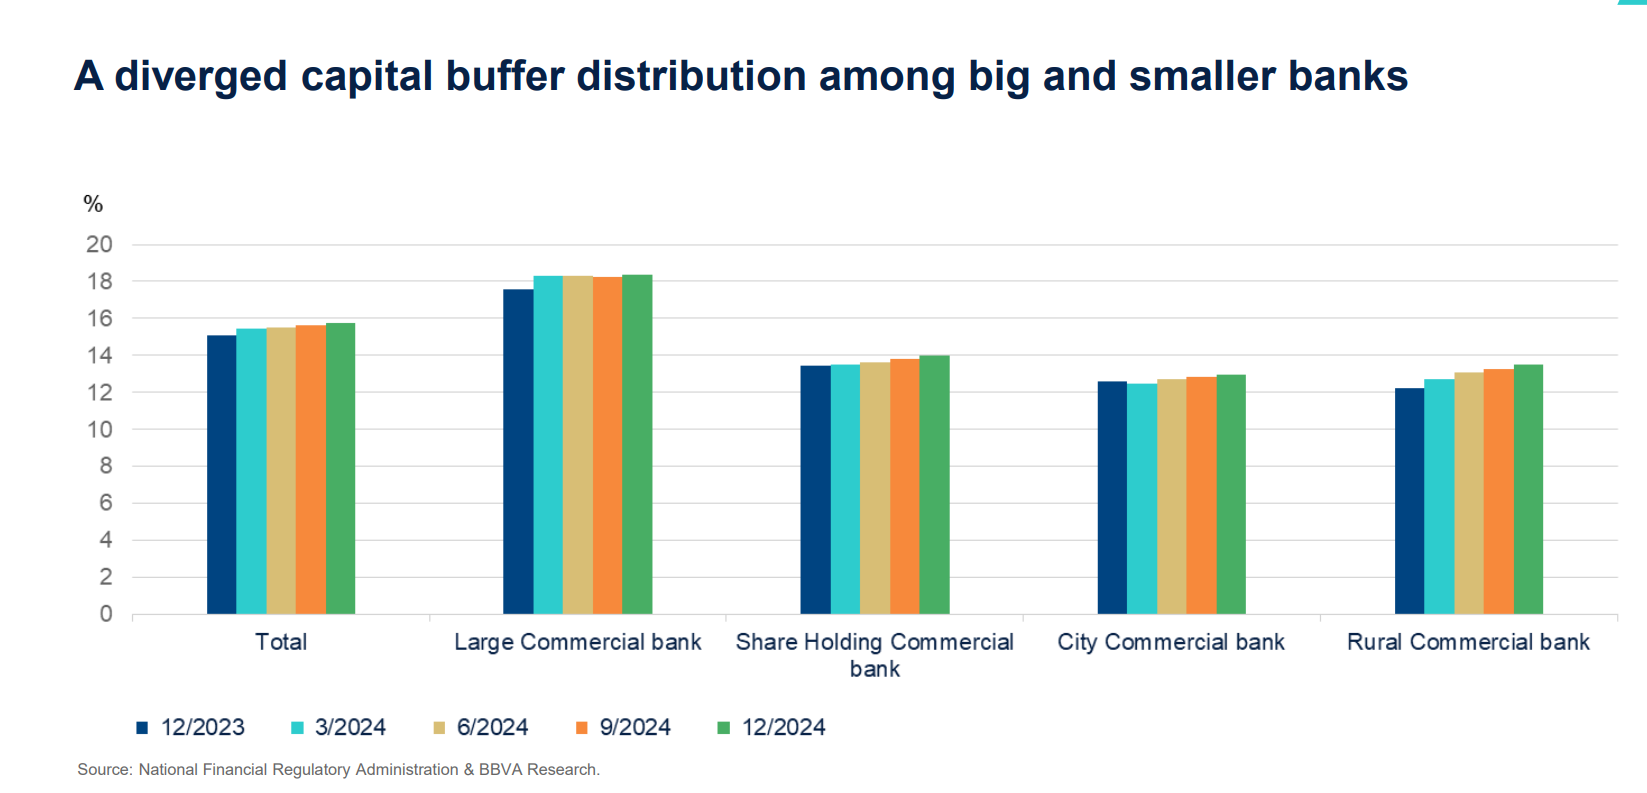
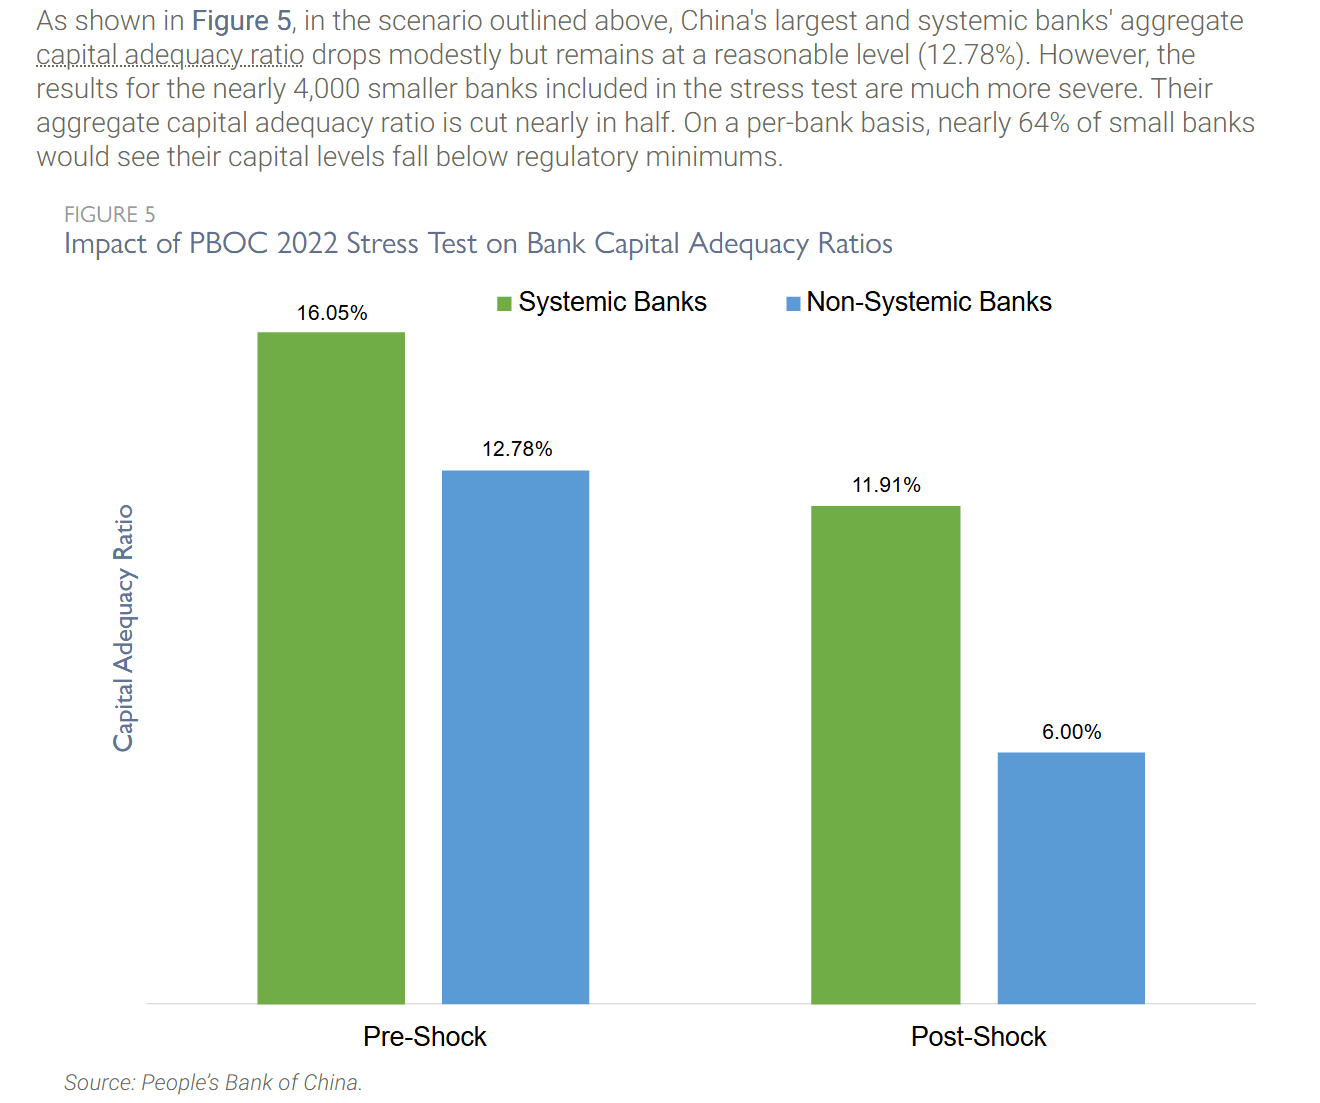
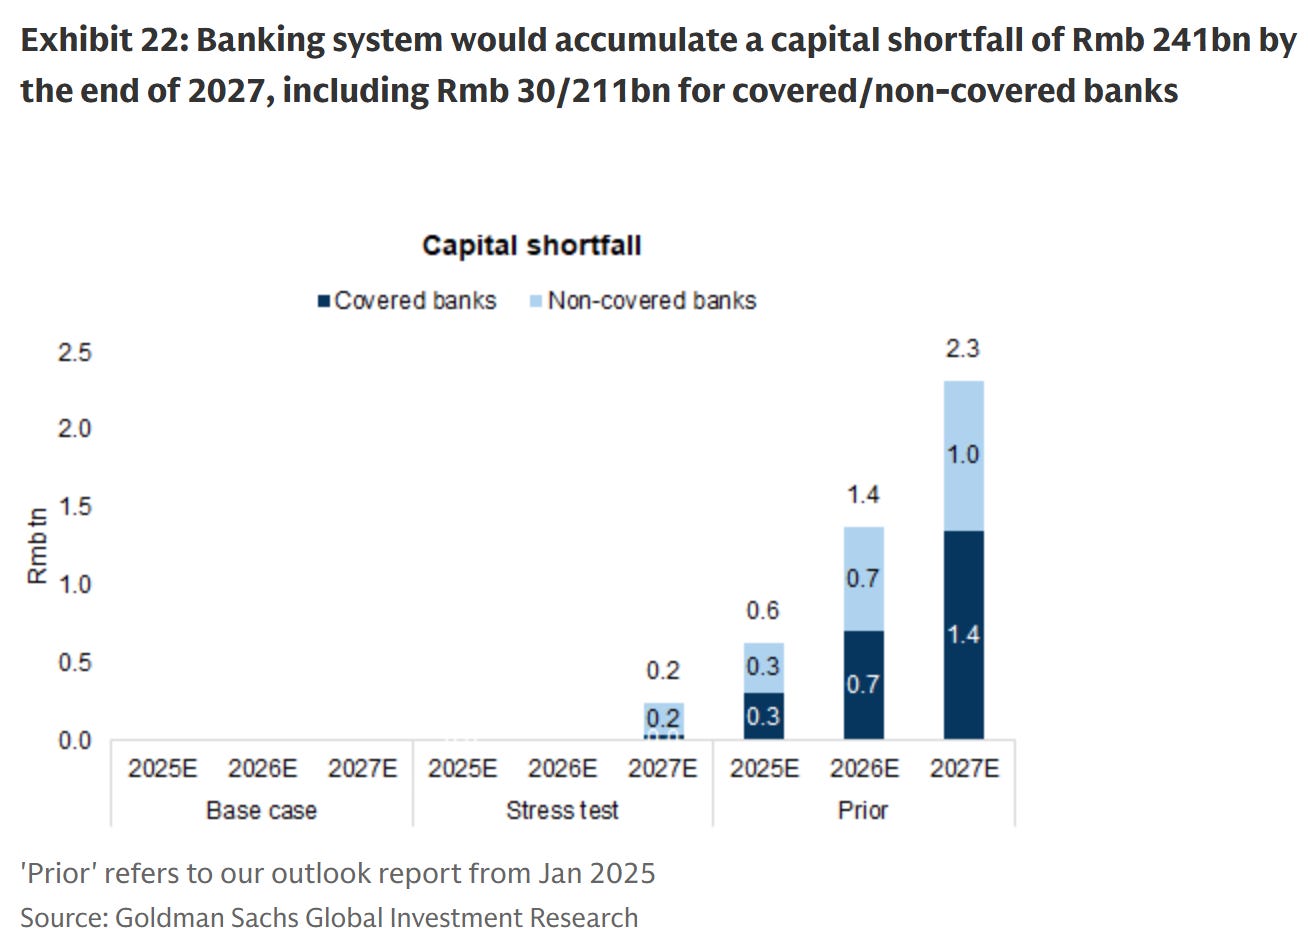
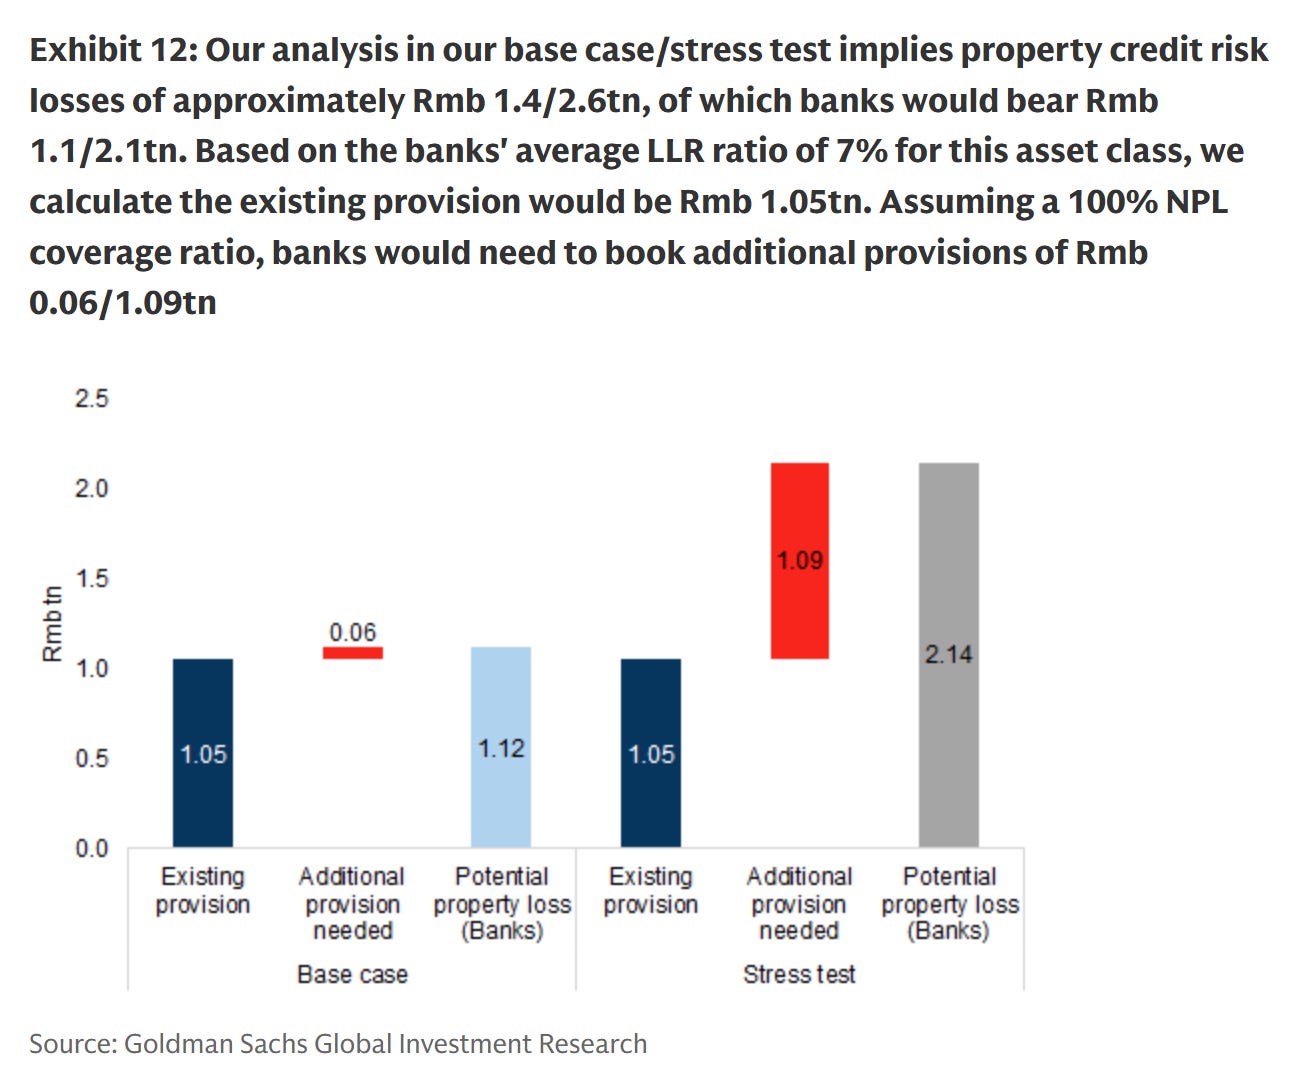
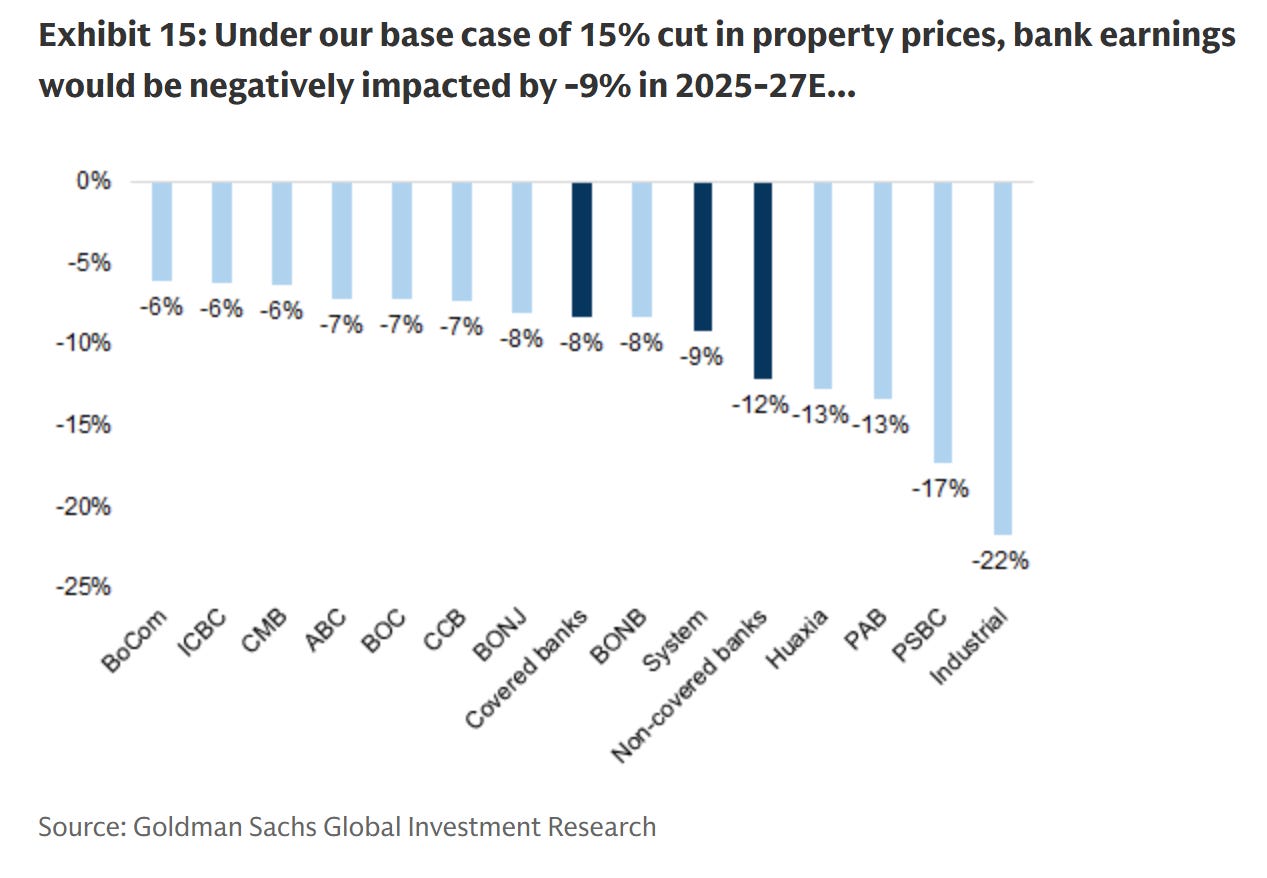
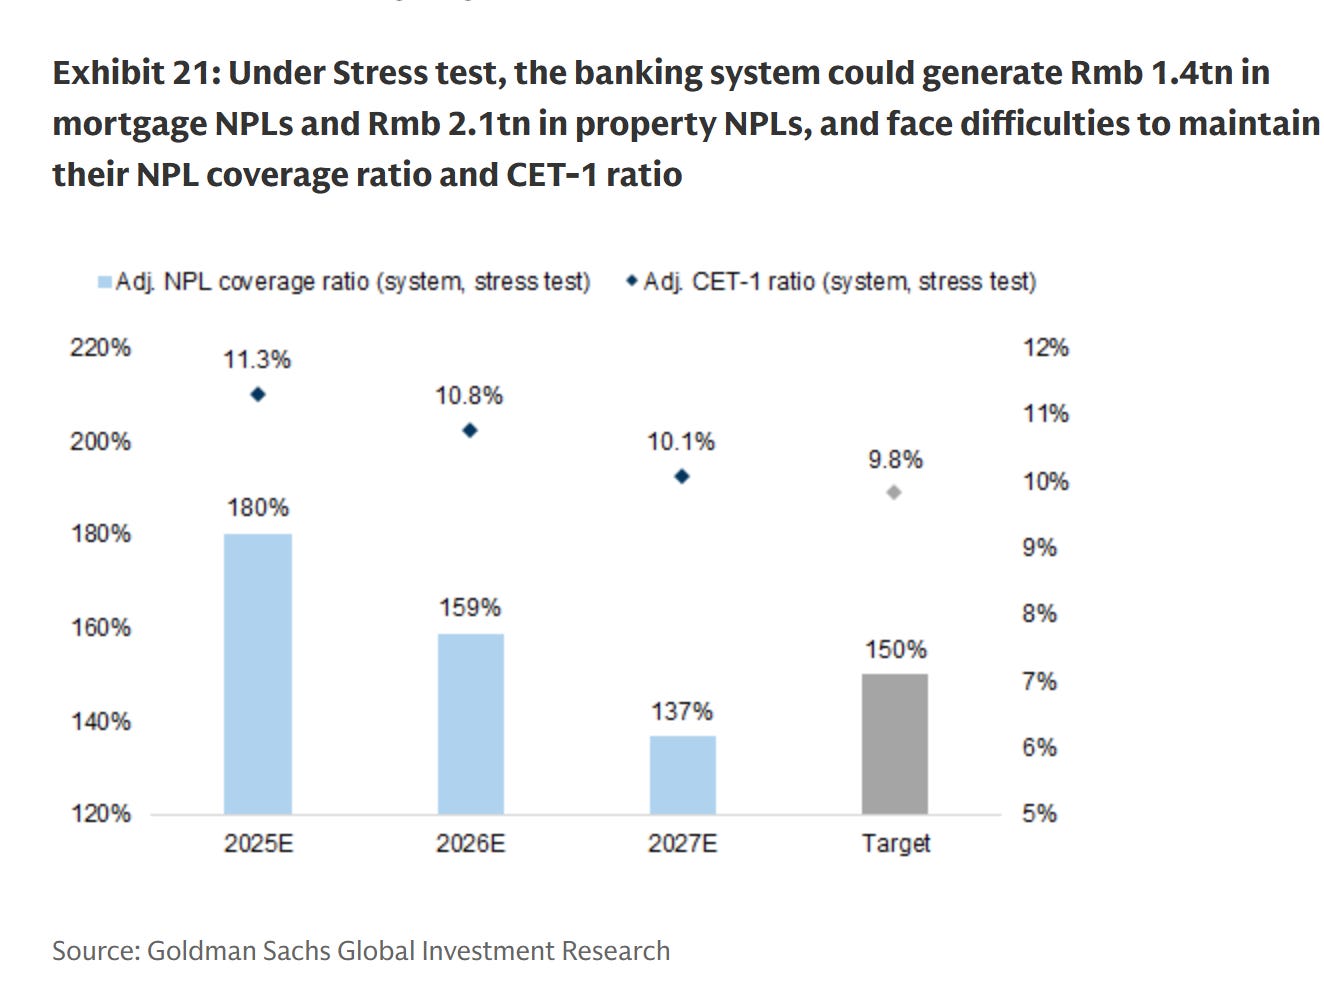
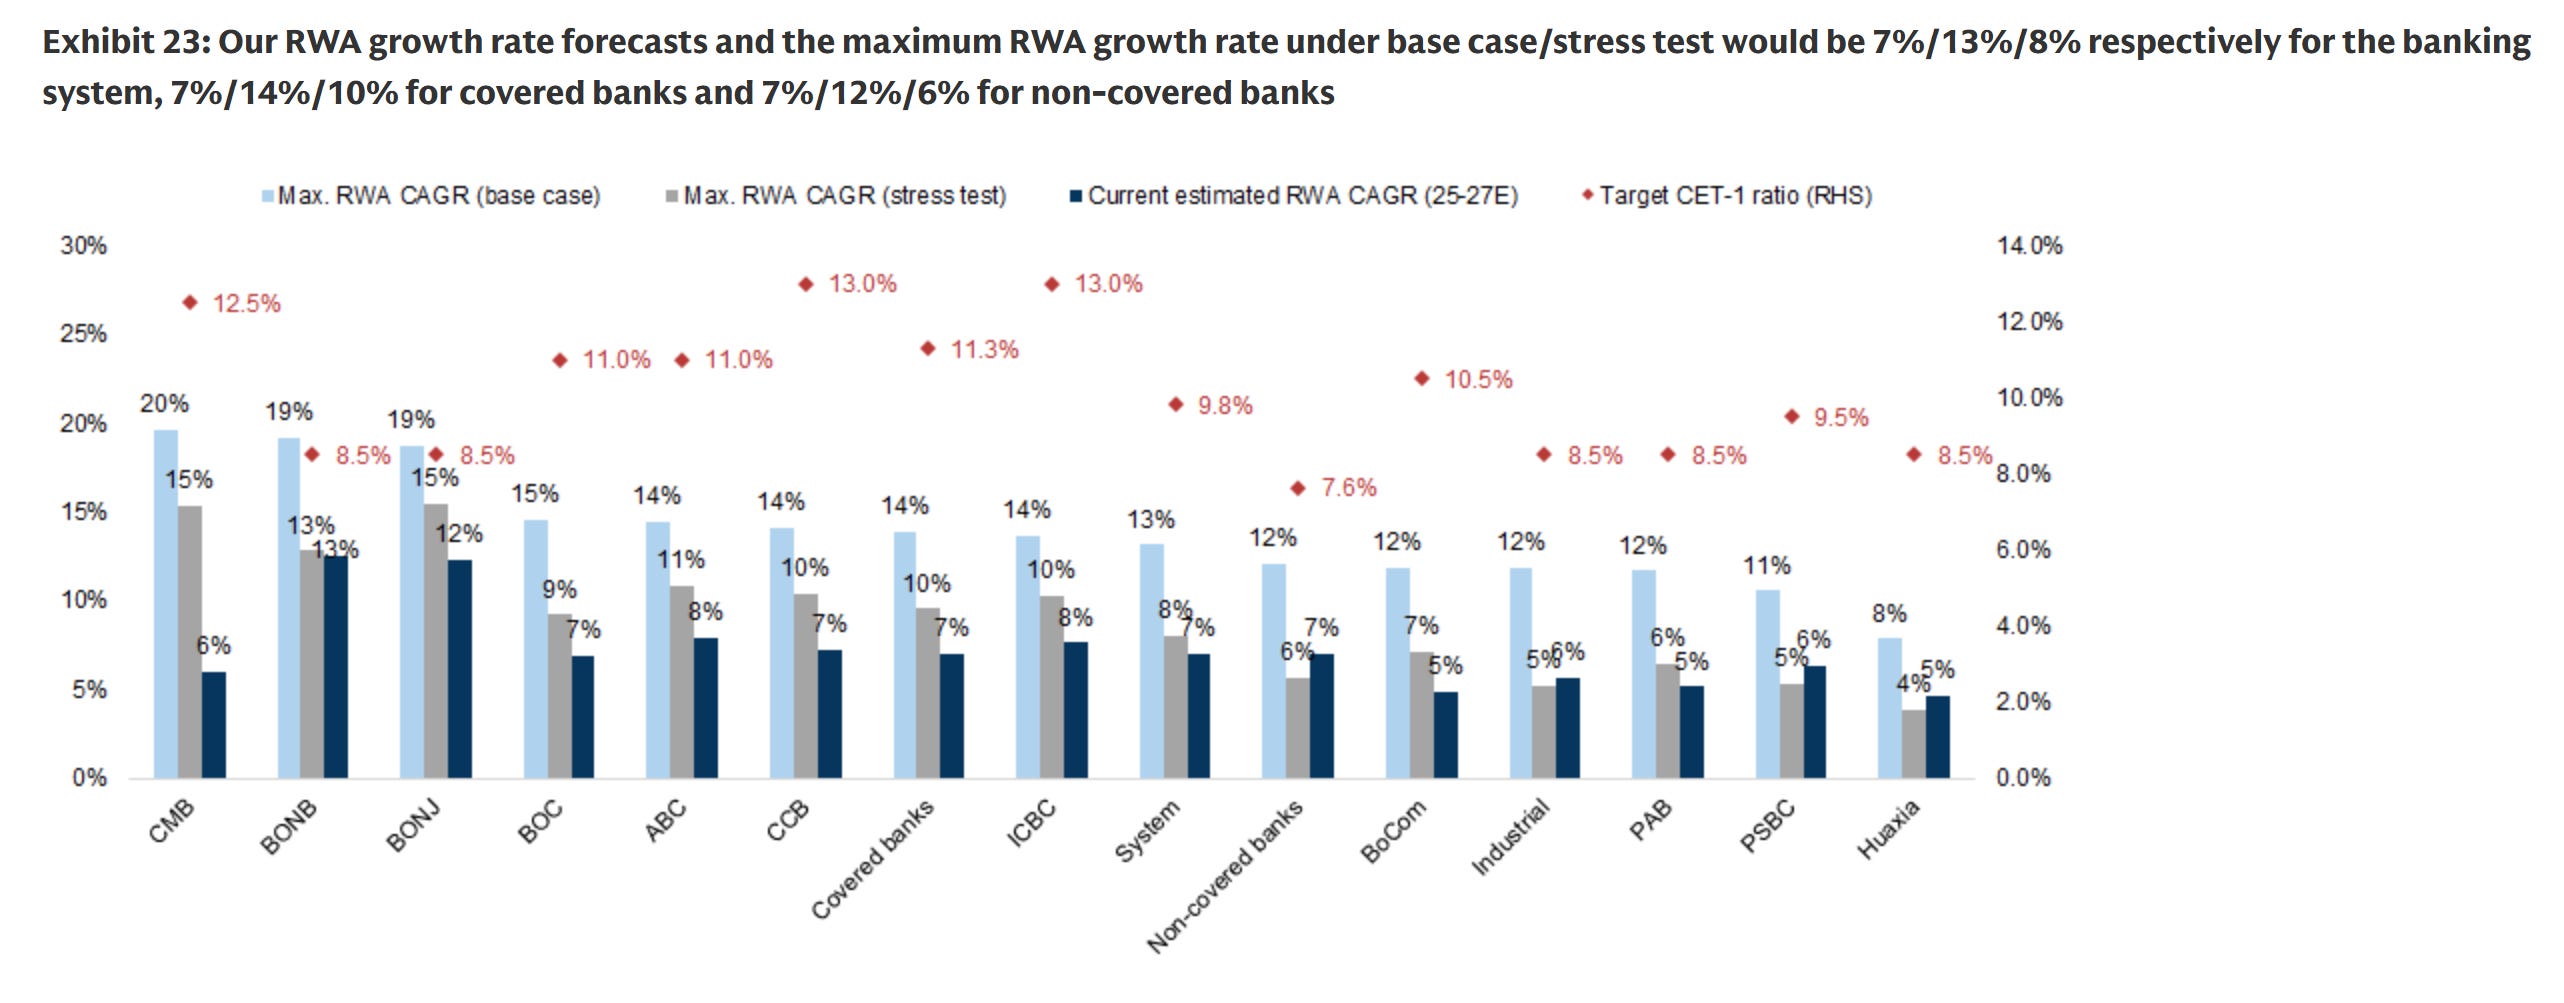
Goldman Sachs, in their December 2025 China bank outlook, estimates a capital shortfall of RMB 241B by end of 2027 under their stress scenario. That’s just for property and mortgages. Their base case shows bank earnings cut by 6-22% at individual banks, with Industrial Bank taking a 22% hit.
The problem with the GS analysis isn’t the math. Their math is fine. The problem is they’re only testing one dimension of a multi-dimensional problem. Their capital shortfall of $33B is, relative to the actual hole, the kind of number you’d produce if you decided upfront how bad things could possibly look and worked backwards.
VII. The Strategy: Extend, Pretend, Consolidate
Given all of the above, what is Beijing actually doing? The answer isn’t complicated, and the policymakers are arguably not wrong to be doing it. It’s just that the math has to work, and it isn’t working.
Three pillars.
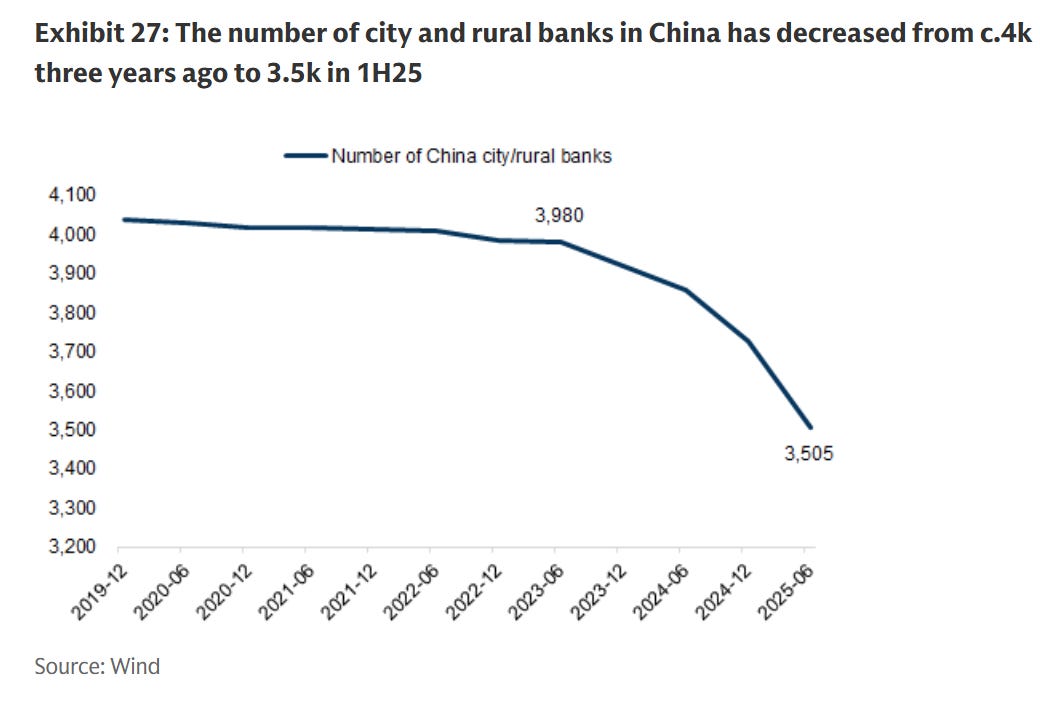
Pillar 1: Merge the zombies into the survivors. 290 small banks merged in 2024, versus 70 in the entire 2019-2023 period. Rural commercial bank NPLs running at 2.9%, nearly double the system average. ROA at 0.6%. These are functionally insolvent institutions, and the government is forcing the Big 5 and large joint-stock banks to absorb them. The purpose is to prevent a disorderly failure, but the mechanism concentrates bad assets onto stronger balance sheets and drags down system profitability.
4,000 city/rural banks in 2022. 3,500 by mid-2025. The consolidation is accelerating.
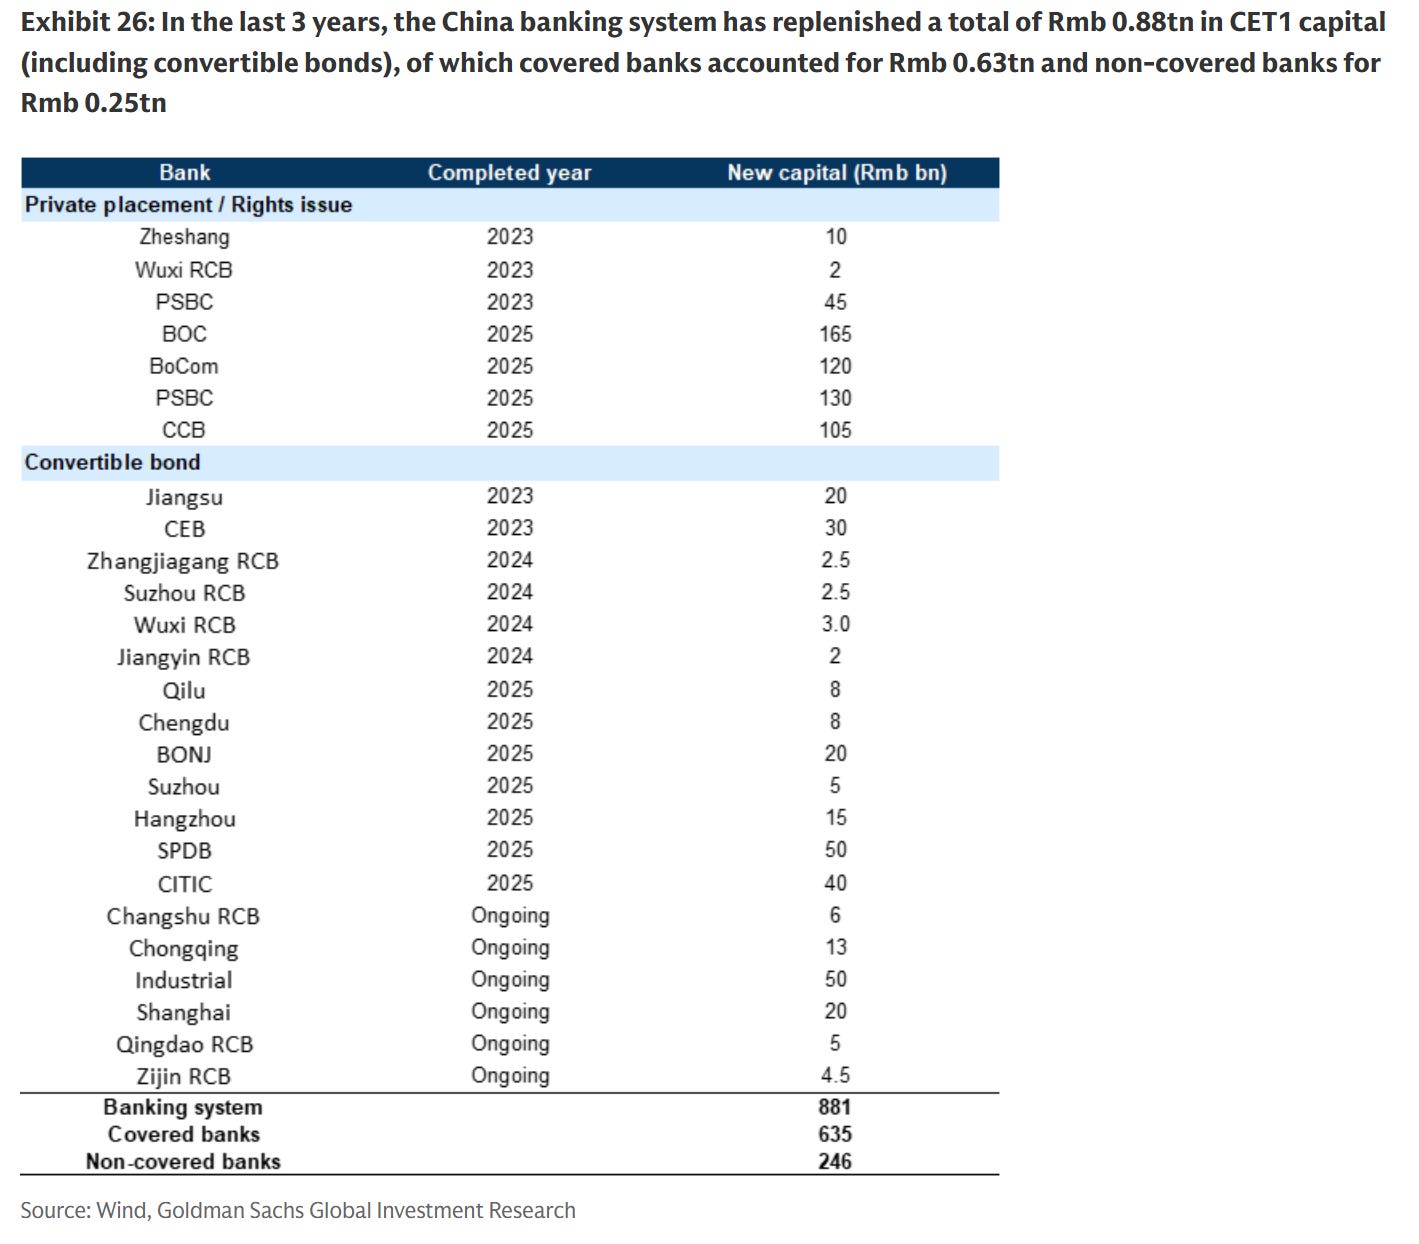
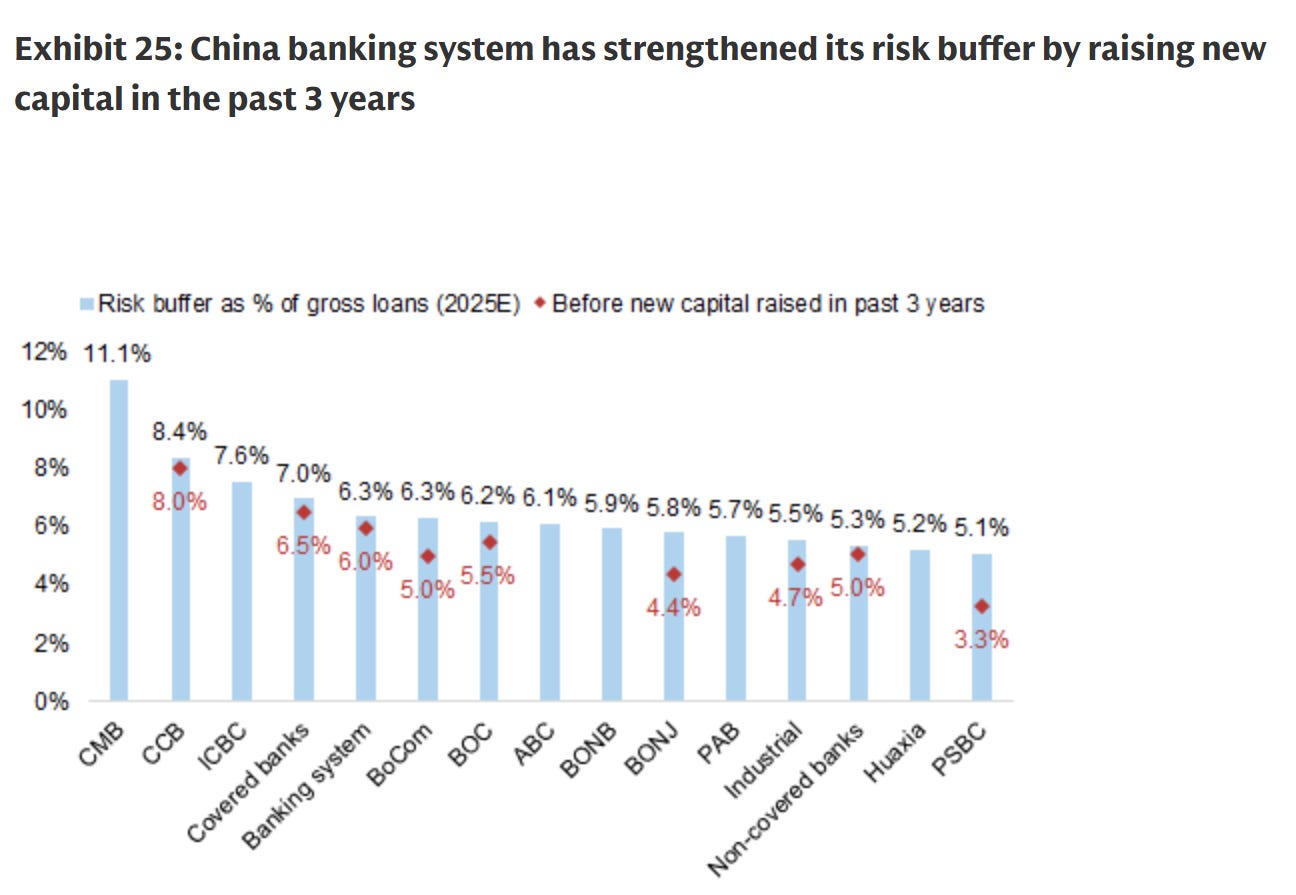
Pillar 2: Recap the survivors with enough capital to signal stability. In the last three years, the banking system has raised RMB 881B (~$124B) in new CET1 capital (RMB 635B for covered banks, RMB 246B for non-covered). That sounds like a lot, until you realize the hole is $4.4-7.7 trillion. The recap is about keeping capital ratios above regulatory minimums, not about actually closing the gap.
Pillar 3: Keep the stock market from knowing. This is the constraint nobody talks about, and it’s probably the binding one. Bank stocks are the old-economy anchor of the Chinese equity market. If you force recognition of true losses, if you make banks mark their LGFV and developer books to something approaching market value, you tank bank stocks. That triggers margin calls across an interconnected financial system where banks hold each other’s equity, insurers hold bank bonds, and pension funds hold both.
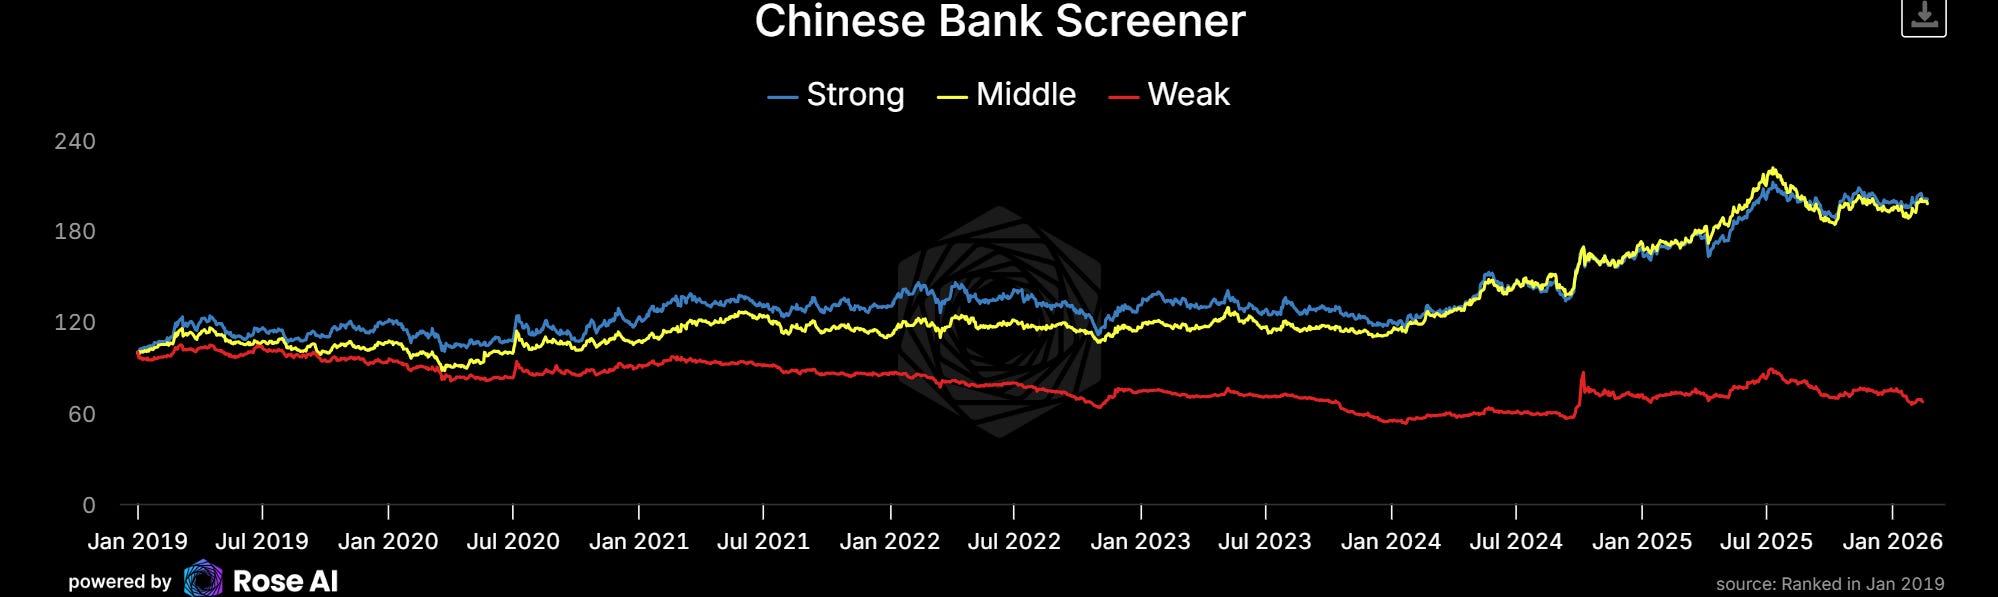
Good banks (large commercial, state-owned) are up ~180% since 2019. Bad banks (rural, shadow-dependent) are down to roughly 60% of their 2019 value. The market has already partly figured out which banks are eating the losses. The question is whether it’s priced in enough of them.
The debt swap is the perfect embodiment of this approach. RMB 10 trillion sounds enormous. It is. But zero debt was cancelled. It was reclassified, extended, and repriced downward. Markets see the big number. Nobody reads the fine print.
Each merger loads more bad loans onto big bank books and drags down profitability. Slower capital generation, longer time to heal. The cure is making the disease worse.
VIII. NIMs and the Constrained Space
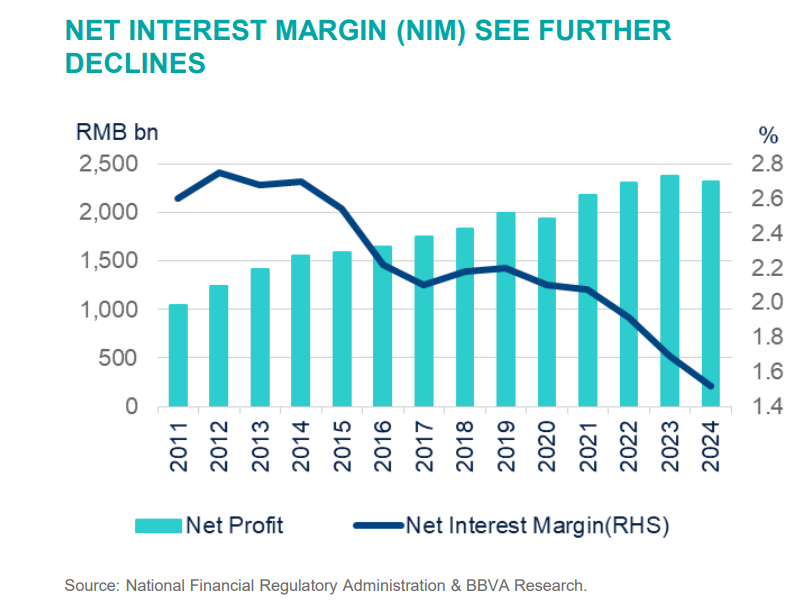
NIM is the key variable that determines whether the earn-through math works. At 1.52%, system NIM is already at record lows. BBVA forecasts it falls to 1.28%. At some point the banking system isn’t earning enough to absorb even the gradual bleed of losses, let alone recapitalize.
Four things are pushing NIM lower simultaneously.
Extensions mean lower coupons. Every LGFV restructuring, every developer loan rolled at a lower rate is a direct cut to bank income. The Zunyi template: 7.5% becomes 3.5%, 20-year term, 10-year grace. On every renminbi that goes through this program, the bank’s annual income roughly halves. And the volume is in the tens of trillions.
The rate floor is approaching. The 1-year LPR is at 3.15%. Deposit rates are already sub-1.5%. More than 50% of lenders are already lending at or below LPR, meaning they’re subsidizing borrowers rather than earning spreads. There’s maybe 20-30bps of rate easing left before you’re in ZIRP territory. Japan got to ZIRP with $31,000 GDP per capita. China is at $12,000.
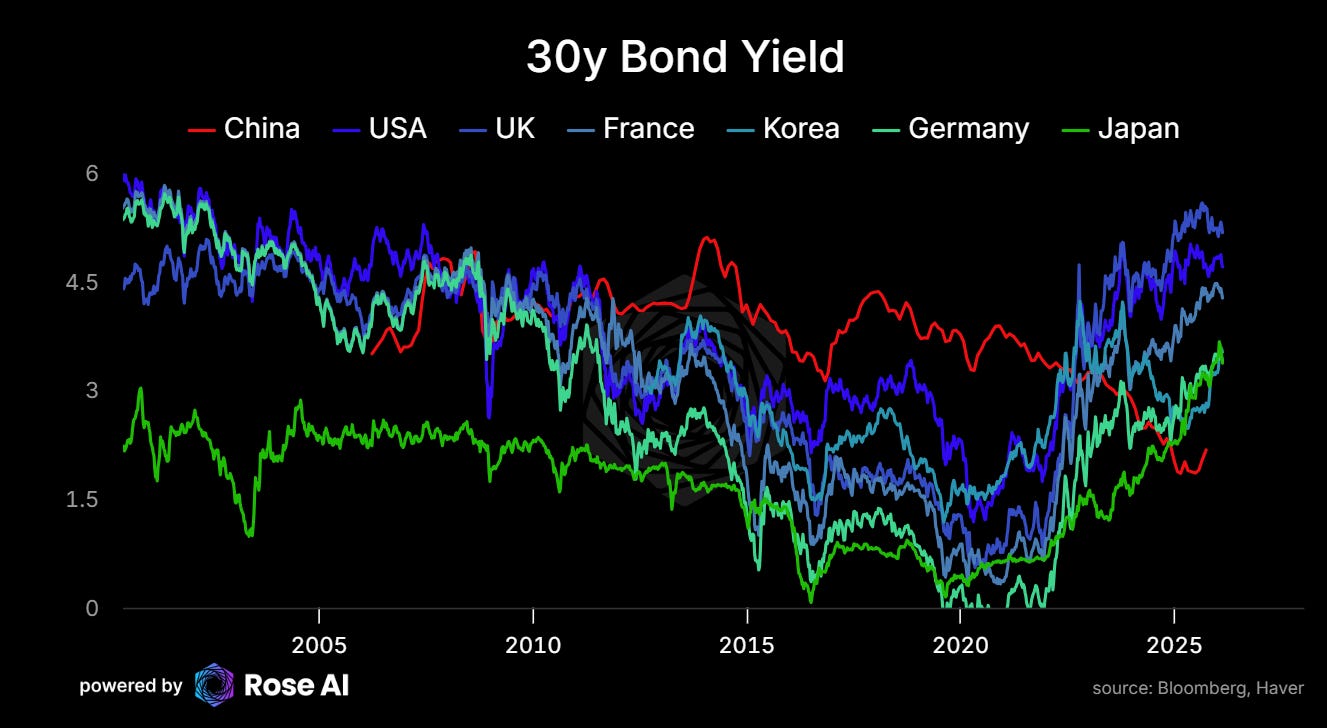
Foreign funding is not coming back. Offshore investors are buying Chinese equities (the DeepSeek rally, the tech narrative) but they’re not touching credit. There’s no foreign bid for LGFV bonds, developer paper, or bank capital instruments. The funding loop is entirely domestic. Domestic institutions recycling the same yuan, buying from each other. No external capital coming in to dilute the risk.
This is where the closed capital account bites hardest. In Japan’s lost decades, foreign capital could still flow in to buy distressed assets at the right price, vulture funds, private equity, sovereign wealth money. That created a floor. In China, the capital account keeps foreign money out almost as effectively as it keeps domestic money in. So there’s no external bid for the bad assets, no price discovery from disinterested foreign capital, and no mechanism to attract the kind of distressed debt specialists who helped clean up the US after the GFC. The system has to heal itself, using only its own blood supply.
Personal credit is cracking. This is the newest pressure and the one that’s been easy to dismiss because mortgage NPLs haven’t fully broken yet. But they’re building. Household debt-to-disposable-income is at 139%. Consumer NPLs surged 760% YoY in Q1 2025. Personal NPLs selling at 4.1 cents (Caixin). Regional bank mortgage NPLs already hitting 3.86% at Yibin Bank and Bank of Chongqing. The mortgage book was supposed to be the safe, unimpeachable asset. It’s developing holes.
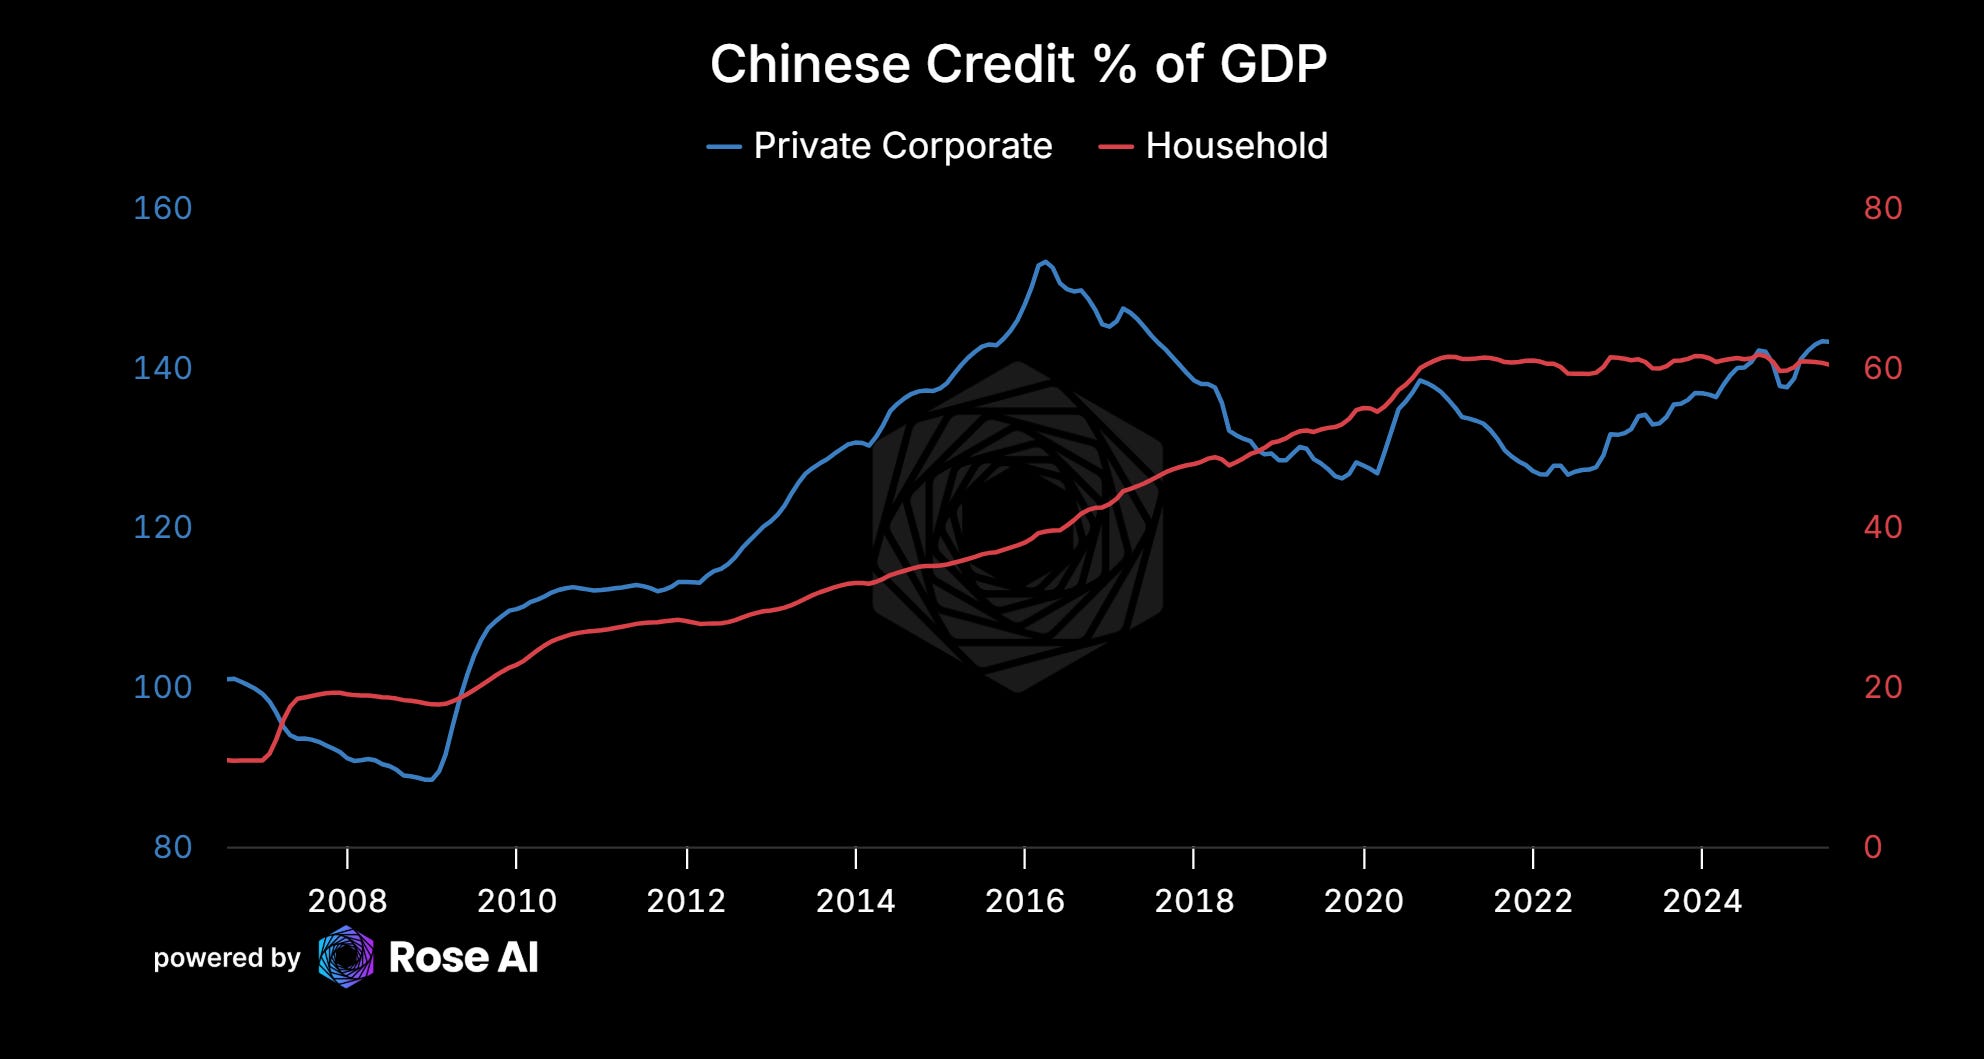
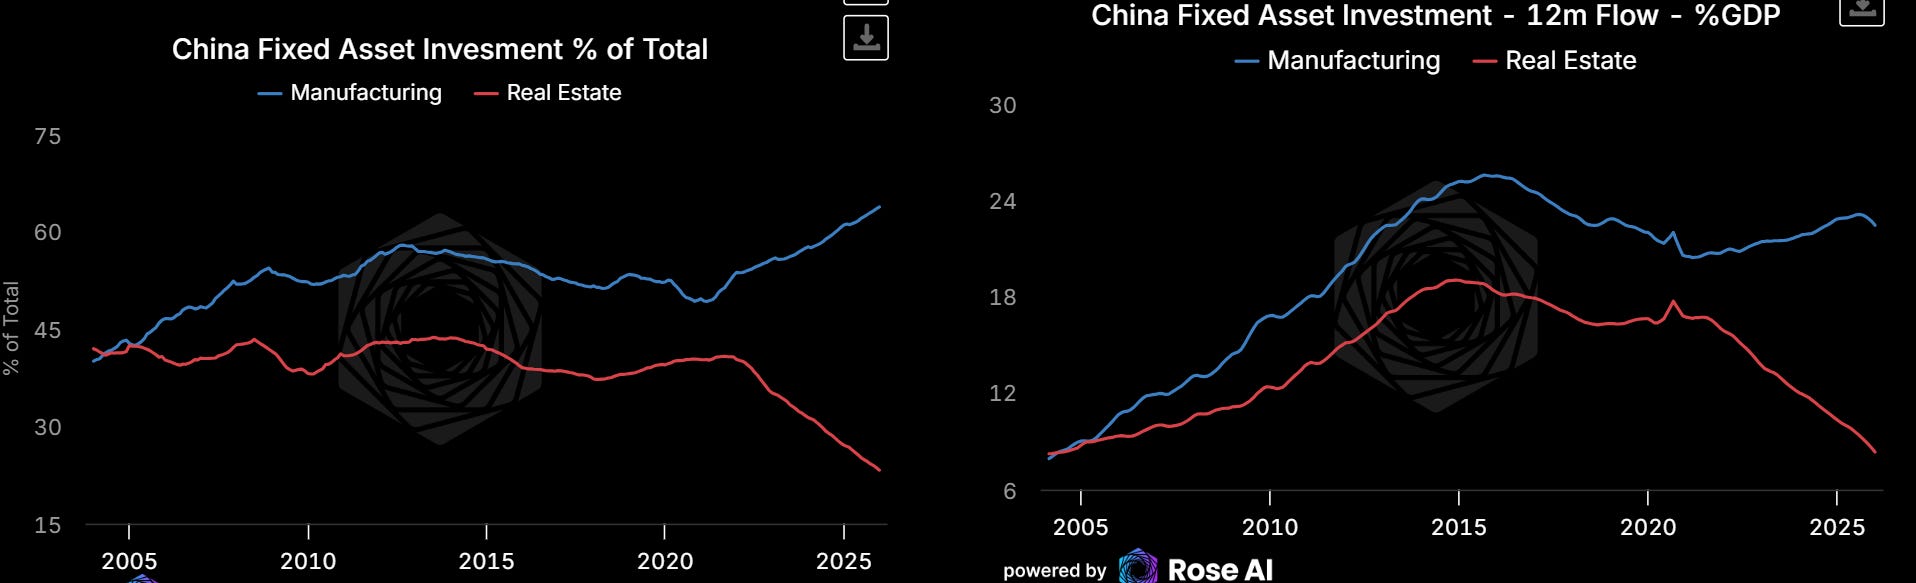
The manufacturing pivot adds a complication. Beijing has shifted credit creation from property to manufacturing. Corporate credit growing strongly, household credit contracting. That works as an economic strategy. Kind of a neo-mercantilism, ironically in the vein of what Lenin always said would lead to the collapse of the capitalist global order (imperial capitalist nations, having exhausted domestic demand, fighting wars at the periphery to expand their sphere of influence and hence the area from which they could expand their markets). But it also means the new loan book is going to industrial companies competing in global markets facing tariffs, and the old loan book (property) is still sitting there, quietly deteriorating.
At current NIM trajectory, annual bank profits decline from $330B toward $250B by 2027. The earn-through timeline extends from 3.4 years (base, current NIM) to over 13 years (stress, declining NIM). And if the corrected LGFV numbers are right ($5.0-5.5 trillion base instead of $4.4 trillion), the base case earn-through stretches past 6-7 years even without a panic. Japan’s banking crisis took 14 years to resolve, with $31K GDP per capita, a current account surplus, and a savings-rich population to fund the workout. China is running the same playbook at $12K per capita with a shrinking workforce.
IX. How Bad Is It, Historically Speaking?
For context, here’s where China sits relative to every major banking crisis in the past 40 years.
The Texas Ratio (NPLs divided by tangible common equity plus loan loss reserves) is the most useful metric because it tells you whether the system’s buffer covers its recognized problem loans. In theory, Texas Ratio above 100% means the bank runs out of capital before it can absorb its own bad loans.
Goldman Sachs calculates the system Texas Ratio at 18% for covered banks. That’s using official NPLs of 1.5%.
True-up the NPL ratio to the 10-15% range suggested by restructuring evidence, market prices, and the PBOC’s own stress test, and the Texas Ratio jumps to 65-80%. In stress, it breaches 100%.
Every historical crisis where the Texas Ratio went above 100% required some combination of government nationalization, blanket deposit guarantees, or external bailout. There is no example of a banking system with a 100%+ true Texas Ratio resolving itself through organic earning power.
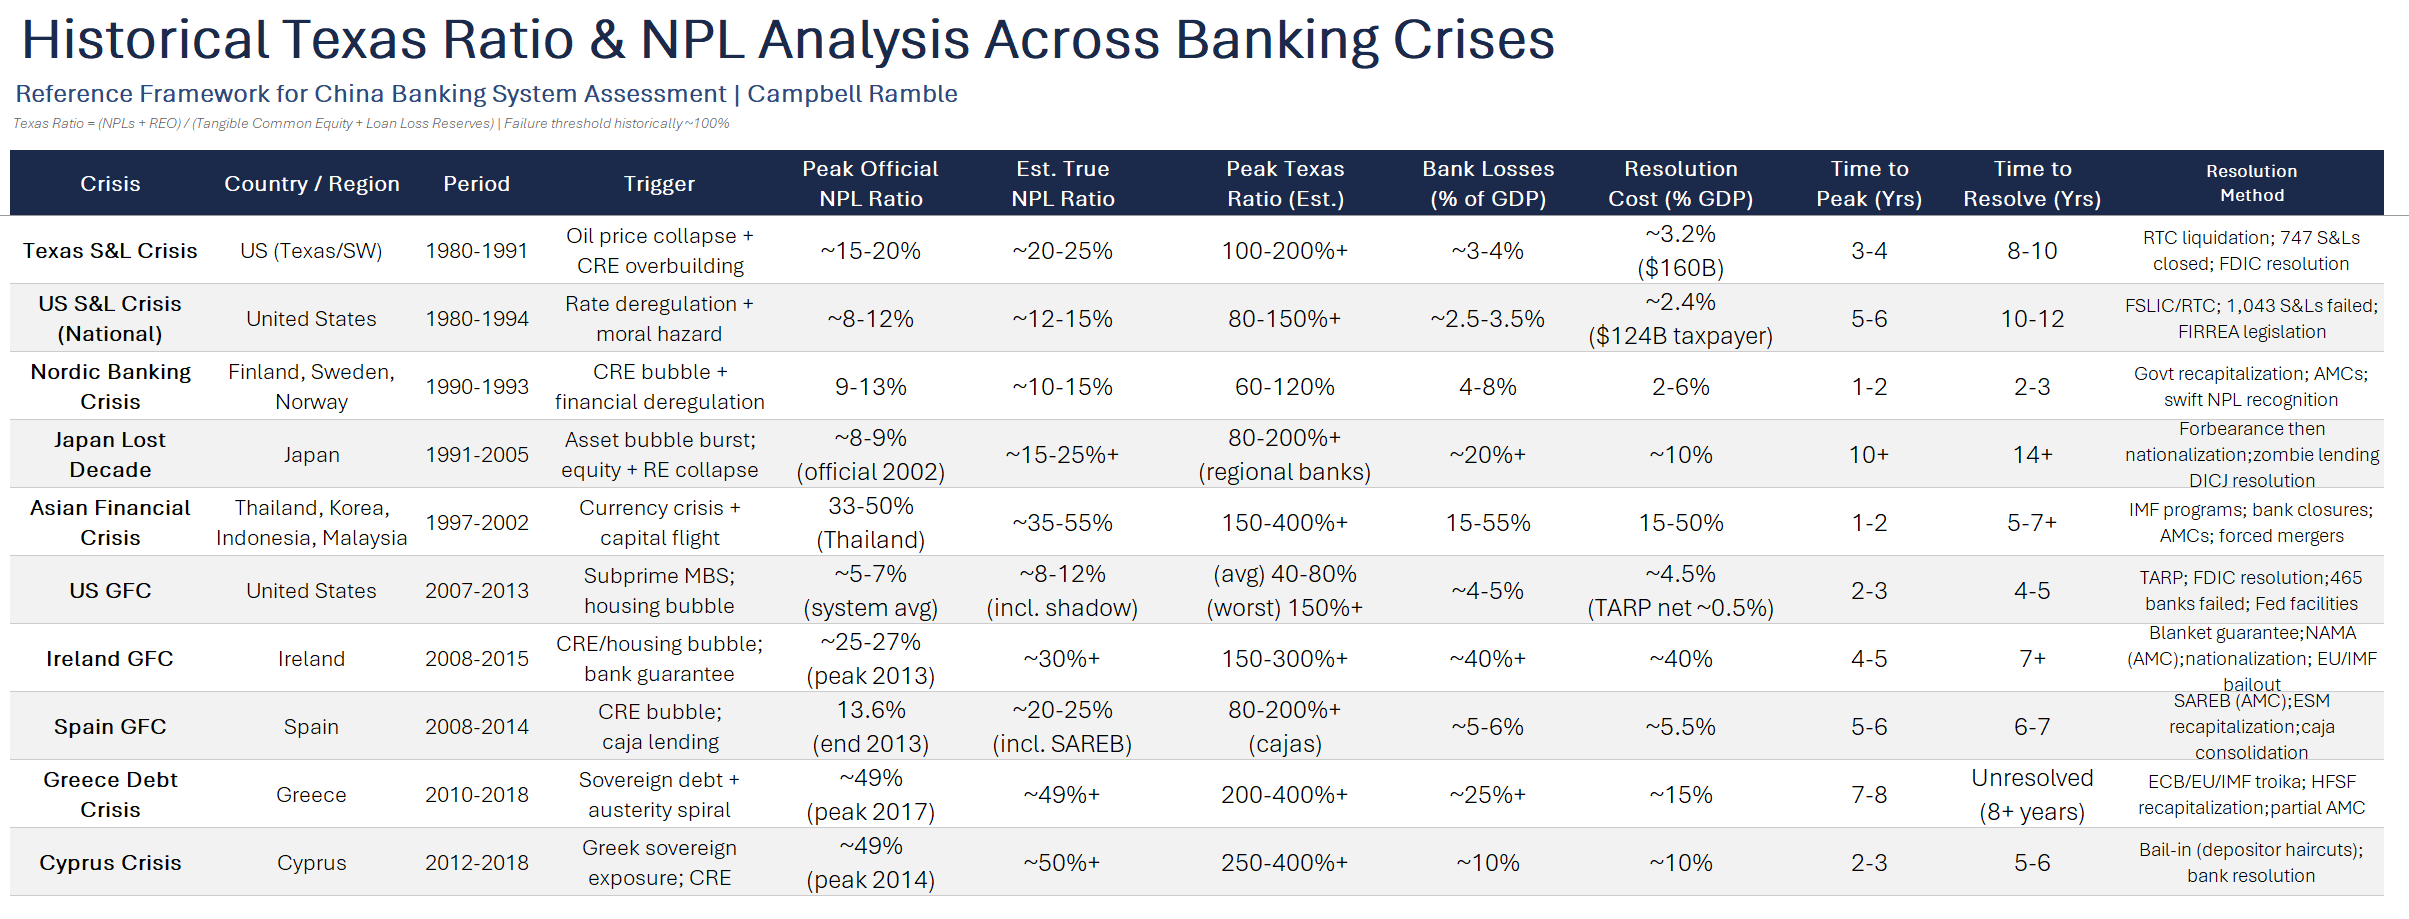
The Japan comparison is the most instructive because the resolution method is the same: forbearance, zombie lending, slow consolidation, no mark-to-market. Japan’s true NPL ratio peaked around 15-20%, losses at roughly 20% of GDP, and it took over 14 years. China is tracking toward 24-42% of GDP in losses at $12K per capita instead of $31K. It’s Japan at 1.5-2x the scale, with half the per capita income to absorb the hit.
The Nordic resolution is the counterfactual. Finland and Sweden recognized losses early (true NPL ratios around 10-15%), set up proper AMCs, recapitalized swiftly, and wrapped up in 2-3 years. Their losses were larger as a share of GDP than the US GFC, but the resolution was fast because the pain was taken. China is doing the opposite of every lesson from the Nordic playbook.
X. Blood Transfusion or Blood on the Streets
To return to where we started. Markets are truth-seeking mechanisms, but sometimes the process requires pain to function. The pain isn’t a side effect, it’s the cure.
Not because they misunderstand it. The scale of the honest reckoning is unprecedented and the political consequences of admitting it are genuinely terrifying.
A real restructuring, force the mark-to-market, recapitalize properly, let the small banks fail, would require admitting losses that are probably larger than the banking system’s equity base. It would crater bank stocks. It would trigger margin calls across an interconnected financial system. It would threaten the property wealth of the urban middle class that represents the political foundation of the regime.
And here’s what makes the Chinese case different from every other banking crisis in modern history: the closed capital account turns what would normally be a slow leak into a binary outcome. In an open system (the US in 2008, Japan in the 1990s) capital flows out gradually, finds its level, and the system adjusts. Painful but continuous. In a closed system, the capital stays trapped, pressure builds, and when the dam finally cracks, the flood is catastrophic. Every month that Chinese households convert deposits to gold, every dollar that leaves through the cumulative errors and omissions line in the balance of payments, is water finding its way around the dam. The fact that gold-in-China has become such a dominant trade isn’t incidental to the banking crisis. It IS the banking crisis, expressed as a portfolio allocation decision by 1.4 billion people who understand their system is broken before Western analysts do.
So instead of taking the pain, you get blood transfusions. RMB 500B in special recapitalization bonds. RMB 10 trillion in debt swaps. 290 bank mergers in a single year. LGFV extensions at 2.5% for 25 years. The transfusions are real. The bag is too small and the patient is still bleeding.
Every month the NIM compresses, the earn-through gets longer. Every merger concentrates more risk. Every debt swap trades a small reduction in short-term default risk for a large reduction in long-term earning power. And every month, Chinese households convert more of their deposits to gold and send more capital offshore through the cumulative errors and omissions line in the balance of payments.
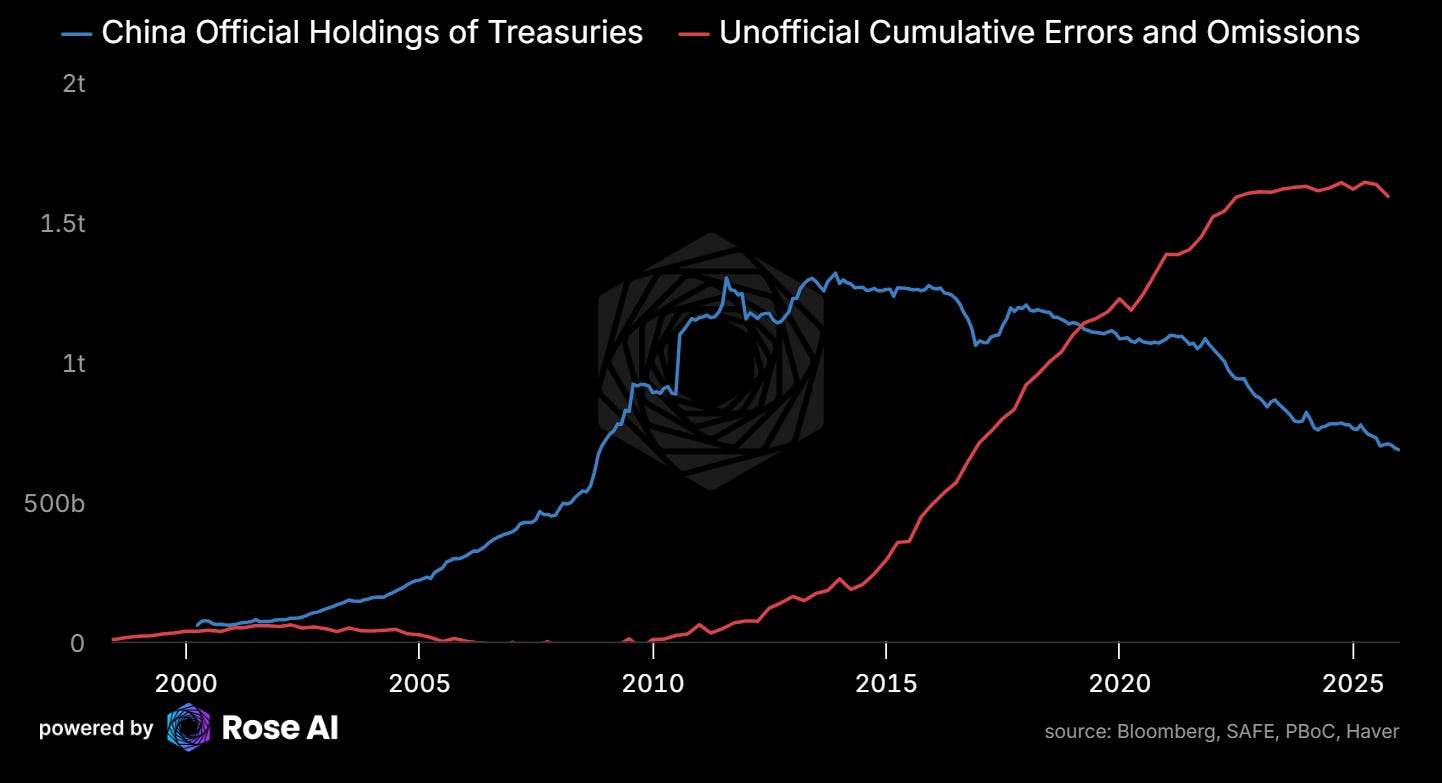
Note this is OFFICIAL holdings, they have been squirreling away hundreds of billions lot of UST in non-Chinese domiciles (Benelux) and in state banks, but the order of magnitude here is worth highlighting.
The annual resource drain (~$1.1 trillion) exceeds China’s official military and R&D budgets combined. $550B in lost land sale revenue, $183B in write-offs, $300B in LGFV service, and $100B in NIM compression. Each year.
They’re buying time. The question is whether they’ve bought enough. The math says they haven’t. But the math has been saying that for three years, and the system is still here. That’s the reflexivity at work — as long as no one panics, the base case holds, and the base case is survivable. The moment confidence breaks, the stress case becomes the real case, and the stress case requires either printing money (bearish RMB) or restructuring the entire banking system (bearish bank stocks, bearish everything for a while).
What we can say with confidence: the losses are real, the buffers are smaller than they look, the earn-through is getting longer not shorter, and the tools available to fix it are being exhausted. If you believe in the Japanese model, you believe this gets resolved over 20-30 years with declining living standards and persistent deflationary pressure. If you believe the constraints binding on Japan don’t hold in China, worse demographics, lower per capita income, capital controls that are leaking, then something has to give sooner.
Either way, it’s not solved. And it’s not priced.
The rest of this piece is for paid subscribers. If the analysis above is right, there are specific ways to position. Here’s how we’re trading it.
XI. Follow the Blood: The Trade
So where does that leave us as investors? Where the blood flows, the trade follows.
We continue to like “Gold in China”, aka long gold denominated in RMB (though RMBUSD looks to be under some bullish pressure at the moment).

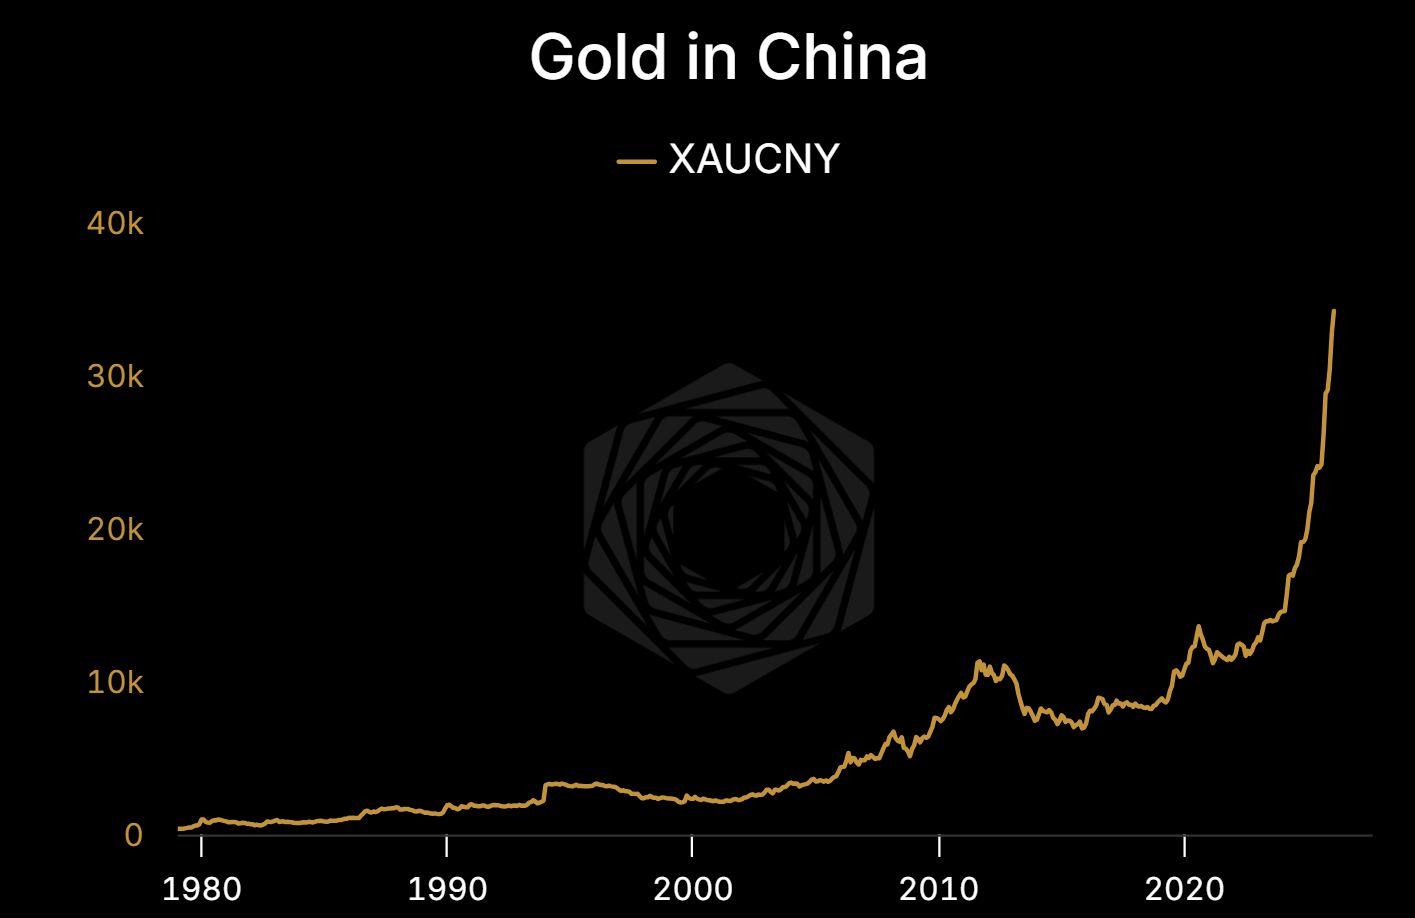
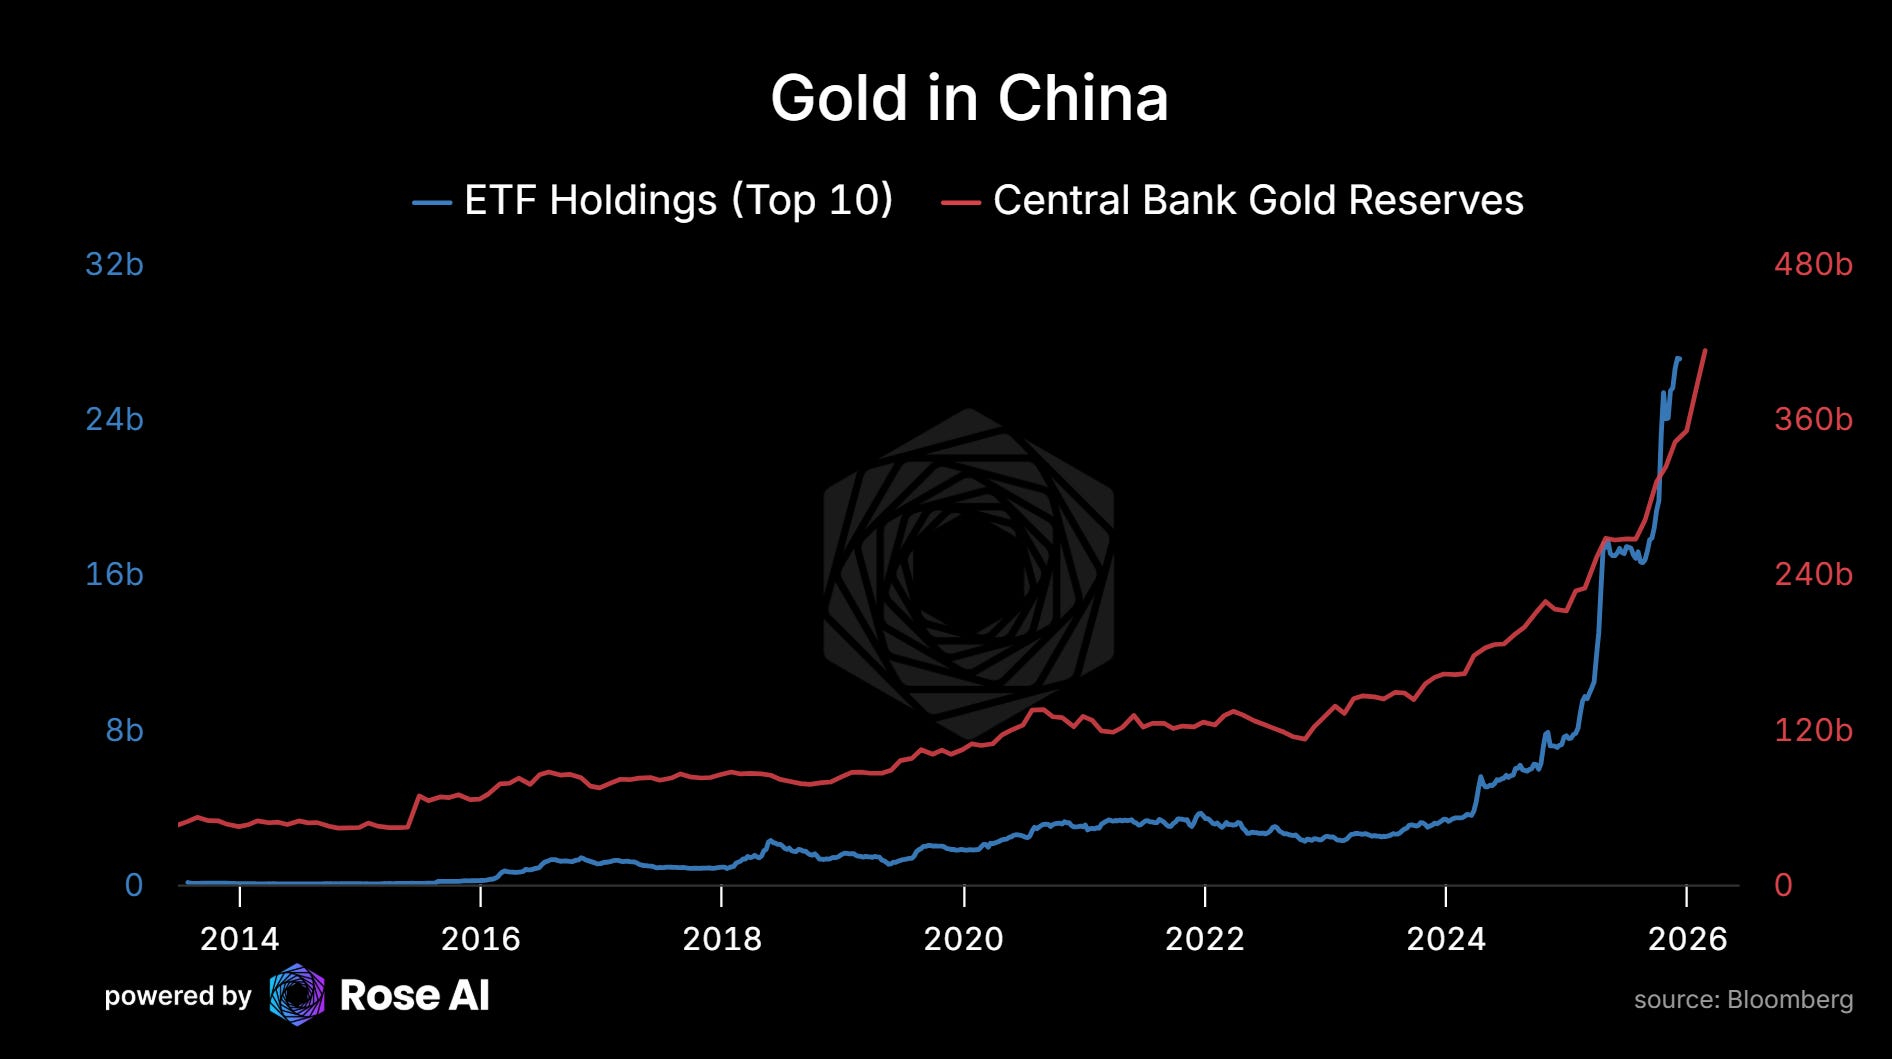
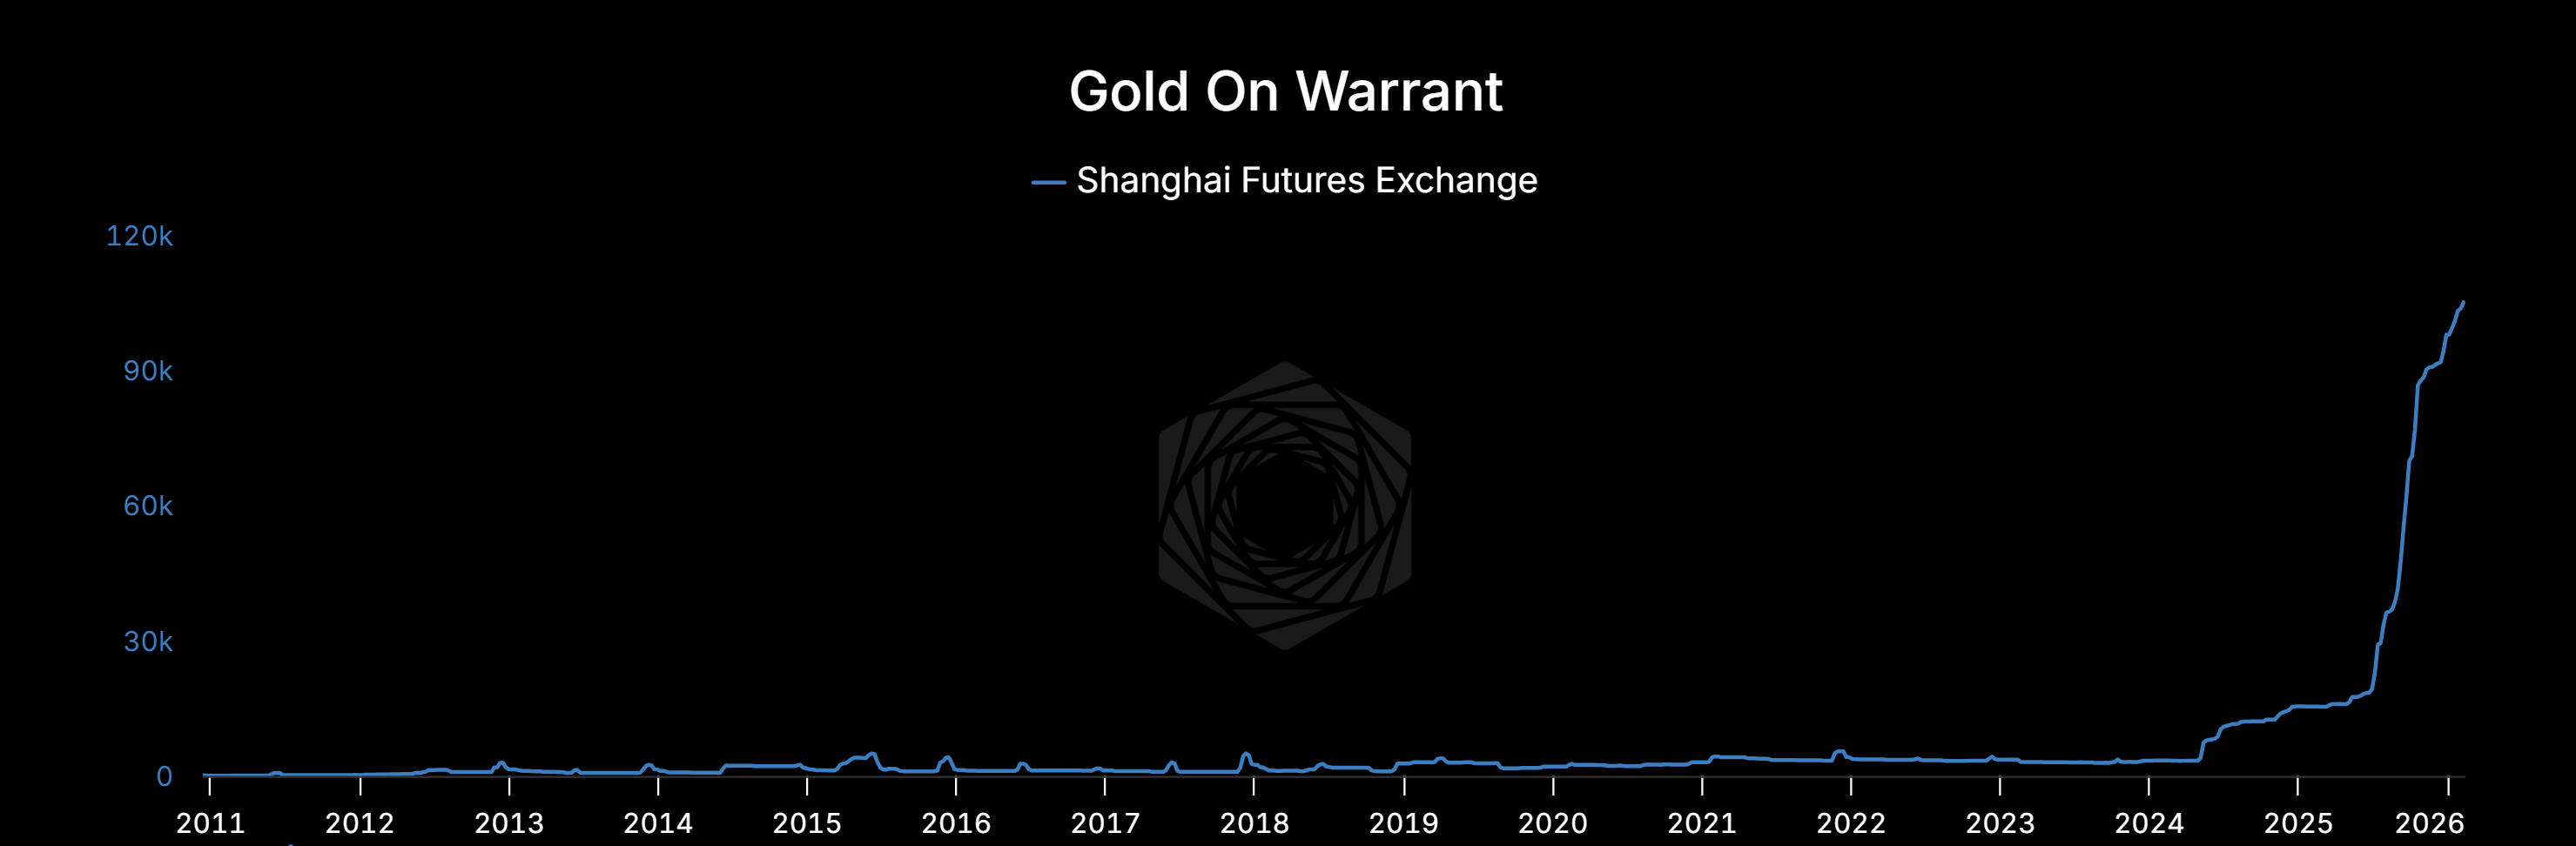
GLD / GDX / GDXJ — Nothing new here, just more confirmation. The China banking thesis is one more structural bid under a price that’s already up big in the portfolio. The mechanism: 1.4 billion people understand their banking system is broken before the rest of the world does, and they’re converting deposits to gold at 100+ tonnes per month. That doesn’t stop until the system is resolved, and resolution takes two decades. GLD for the metal exposure; GDX/GDXJ for the miners, which are still cheap relative to spot.
Short CNH (via long-dated USD/CNH options, size to risk tolerance): If the system has $5-10 trillion in losses and NIM is compressing toward ZIRP, the pressure relief is currency depreciation. Not a one-shot deval but a grinding weaker trend as they ease rates and eventually print to recapitalize. CNH vol is still cheap because the market trusts PBOC management. The trade is pricing the impossibility of maintaining stability while also running a 20-year earn-through on a multi-trillion loss.
In terms of stocks…
The Pair: Long KWEB / Short FXI
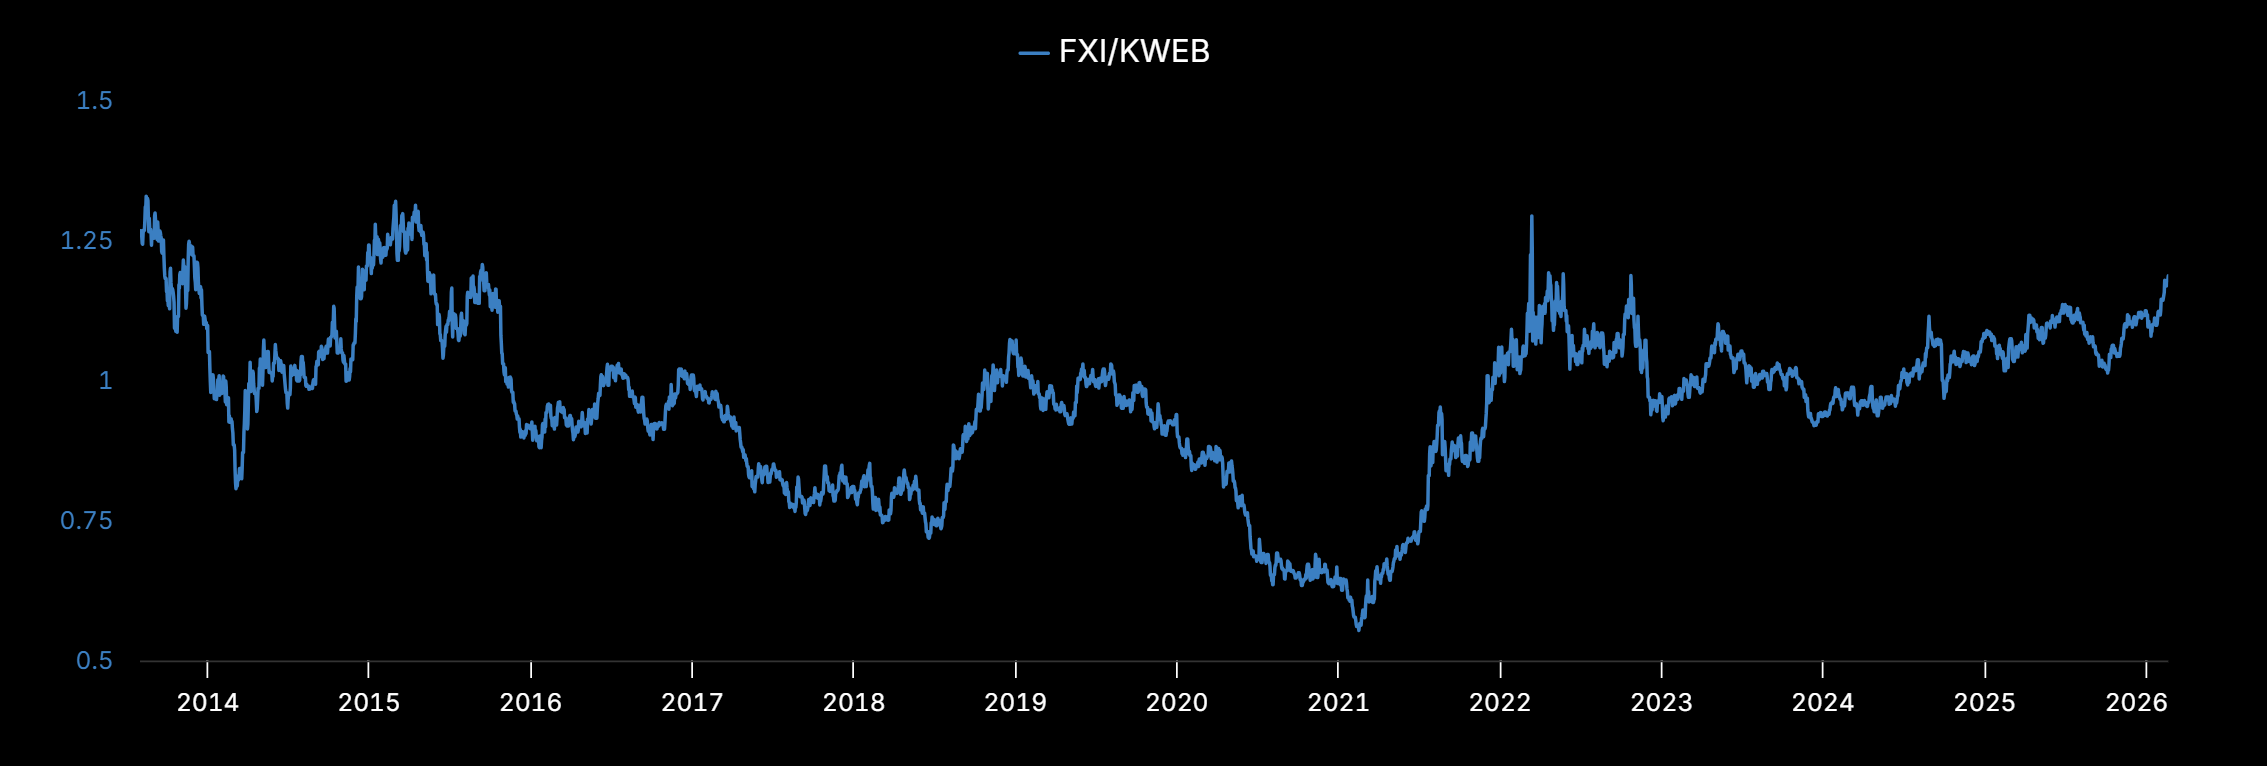
FXI/KWEB ratio, sitting around 1.1-1.2. Near the highs last seen in 2014-2015, right before the China deval and equity crash. The low was 0.65 in late 2020 when tech was ripping and everyone forgot banks existed. If the banking thesis plays out, or even if it just drags at a Japan-like pace, this ratio grinds back toward 0.75-0.85. That’s 25-35% spread without needing to get market direction right.
What you’re actually trading:
FXI top 10 holdings (what you’re short):
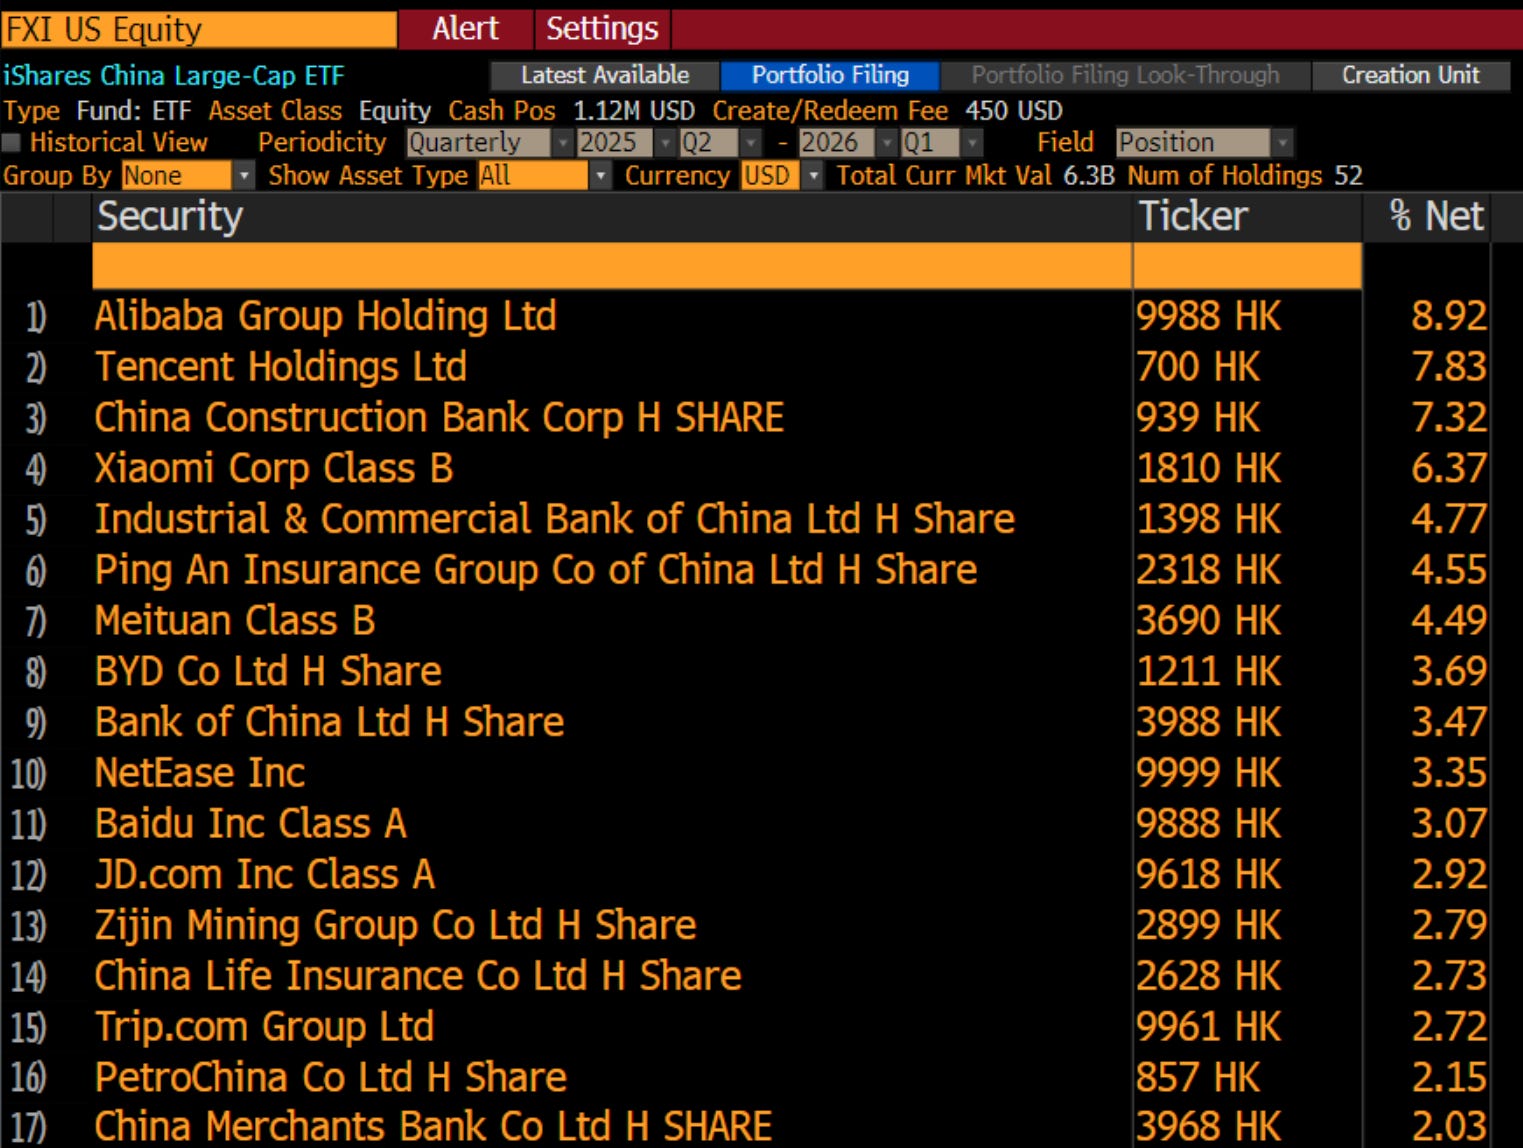
CCB, ICBC, Bank of China = 15.5% of the fund. Add Ping An, China Merchants Bank, Agricultural Bank, China Life, and a handful of smaller insurers and you’re at roughly 29% financials. That’s the weight sitting on the $5-10 trillion hole. The tech and consumer overlap with KWEB (Alibaba, Tencent, Meituan, NetEase) washes out in the pair.
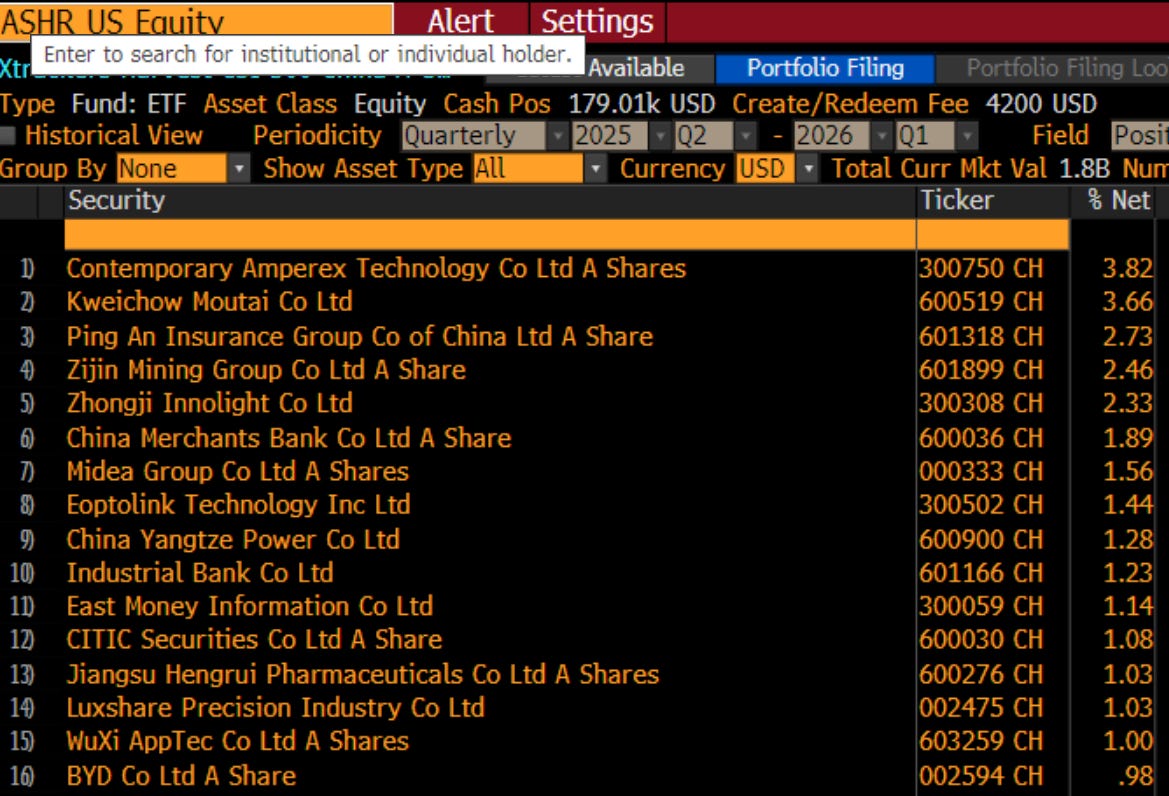
ASHR is also an option on the short side, but has a bit too much industrial/manufacturing relative to financial for our taste
KWEB top 10 holdings (what you’re long):
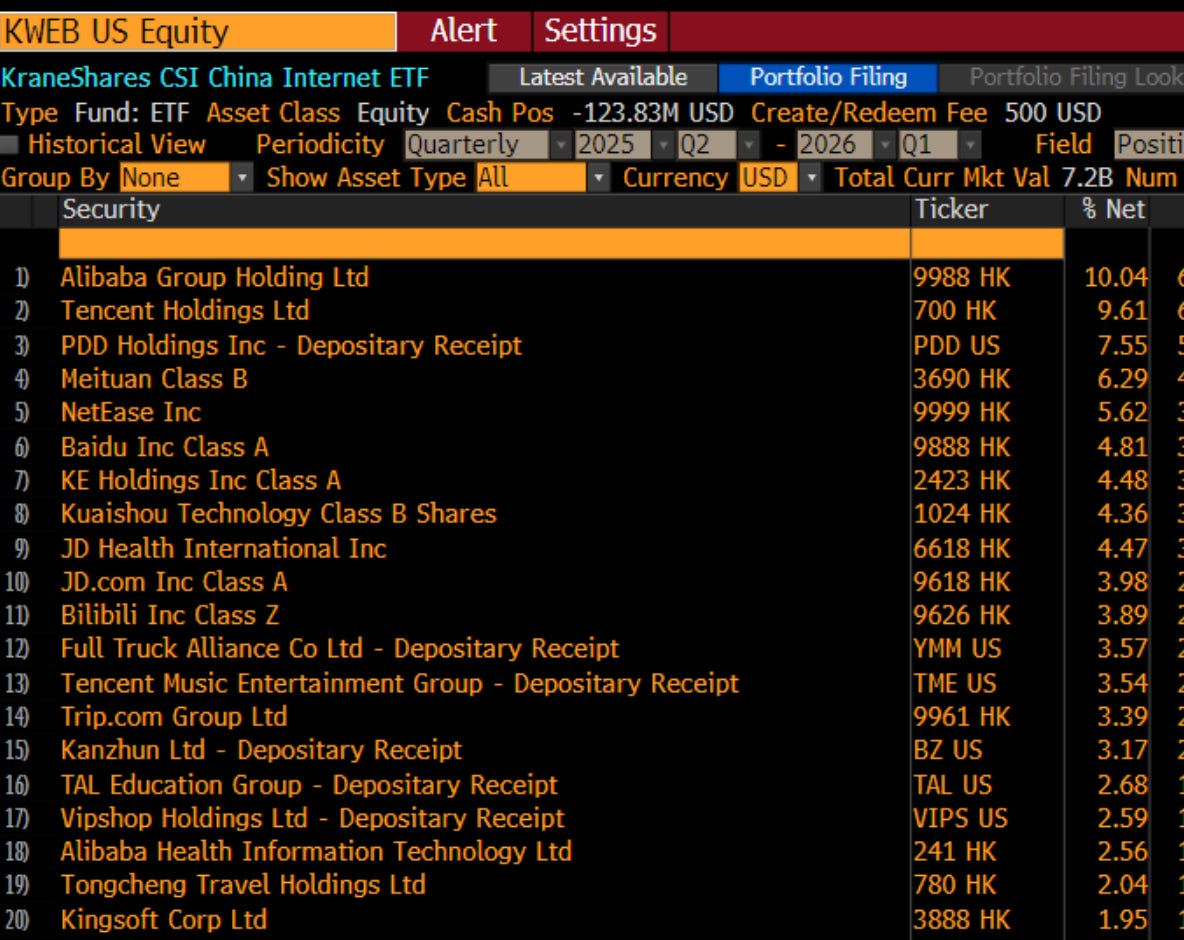
Zero banks. Zero insurers. Zero SOEs. Pure tech, e-commerce, AI. These are the companies Beijing is bleeding the banking system to protect. The entire manufacturing pivot and AI buildout runs through names like these.
Net exposure: short Chinese financials, long Chinese internet/AI. Selling the old economy drowning in bad debt and buying the new economy that’s getting subsidized with the proceeds.
One flag: KE Holdings (#7, 4.5% of KWEB) is Beike, the real estate services platform. That’s the one name in KWEB with genuine property exposure. It’ll drag on the long side if the property collapse deepens. Worth knowing.
The risk on the short side: Beijing controls the marginal buyer of bank stocks. They can keep them levitating longer than your P&L survives. The Big 5 dividend yield (~5-6%) means you’re paying carry on the short. Size this accordingly and give it 12-18 months. This is a spread trade, not a short-selling thesis on insolvency.
The Structural Longs
Some other trades we are looking closer at lately…
Disclaimers
Charts and graphs included in these materials are intended for educational purposes only and should not function as the sole basis for any investment decision.
These opinions are mine and mine alone and do not represent the views of any of Rose’s clients or counterparties.
This letter does not constitute an offer to sell, a solicitation of an offer to buy, or a recommendation of any security or any other product or service by Rose, Campbell or any other third party regardless of whether such security, product or service is referenced in this brochure. Furthermore, nothing in this website is intended to provide tax, legal, or investment advice and nothing in this website should be construed as a recommendation to buy, sell, or hold any investment or security or to engage in any investment strategy or transaction. You are solely responsible for determining whether any investment, investment strategy, security or related transaction is appropriate for you based on your personal investment objectives, financial circumstances and risk tolerance. You should consult your business advisor, attorney, or tax and accounting advisor regarding your specific business, legal or tax situation.
THERE CAN BE NO ASSURANCE THAT ROSE TECHNOLOGY INVESTMENT OBJECTIVES WILL BE ACHIEVED OR THE INVESTMENT STRATEGIES WILL BE SUCCESSFUL. PAST RESULTS ARE NOT NECESSARILY INDICATIVE OF FUTURE RESULTS. AN INVESTMENT IN A FUND MANAGED BY ROSE INVOLVES A HIGH DEGREE OF RISK, INCLUDING THE RISK THAT THE ENTIRE AMOUNT INVESTED IS LOST. INTERESTED PROSPECTS MUST REFER TO A FUND’S CONFIDENTIAL OFFERING MEMORANDUM FOR A DISCUSSION OF ‘CERTAIN RISK FACTORS’ AND OTHER IMPORTANT INFORMATION
Appendix: Data Sources
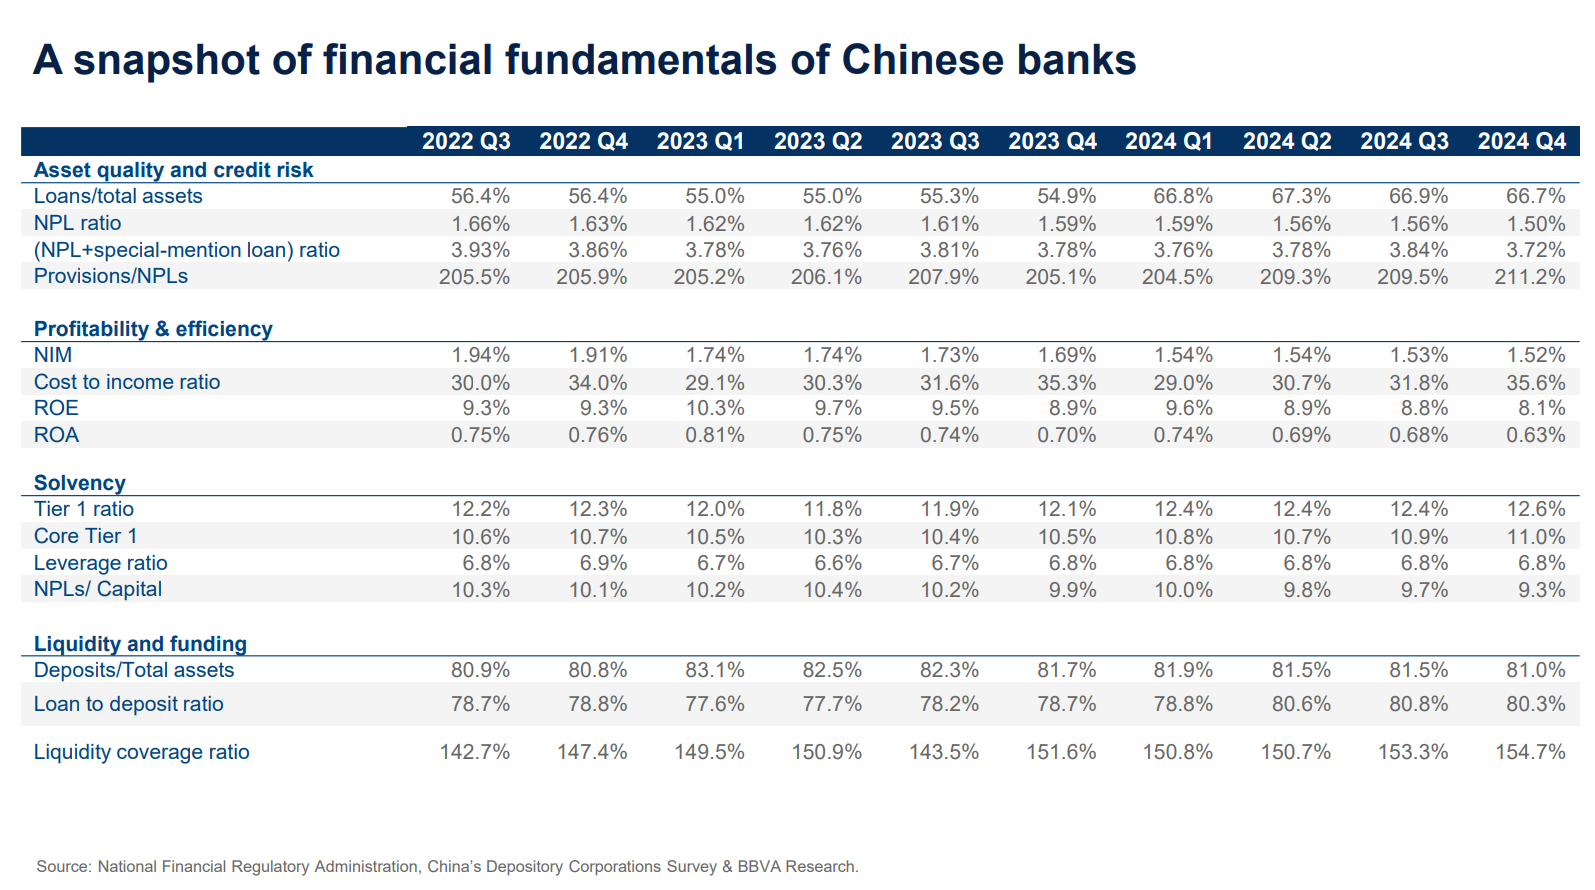
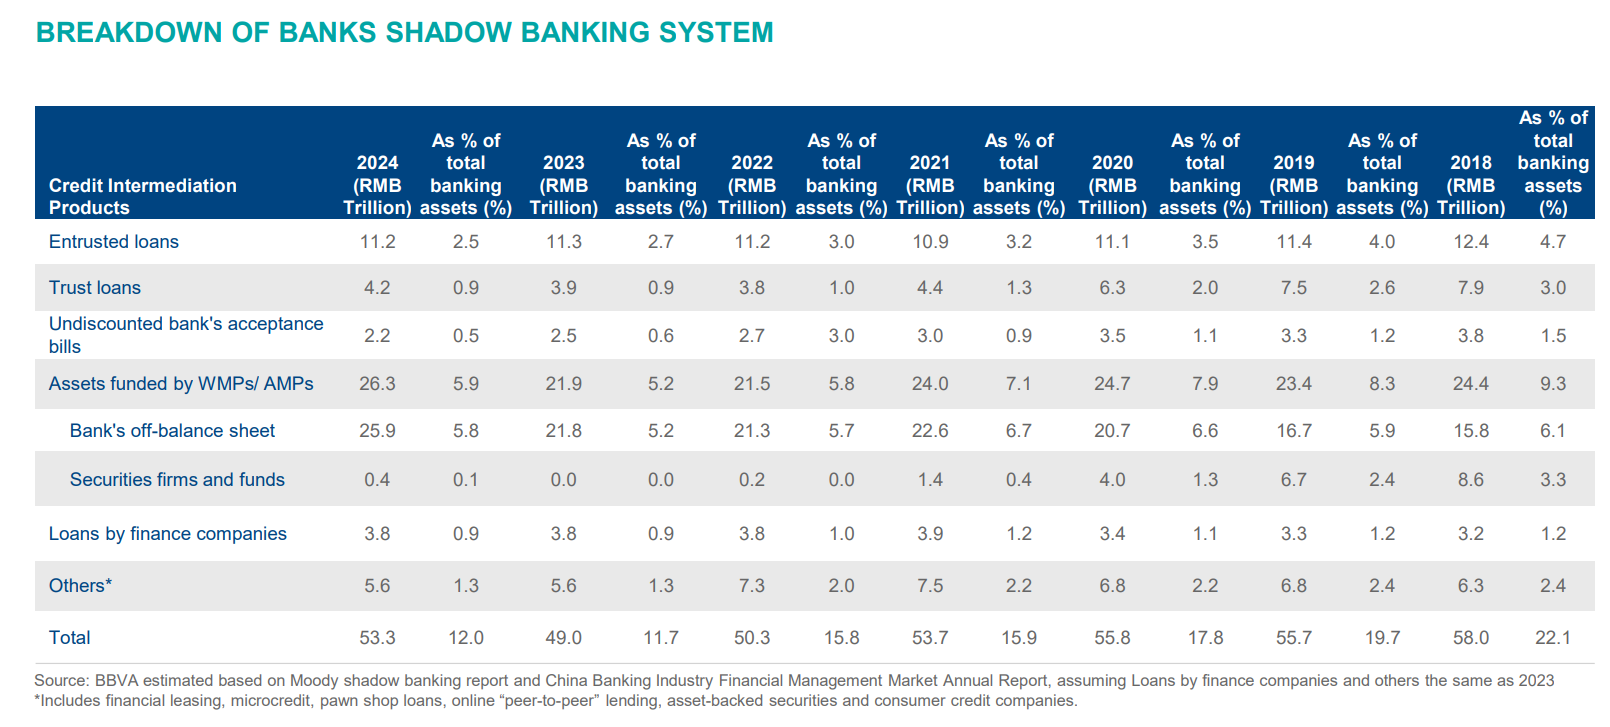
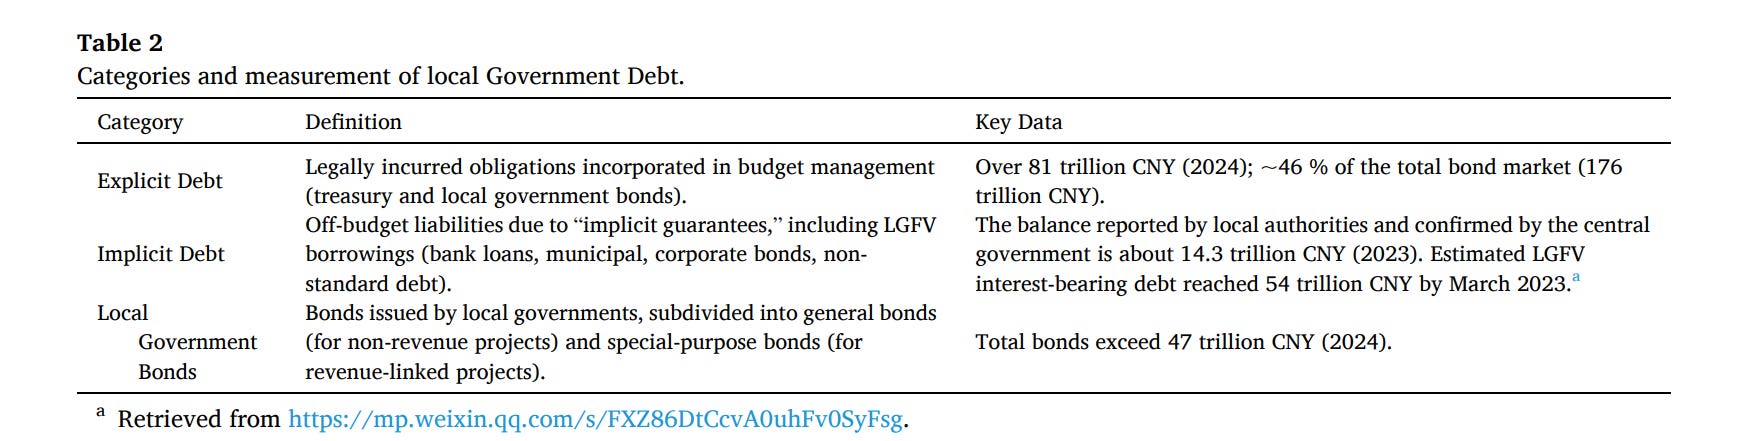
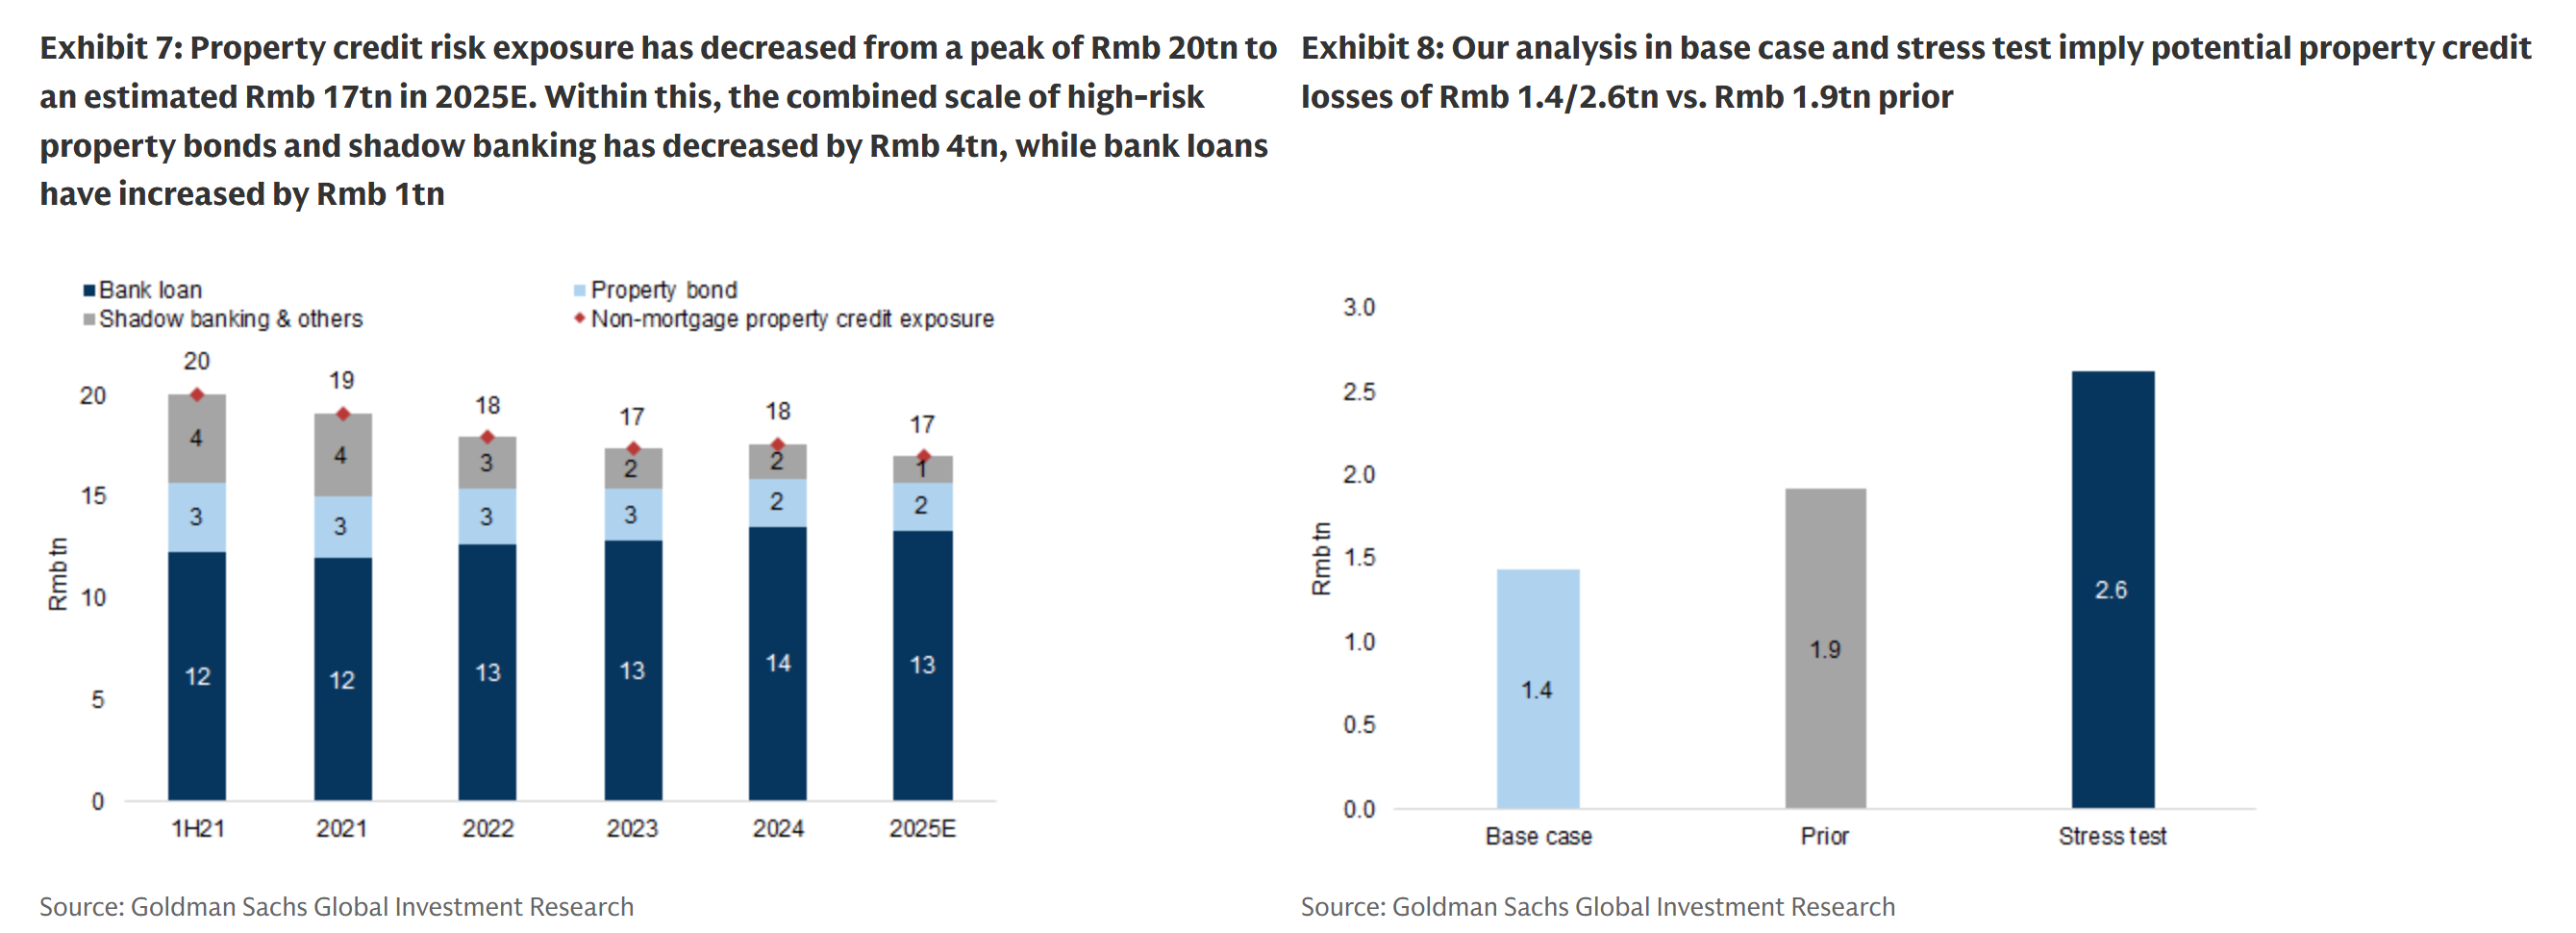
BBVA China Banking Monitor (April 2025)
PBOC/NFRA Q4 2024 and Q1 2025 data
Caixin, May 2025: Personal NPL recovery rates (4.1 cents on yuan)
IIF/BBVA: LGFV debt estimates
DZH: LGFV interest-bearing debt 87 trillion yuan
UBS Property Exposure Report (2022)
IMF Article IV: Augmented debt ratios
Zhongrong Trust liquidation filings (Bloomberg, April 2025)
Developer restructuring term sheets: Evergrande, Sunac, Country Garden, Kaisa, Shimao
LGFV restructuring terms: Zunyi Daoqiao, Kunming Dianchi, Guizhou Highway
PBOC 2022 stress test results (Seafarer/Borst)
Goldman Sachs China Banks Outlook (December 2025)
Charoenwong et al. (2025): NPL concealment mechanisms, Pacific-Basin Finance Journal
It seems the end of the piece is missing
“ The Structural Longs
Some other trades we are looking closer at lately…”
What happens geopolitically if the pressure release is through the currency? A depreciation of the CNY would piss off everybody as that would make their exports really cheap versus the G7/G20 economies. And with the US wanting to re-shore that becomes pretty difficult with a strong dollar. And if they all retaliate using tariffs what stops China from retaliating using its dominance in the supply chains. And then what happens to US companies in China? You have Apple selling iphones in Yuan. The stock will take a hit and drag SP500 with it. Cheers.