

A Trade as Sweet as Ethanol
The Brazilian Mills Have Voted

Another week, another stalemate between the rock and the hard place that is Hormuz. In spite of what looked like some slight movement over the weekend by the Iranians towards a negotiated settlement, the gap between the two parties remains. Iran now appears willing to trade control over Hormuz for peace and a lifting of sanctions. They made overtures towards reducing their nuclear ambitions, but appear to want to lock in the ceasefire before negotiating for the full removal of their stockpile and the exact timing and level of enrichment. Trump, seemingly emboldened by the Rimland strategy of blockade and interdiction, appears resolute that it must be a package deal and that no quarter will be given on the two key questions we laid out last time: freedom of navigation and a non-nuclear Iran. By keeping a lid on energy prices while the stock market rips, he has earned himself trade space to push for a resolution closer to his stated goals.
What we might call in trading a position that is “positive carry, positive convexity,” meaning one where the status quo works for him, while exposing him to asymmetric gains. Particularly after having used the ceasefire as justification for not triggering the 60-day war powers review that would tangle his plans in congressional meddling.
Whether or not this status quo holds is anyone’s guess. To us it appears equally likely at this point that we will see some sort of escalation as movement towards a sustainable peace. Meanwhile, every day the strait is closed, global energy and food markets get tighter and tighter. Every day fertilizer remains dear is a day that less of it goes onto crops, which in turn reduces yield further, which in turn raises medium-term expectations for prices.
Next time, we’ll likely go deeper on the inflationary pressure we see coming on the horizon, pressure which led us to sell a bit of longer-term duration towards the end of last week (a position we may add to if bonds rally this week). We’ll also start looking at the impacts on emerging market debt and currencies we see particularly exposed to this witches’ brew of acceleration and inflation (we’re looking at you, India).
Today we’re going to dive into one leg of our cascade trade, the one which is playing out as we speak: the impact of high energy prices on the market for sugar, through a single, critical linkage. Brazil.
As opposed to prior pieces, this one is going to be relatively straightforward, and hopefully not too long.
The story is simple. Brazil dominates world production of sugar, and it looks like substitution demand for ethanol on sugarcane (the raw material that acts as feedstock for traded sugar) will entirely consume the “production surpluses” that were consensus a matter of months ago. When combined with the smaller impact of Indian ethanol substitution, and the potential shock from an El Niño with below-average rainfall, we remain bullish on sugar.
A Very Simple Market
Sugar is actually a very simple market.
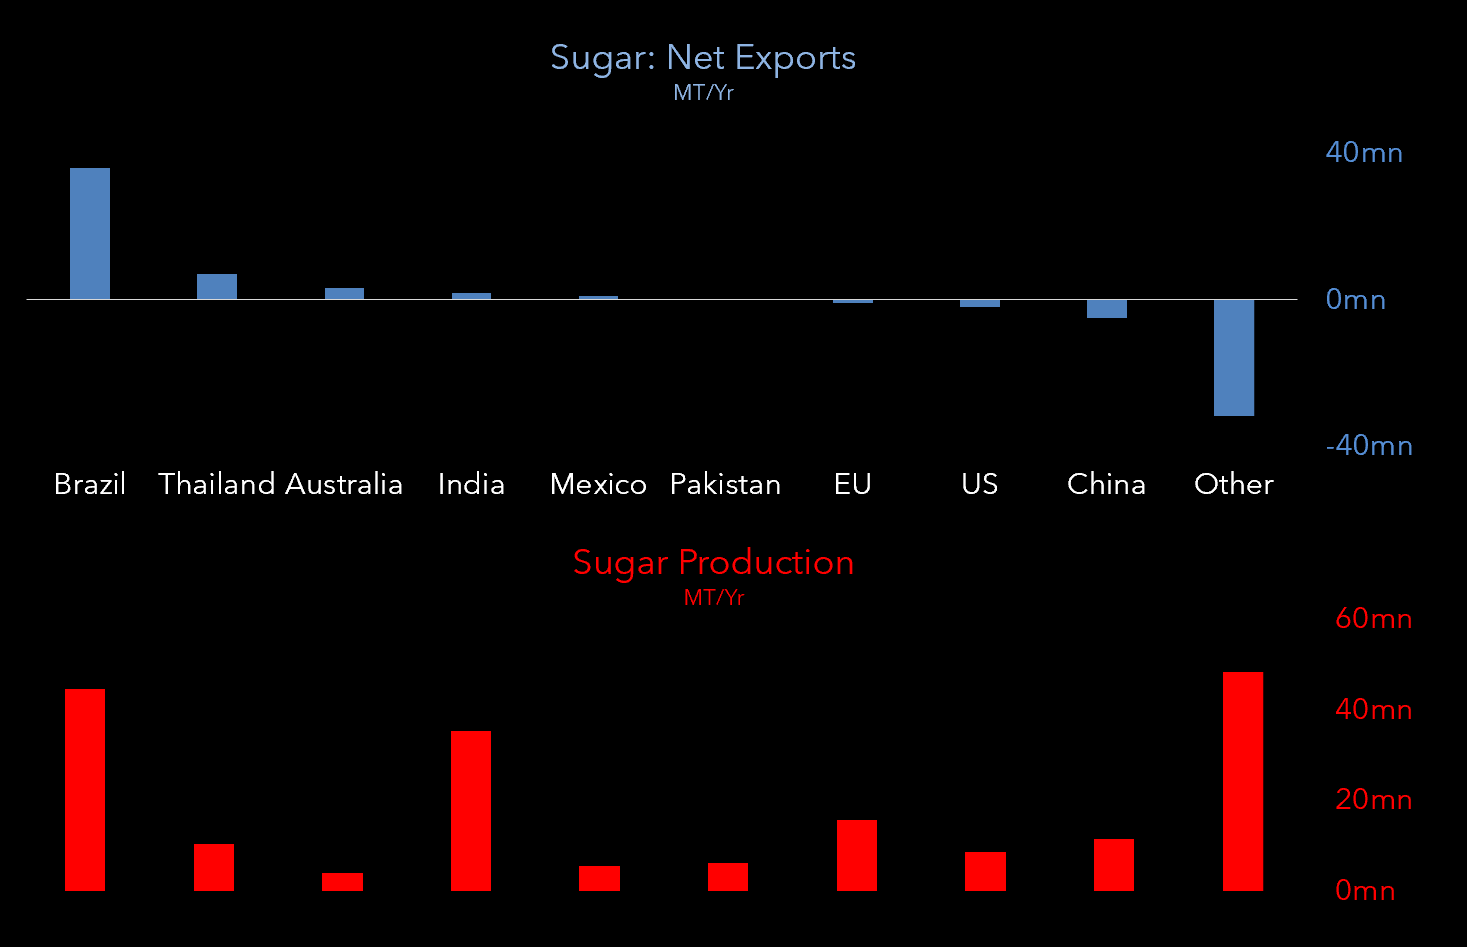
Brazil produces about 40 million tonnes a year and exports roughly 35 million of it. That is almost half of all sugar traded globally. The next largest exporter, Thailand, ships about 7 million tonnes. Everyone else is a rounding error or a net importer. When you trade sugar, you are trading Brazilian supply decisions.
But here is the thing that makes sugar different from most other agricultural commodities. The raw material that sugar is made from, sugarcane, can also be turned into ethanol. Brazilian mills make this choice every two weeks based on which product pays more. When ethanol pays better than sugar, mills divert cane away from sugar production and into fuel. When sugar pays better, they swing the other way. (Corn has a similar dynamic in the US, where ethanol competes with feed and food uses, but the mechanism is less direct because American ethanol production is structurally locked in by the Renewable Fuel Standard rather than driven by biweekly mill-level economics.)
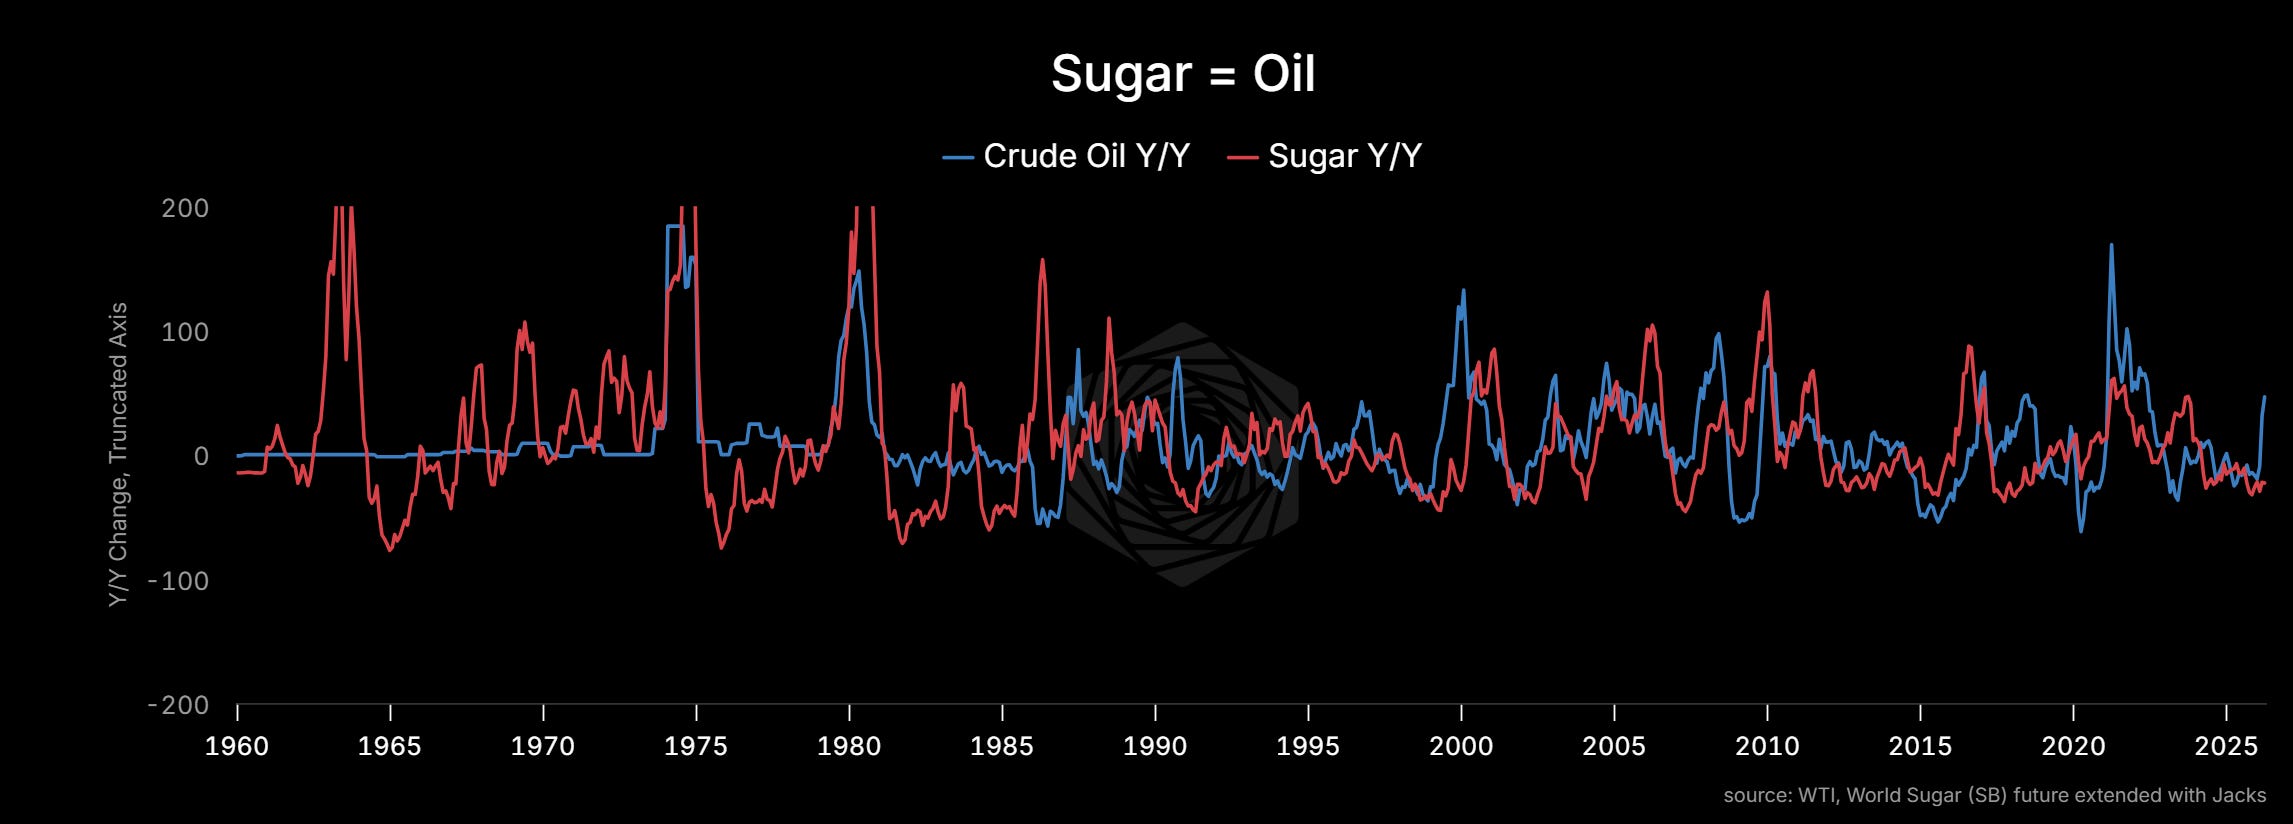
This means sugar is not just a food commodity. Sugar is an energy commodity. Its price is linked to crude oil through a chain that runs: crude oil → gasoline price → ethanol competitiveness → mill allocation → sugar supply. When oil rises, ethanol becomes more valuable, mills make more ethanol, less sugar reaches the world market, and the price of sugar goes up.
Over the past twenty years, every major sugar rally has been driven by the same thing: a demand-supply gap caused either by weather disruptions (India, Thailand) or by Brazilian mills diverting cane to ethanol (2008-09, 2015-16, 2019-20). The correlation between year-over-year changes in crude oil and sugar prices over sixty years of data is striking.
The Consensus Was a Surplus
Going into this year, the consensus view on sugar was comfortable. Czarnikow, a London-based sugar trading and advisory firm whose forecasts the market trades off of, projected a surplus of about 3.4 million tonnes in February. By April they had revised that down to 1.1 million tonnes, but the story was still the same: more sugar than the world needed, prices drifting sideways or lower, nothing to see here.
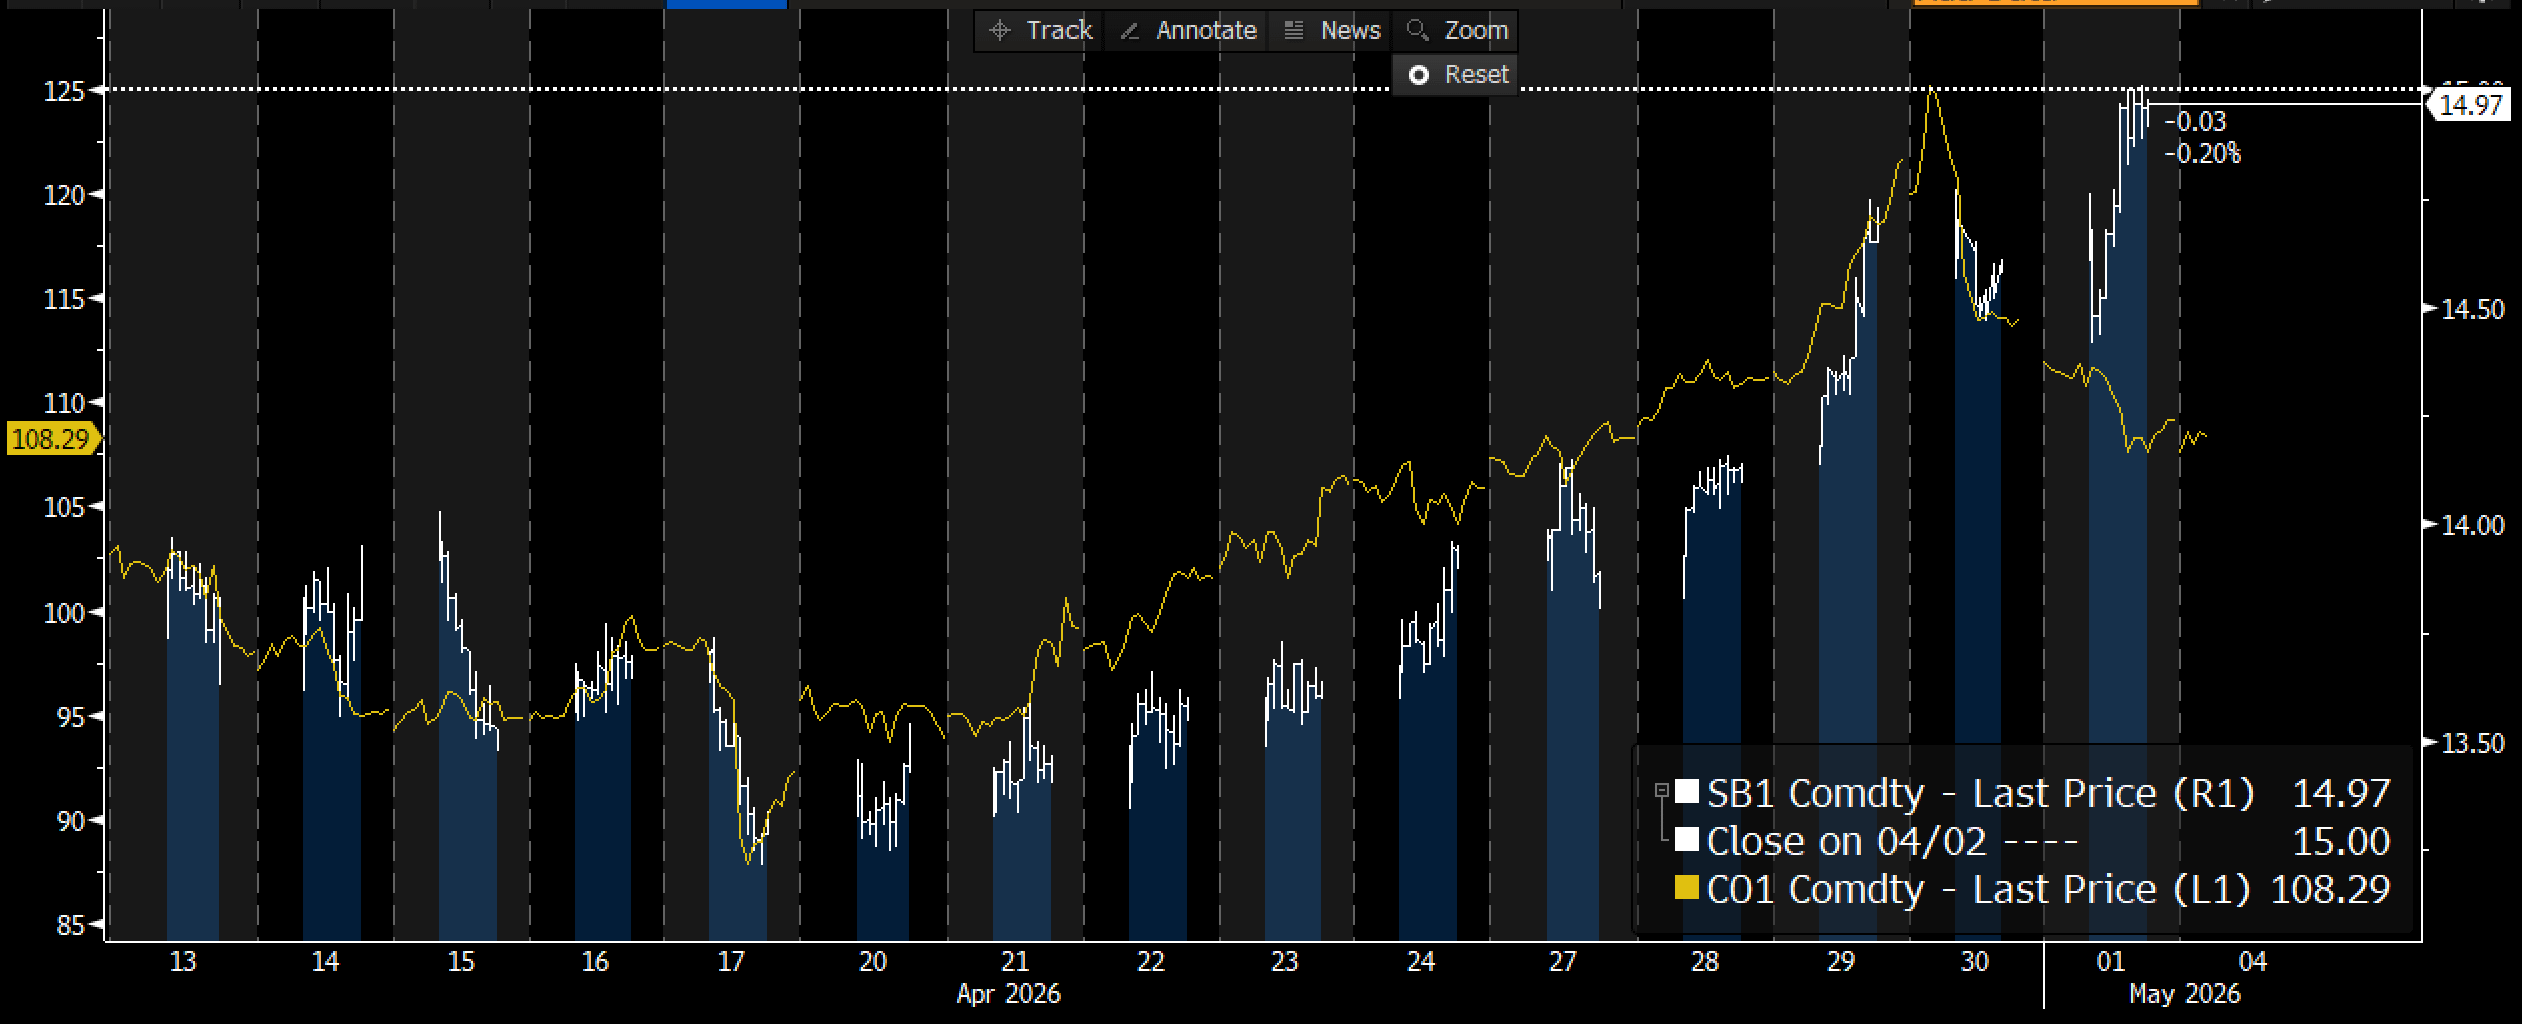
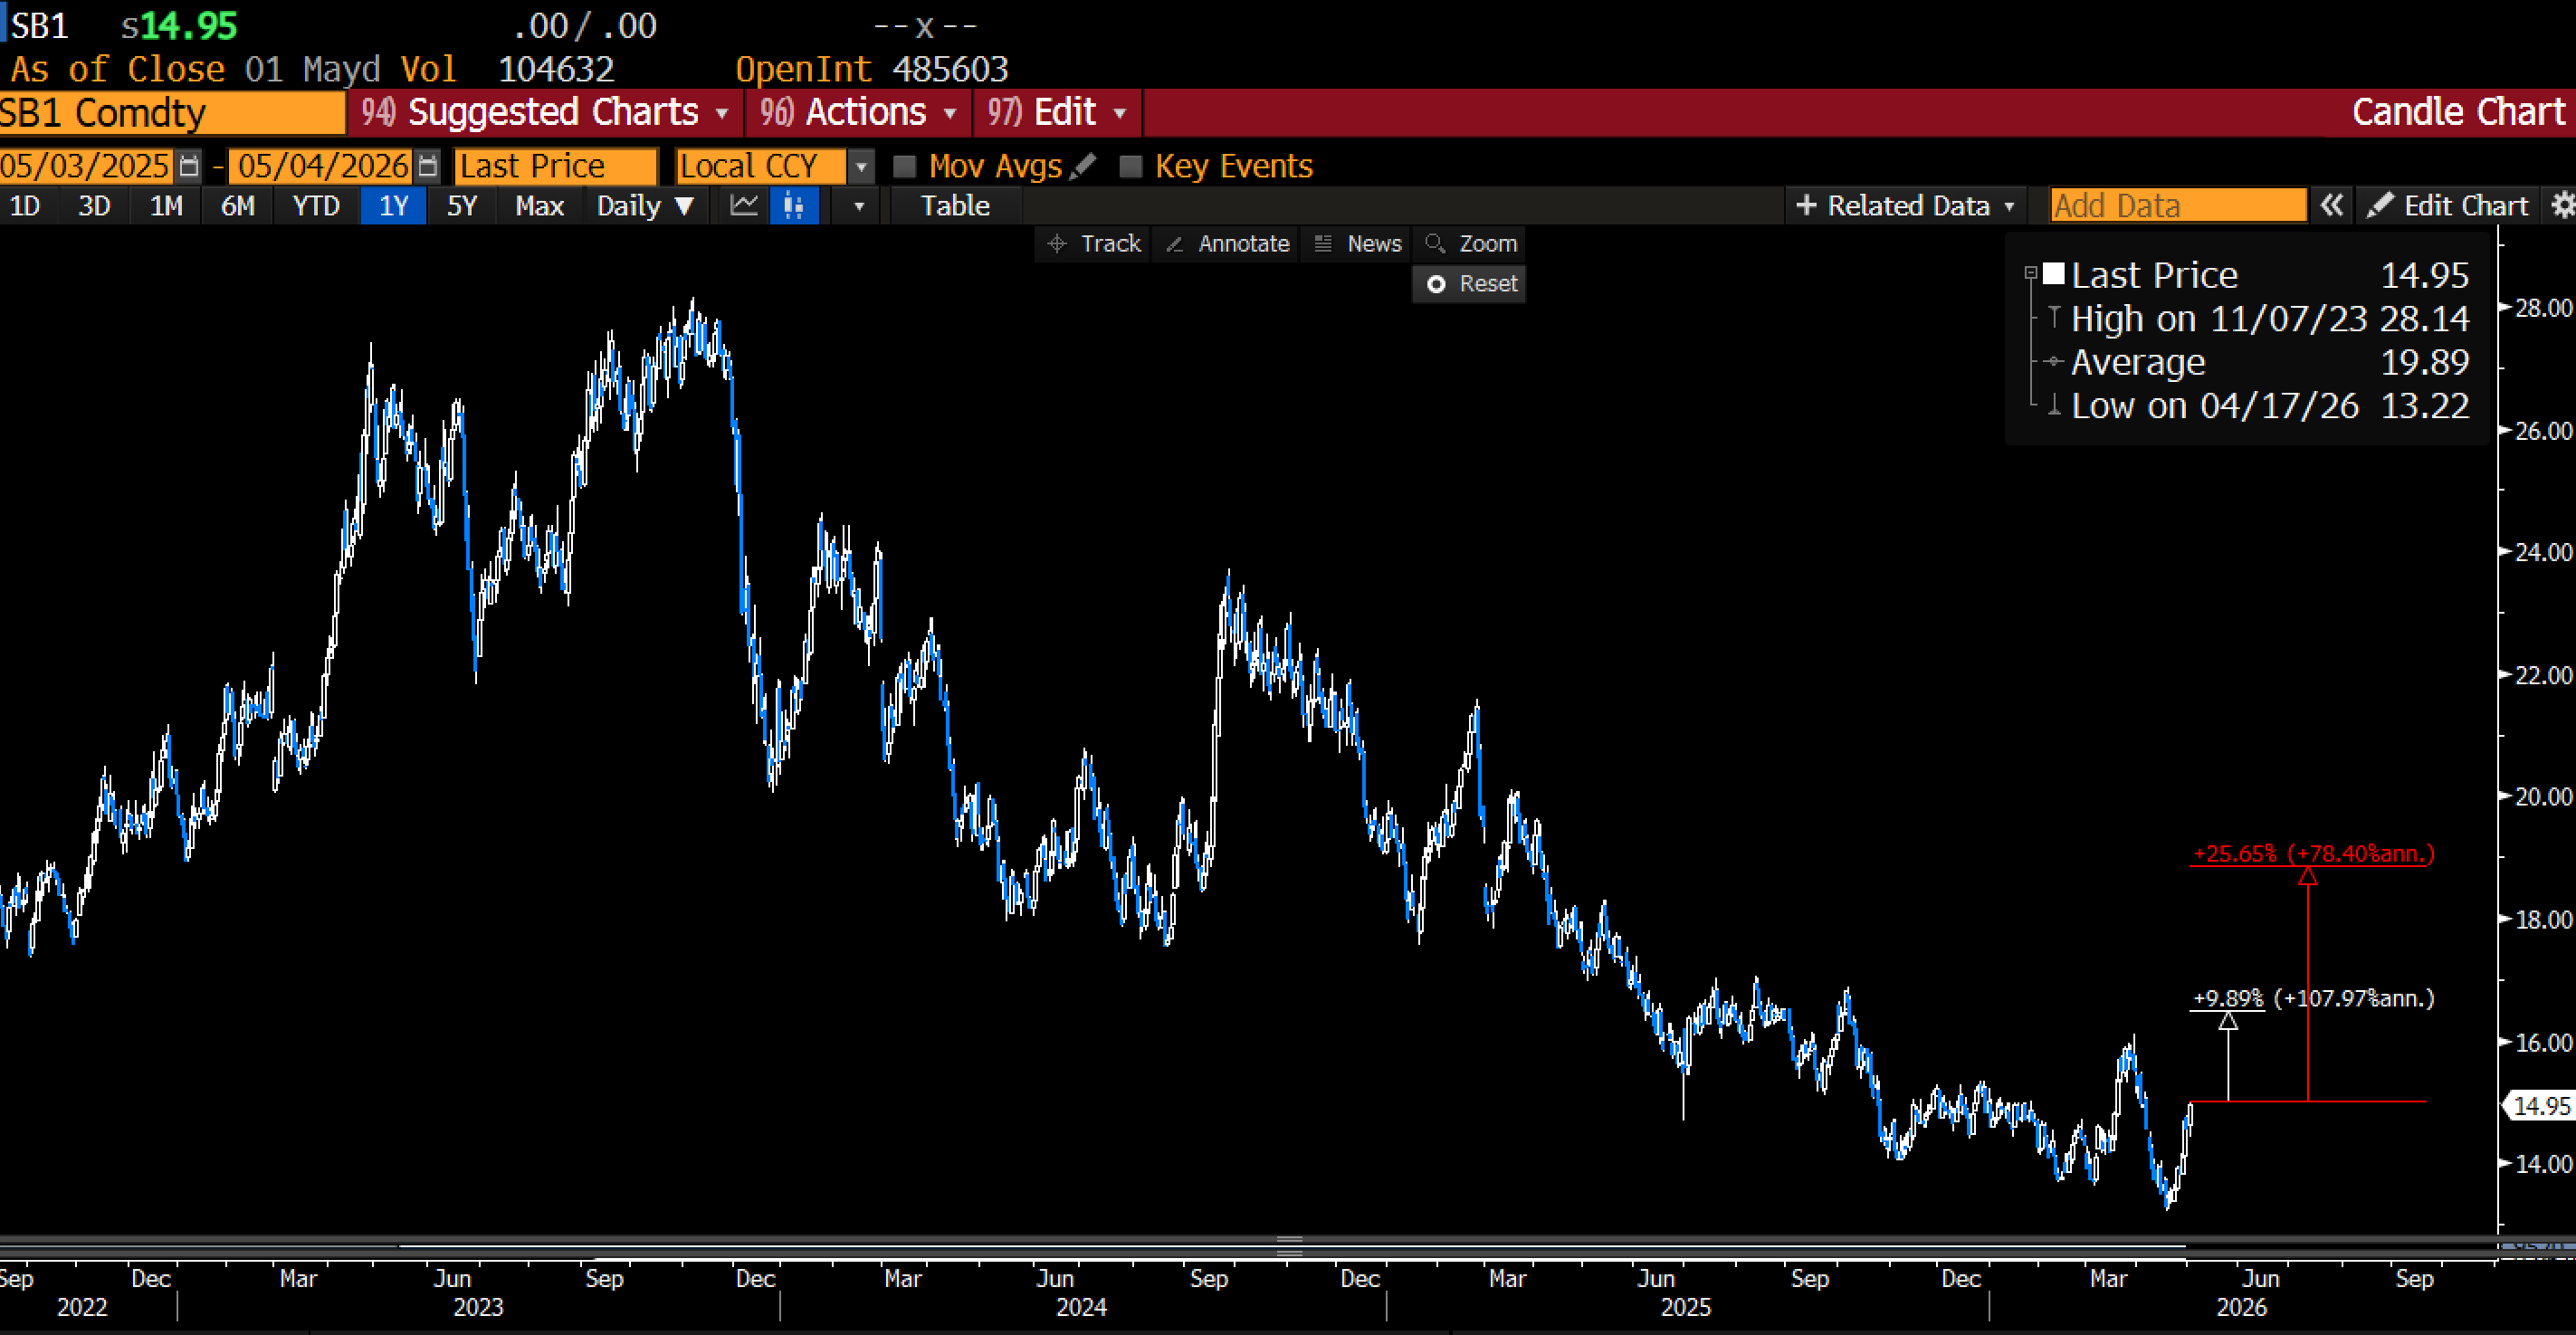
Sugar #11, the global benchmark traded in New York, closed Friday at 14.95 cents per pound. It has barely moved.
We think the consensus is wrong. We think the surplus is already gone, and the market hasn’t counted yet.
The Mills Just Voted
Brazil’s sugarcane harvest started April 1. The cane gets crushed over about eight months, from April through November. Every two weeks, UNICA (Brazil’s sugarcane industry association) publishes how much of the crop went to sugar versus ethanol. That biweekly number is the single most important data point in the sugar market.
The first report just landed. In the first half of April, mills allocated 75% of their cane to ethanol and just 25% to sugar.

Same period last year was 56/44. The fifteen-year average opening split is roughly 53/47. The highest-ever opening prints, in the 2018 and 2019 super-ethanol seasons, were around 60%.
This opened fifteen points above those.
One more thing worth noting: on Friday, sugar closed up while crude oil closed down. That divergence is a tell. The market is starting to figure out that the supply squeeze is real, independent of the daily moves in Brent.
Why: The Price Stack
Why would mills choose ethanol so aggressively? Because sugar is not competitive with ethanol right now, and it is not close. To see why, you need to follow the full chain of fuel prices in Brazil, from what gasoline should cost all the way down to what mills actually get paid.
Here is the price stack, converted to dollars per gallon:
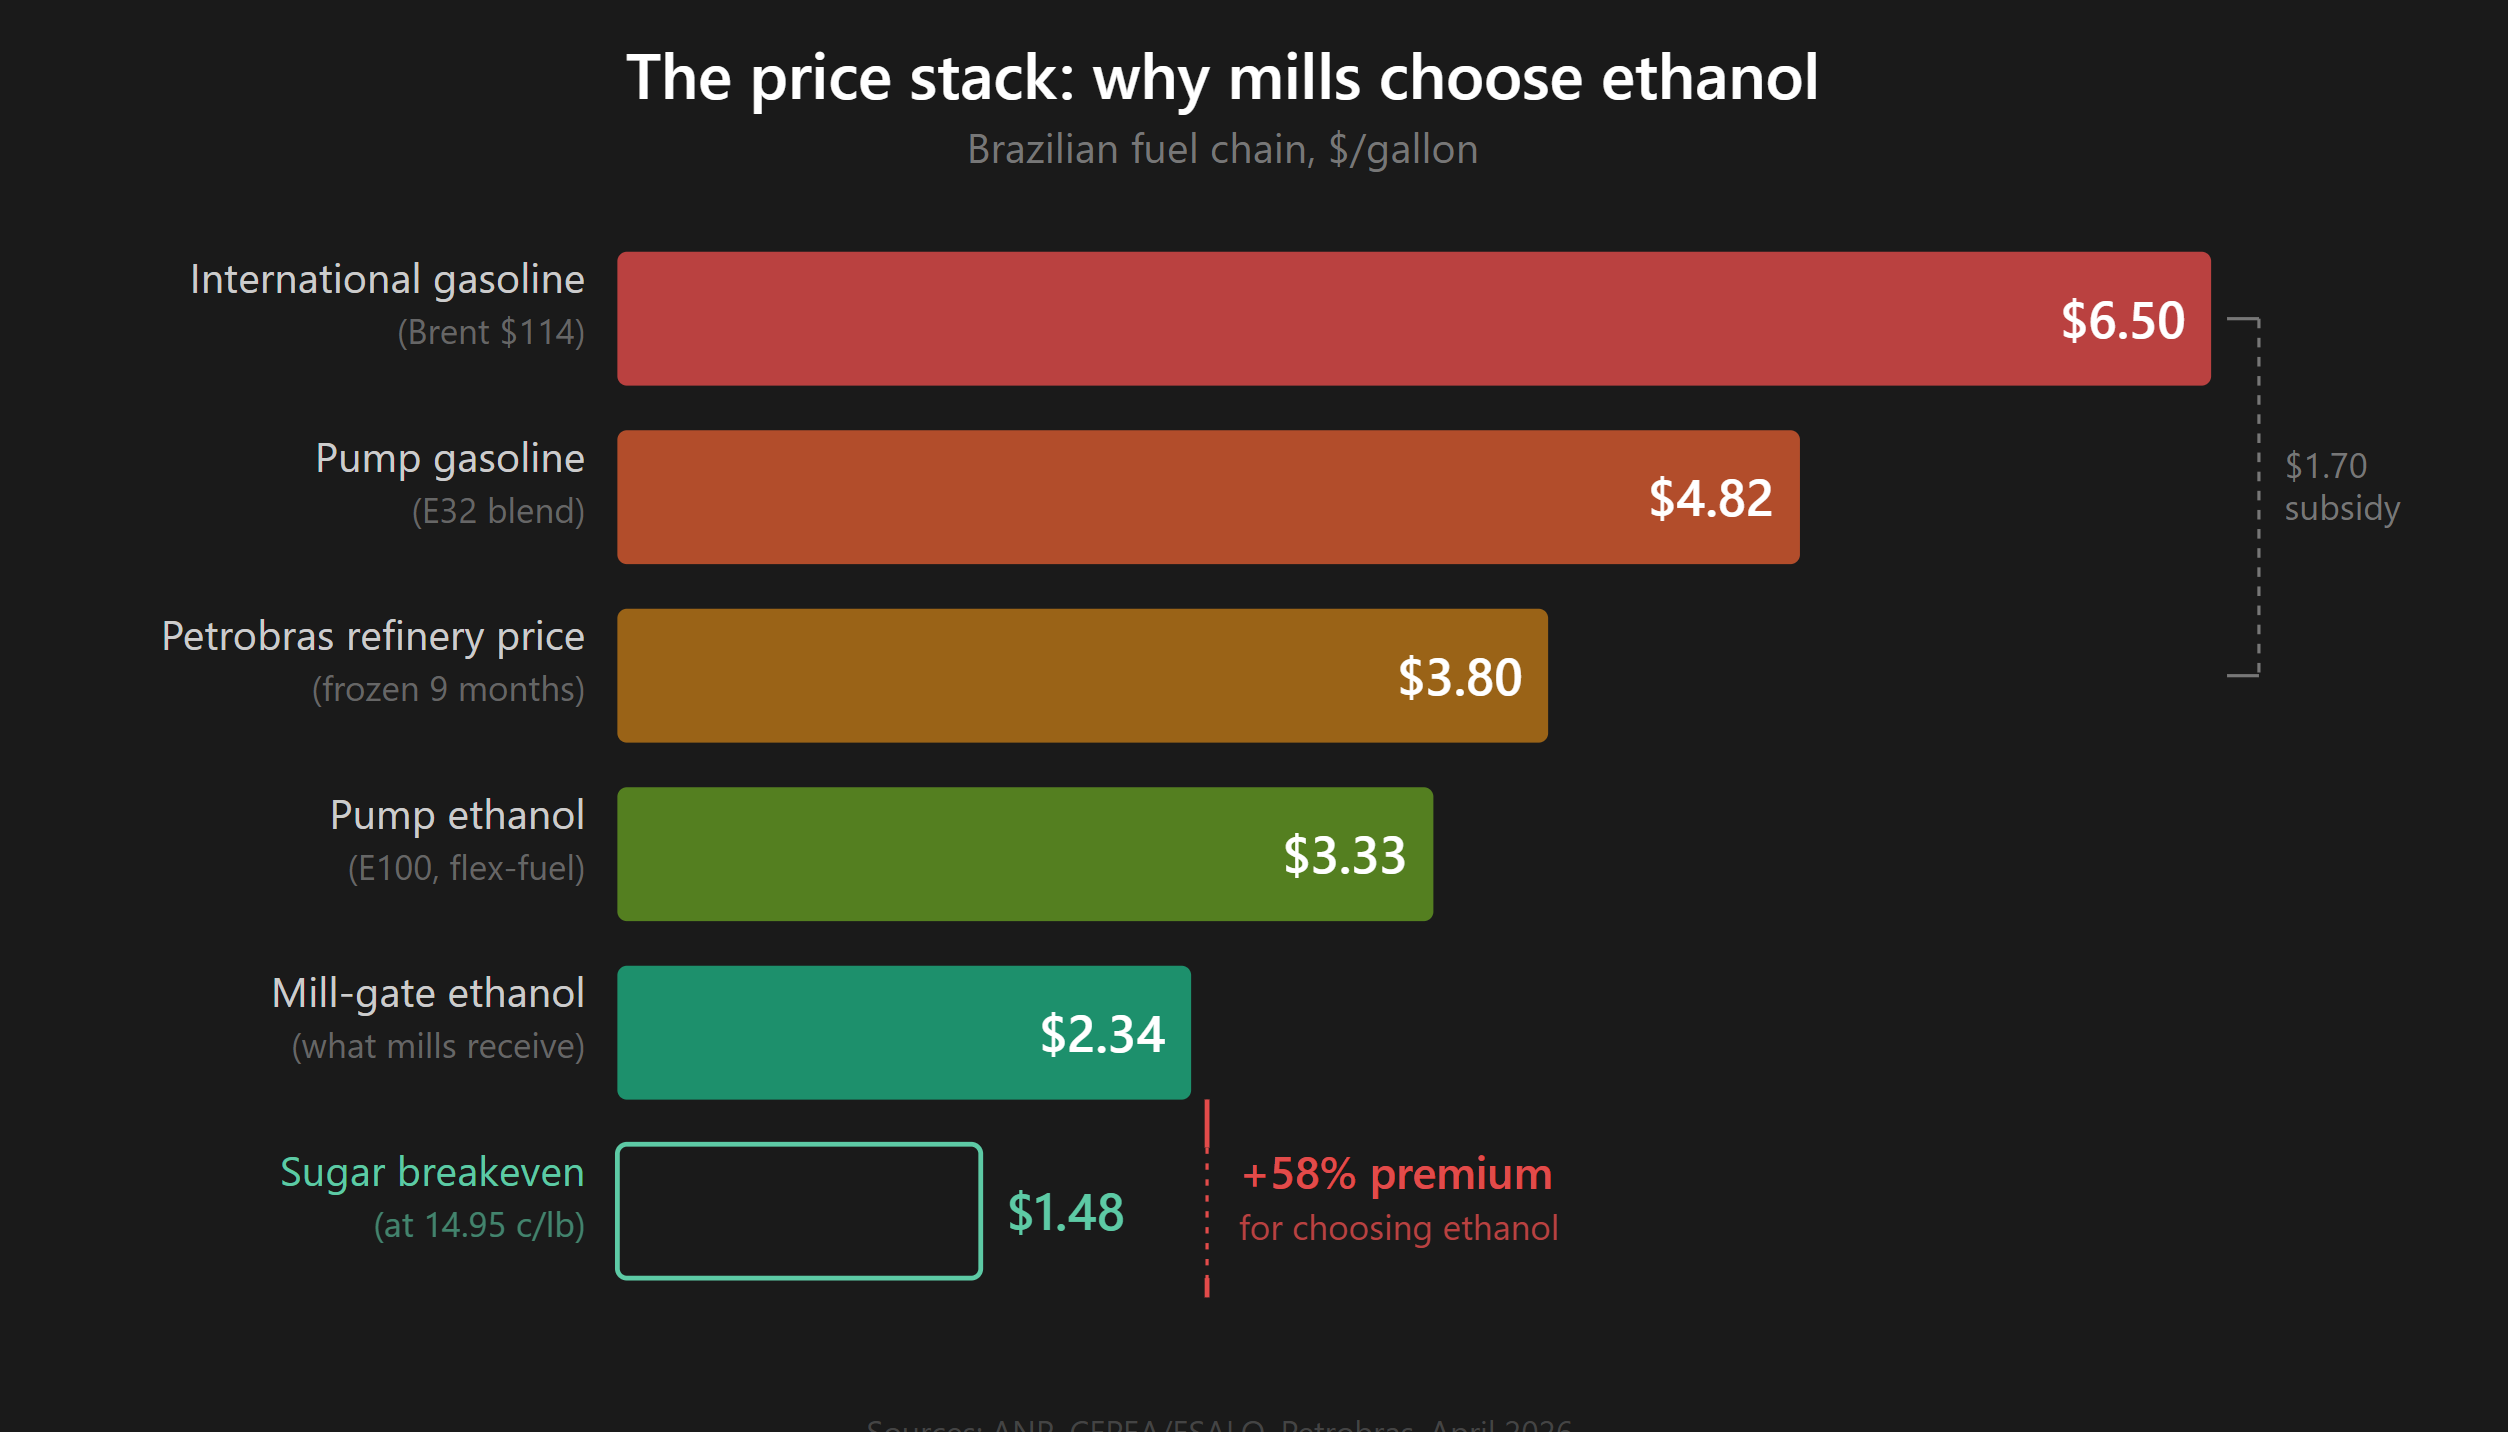
Every row is above the row below it. Mills are getting $2.34 per gallon for ethanol. They only need $1.48 to match sugar. That is a 58% premium for choosing ethanol. No rational mill makes sugar at these economics.
And this is with gasoline artificially suppressed. Petrobras, Brazil’s state oil company, has frozen refinery prices for nine months. The gap to international parity is roughly $1.70 per gallon. That freeze costs Petrobras about $20 billion a year in foregone earnings, or 45% of last year’s profits. It is mathematically unsustainable, and the pressure on the board to adjust prices is mounting. But Lula is unlikely to allow any change before October’s municipal elections. The 2018 truckers’ strike that brought down the last Petrobras CEO who tried to pass through international prices is the precedent the entire political class is structured around. So for now, the freeze holds, and Lula needs other levers.
His cleanest lever is the ethanol mandate. He cannot make gasoline cheaper, but he can stretch the barrel by blending more ethanol into it. On May 1, Brazil’s energy council (CNPE) voted to raise the mandatory ethanol blend in gasoline from 30% to 32%, known as E32. They also raised the biodiesel blend from 14% to 16%, which pulls soy oil out of the food complex. Energy Minister Silveira framed it explicitly: the goal is to “zerar importações de gasolina,” eliminate gasoline imports entirely.
The mills already knew. They started crushing two weeks before the vote like it had already happened. It had. They just got the formal piece of paper on May 1.
Here is the critical insight: the Petrobras freeze is not what makes this trade work. The Petrobras freeze is what is holding the trade back. Even at suppressed domestic gasoline, ethanol pays 58% more than sugar. If the freeze breaks after October, gasoline jumps to international parity, ethanol follows, and the crush pushes even harder. Sugar would need to rally to 23 cents per pound before mills become indifferent at current frozen prices. At international parity, it would need to hit 30 cents.
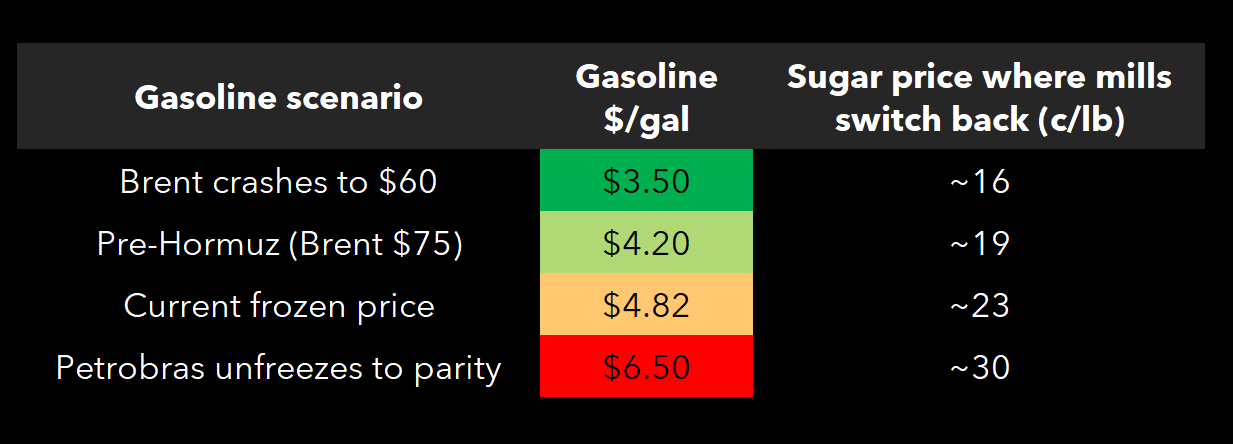
Sugar at 14.95 cents is not even in the conversation. The mills have no reason to make sugar at any gasoline price above $3.50 per gallon, and gasoline hasn’t been that cheap in Brazil since 2020.
What This Means for the Global Balance
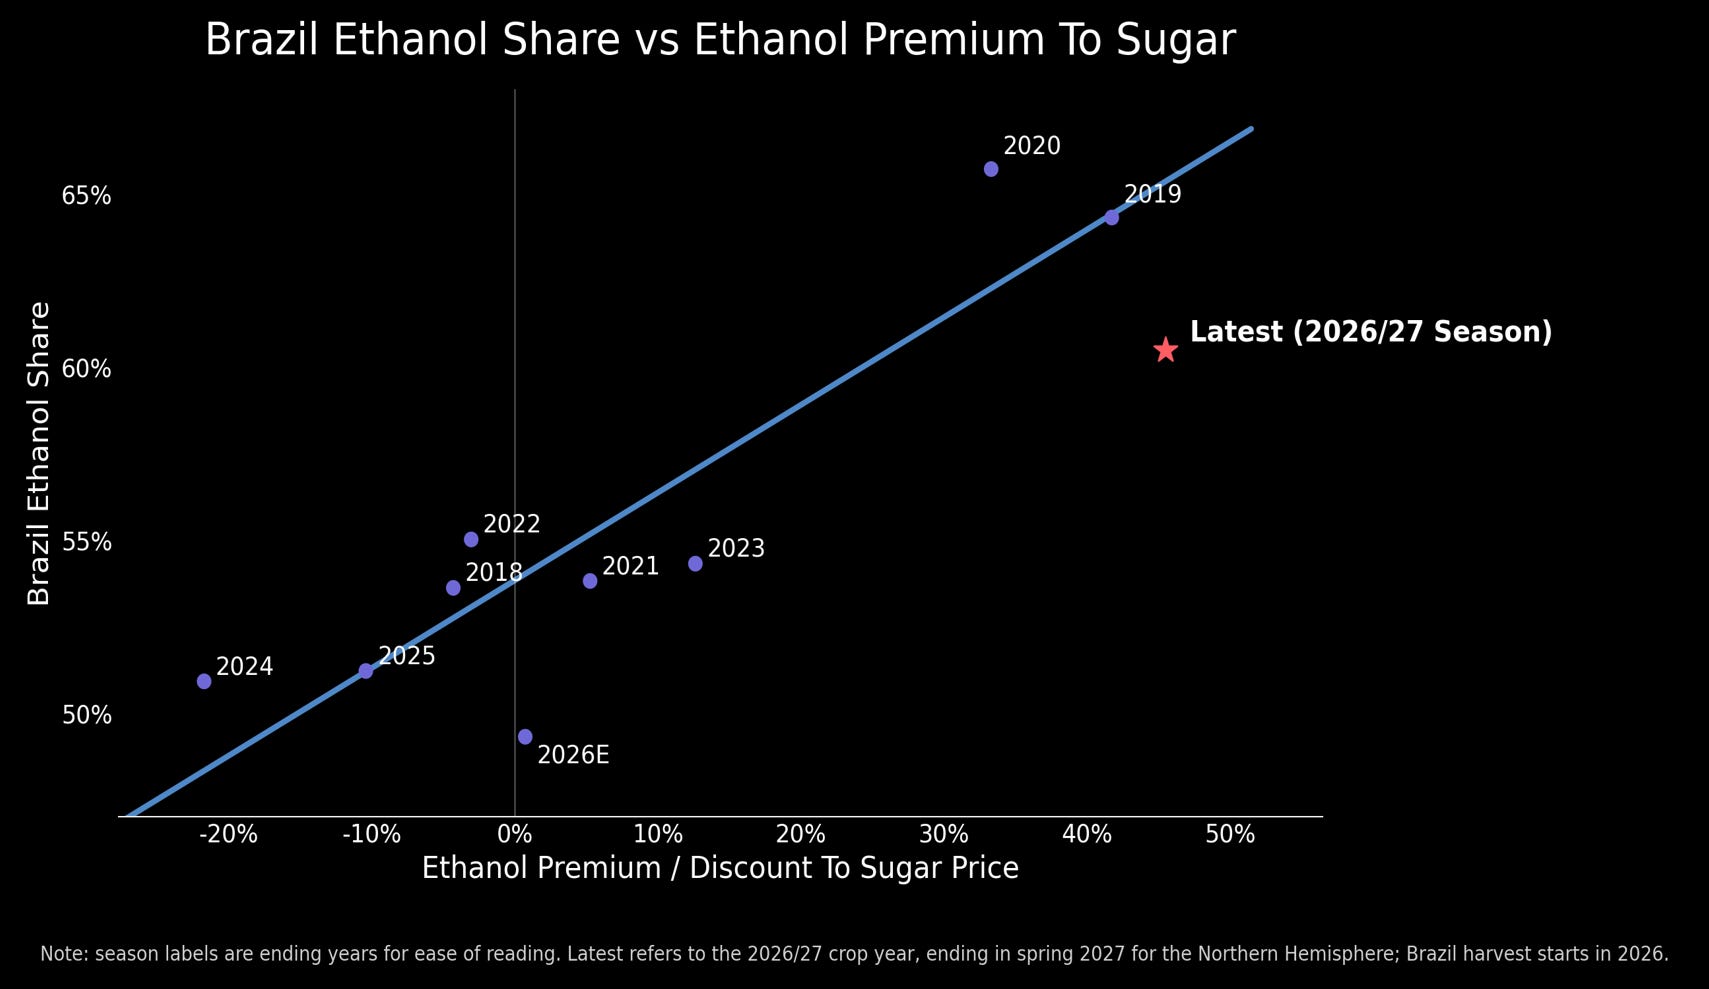
Each percentage point of ethanol share above the consensus 52% removes about 850,000 tonnes of sugar from the world market. The opening fortnight print of 75% will fade as the season progresses and the sugar content of the cane rises with maturity, but even with the typical seasonal normalization, we estimate the full-year crush will come in around 58-62%. At 60%, that is roughly 7 million tonnes less sugar than what the consensus assumed.
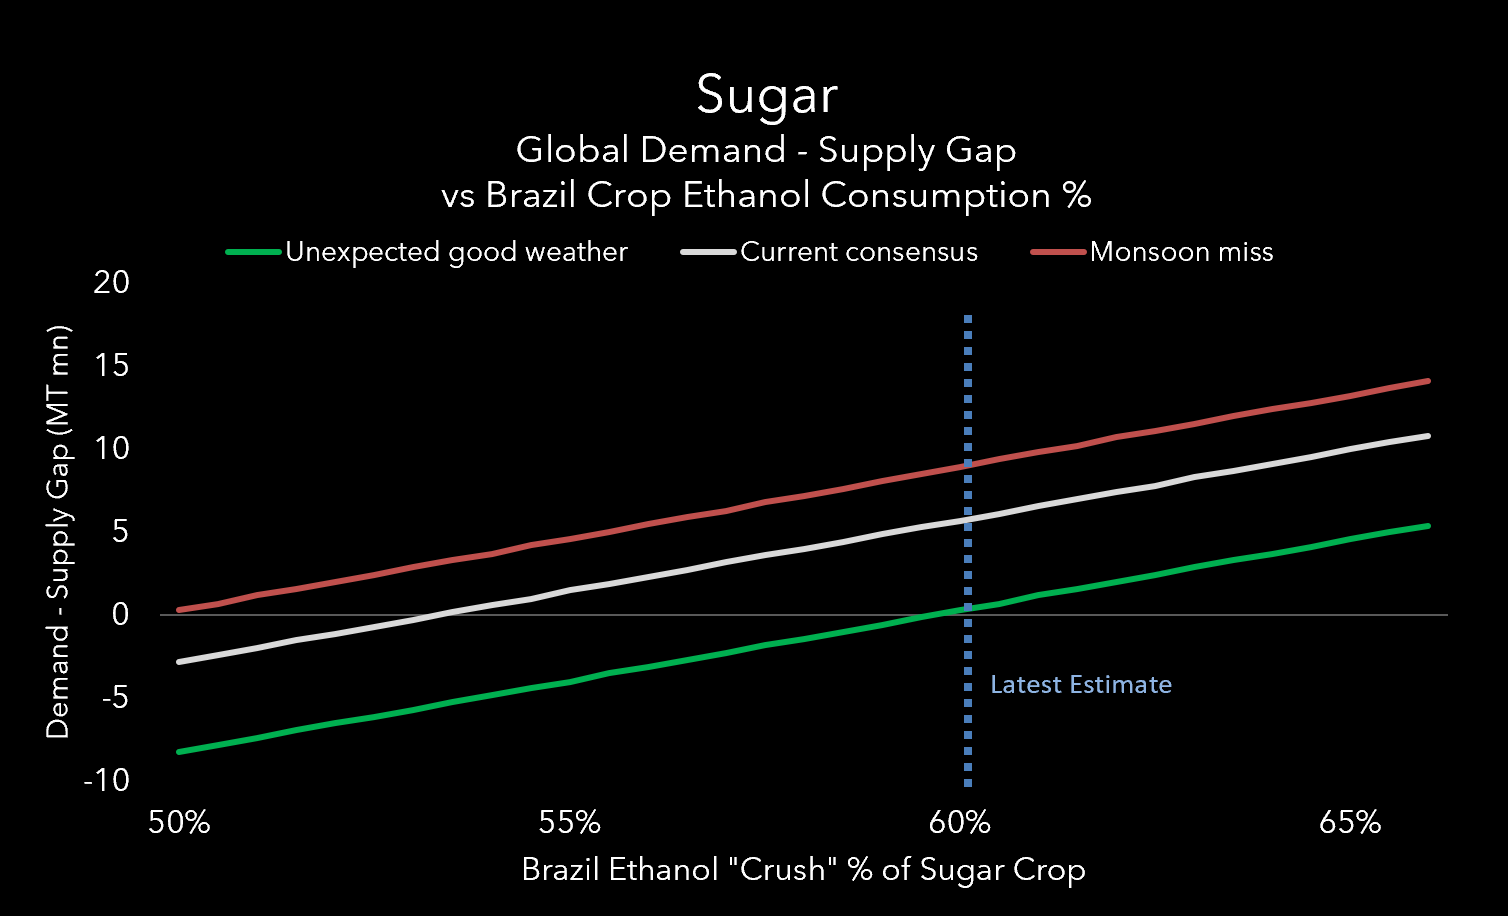
The chart above shows the global demand-supply gap at different levels of Brazilian ethanol crush. The three lines represent different assumptions about the rest of the world: a scenario where India and Thailand have unexpectedly good weather, the current market consensus, and a scenario where the Indian monsoon disappoints.
The consensus heading into the year was a small surplus. At 60% crush, that flips to a deficit of 4 to 6 million tonnes depending on what happens elsewhere. At 55%, which is below the fifteen-year median and well below what the parity gap implies, the surplus is already gone.
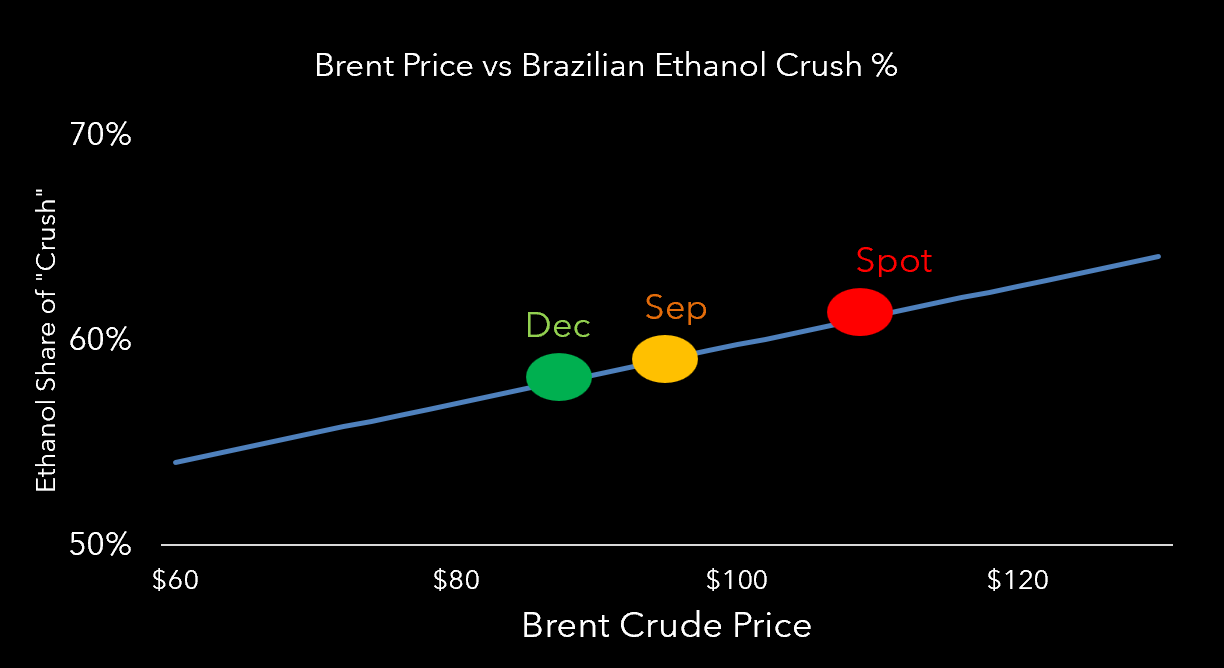
The crush season runs April through November. Brent is $114 at spot and roughly $95 on the forward strip through the end of that window. At spot, our model implies 60-62% crush. At strip, 57-59%. Either way, well above the consensus 52%. The market is pricing a crude collapse it hasn’t bothered to check.

What Could Make This Bigger
Higher ethanol mandates. E32 just passed. The 180-day review window puts the next decision in November, right after the election. If Brent stays high and Lula wins, E35 is the obvious next step. E32 alone removes 1.5 to 2 million tonnes of sugar from the global balance. E35 removes another 1 to 2 million on top. The biodiesel raise to B16, passed the same day, tells you the political commitment is real across every biofuel lever Lula can reach.
Higher domestic energy prices. If Petrobras eventually unfreezes, domestic gasoline jumps, ethanol follows, and the crush intensifies. Paradoxically, higher energy prices in Brazil would also lift the sugar-equivalent floor: the price at which mills rotate back to sugar rises with gasoline. Sugar rallies, but not enough to restore supply. The equilibrium price moves up, it does not revert.
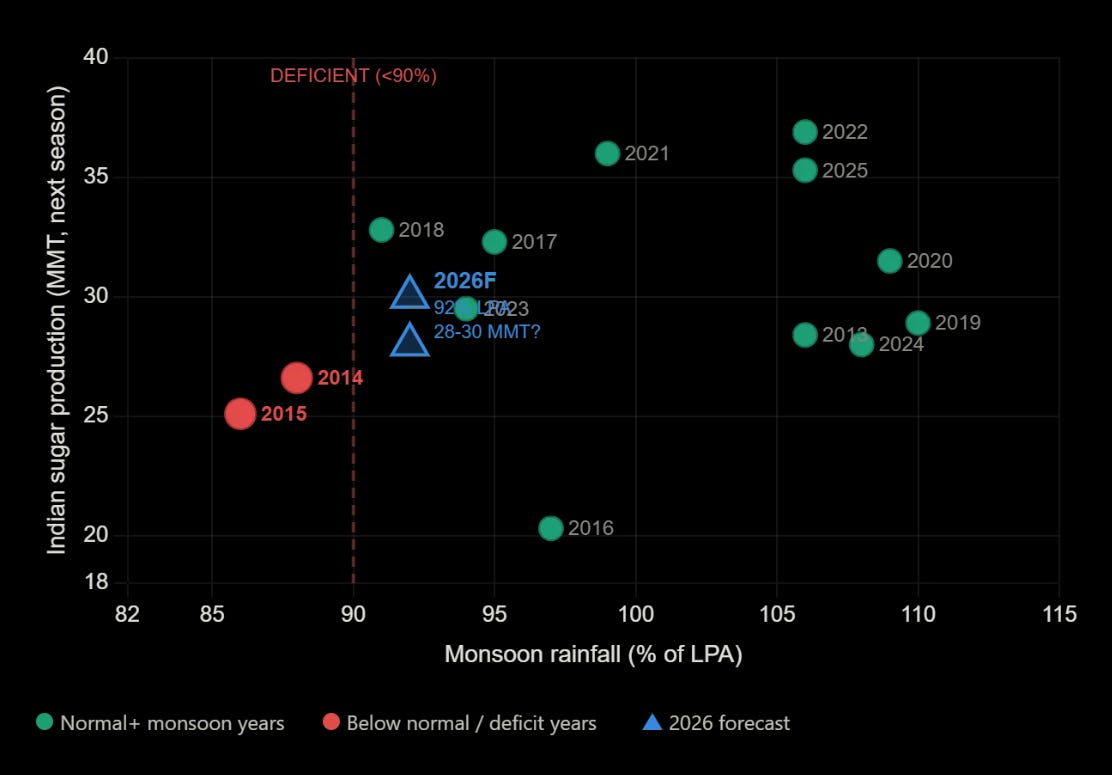
Indian monsoon. India is the second-largest producer and the swing exporter. India’s weather bureau (IMD) issued a below-normal monsoon forecast on April 13: 92% of the long-period average (the benchmark for total June-September rainfall, averaged from 1971-2020), with a 35% chance of deficient rainfall. That is the first below-normal April call since 2015, which preceded the El Niño that helped drive sugar from 11 to 23 cents in nine months.
India has two ways to tighten global sugar, and they work through completely different channels. The first is weather. Maharashtra and Karnataka together produce about 50% of Indian sugar, and both are heavily rain-fed. A bad monsoon physically reduces production by 3 to 5 million tonnes over the following year and triggers the government to ban exports. A monsoon miss flips India from putting 2-3 million tonnes on the world market to pulling 3 million tonnes off it. That is a 5-6 million tonne swing in global trade, and no other country can move the balance that fast.
The second channel is ethanol policy, and here the picture is more complicated. India has built roughly 9 billion liters of sugarcane-based ethanol capacity under its E20 program (a 20% mandatory ethanol blend in gasoline, similar in concept to Brazil’s mandate). The original government roadmap projected sugarcane contributing 55% of that ethanol. But under the current supply year, sugarcane has been allocated only 28% while grain-based ethanol got the rest. The government effectively chose grain over cane, which means more sugar stays in the domestic pool, not less. The ethanol channel is going the wrong direction for the sugar bull thesis right now. But that policy was set before Brent hit $114. India’s fuel import bill is the political pressure point, and the sugar industry now has a stronger argument at the Prime Minister’s office: sugarcane ethanol capacity exists, it’s sitting idle, and every liter reduces the crude import bill. An upgrade to E22 (a 22% blend) would divert another 1.5 to 2 million tonnes of sugar into fuel. That is upside we are not paying for, but it could arrive anytime between now and October.
I am not building the trade on India. But the tail is meaningful. The end-of-May IMD second-stage forecast, which adds the regional breakdown for the sugar belt, is the next checkpoint.
Speculative positioning. Agricultural commodity speculators have been reportedly turning long in grains, but our read is that sugar specs are still net short. A positioning squeeze on top of a fundamental deficit is the accelerant, not the cause, but it matters for timing.

What Could Make The Demand/Supply Gap Smaller
Much better weather everywhere. A normal monsoon in India, a full recovery in Thailand, no disruptions anywhere. Even in that scenario, our model shows a 58% crush wipes out the surplus. You need crush below 55% for the surplus to survive, and the parity gap says that is unlikely.
Peace. A rapid resolution at Hormuz drops Brent back to $70-75, compresses the parity gap, and the crush fades toward 53-55%. Sugar stays around 14-16 cents. This is the clean invalidation of the thesis. It requires the same thing that invalidates the broader Cascade.
The Historical Pattern
Historically, every sugar deficit of 5 million tonnes or greater has produced at least a 50% price rally. The one exception was 2018, which ran the largest deficit on record but barely moved price. The reason: it followed a record surplus and stocks-to-use was at multi-decade highs. The system had a cushion thick enough to absorb the shortfall without rationing through price.
Today, stocks-to-use sits below the historical average. Same deficit, thinner cushion.
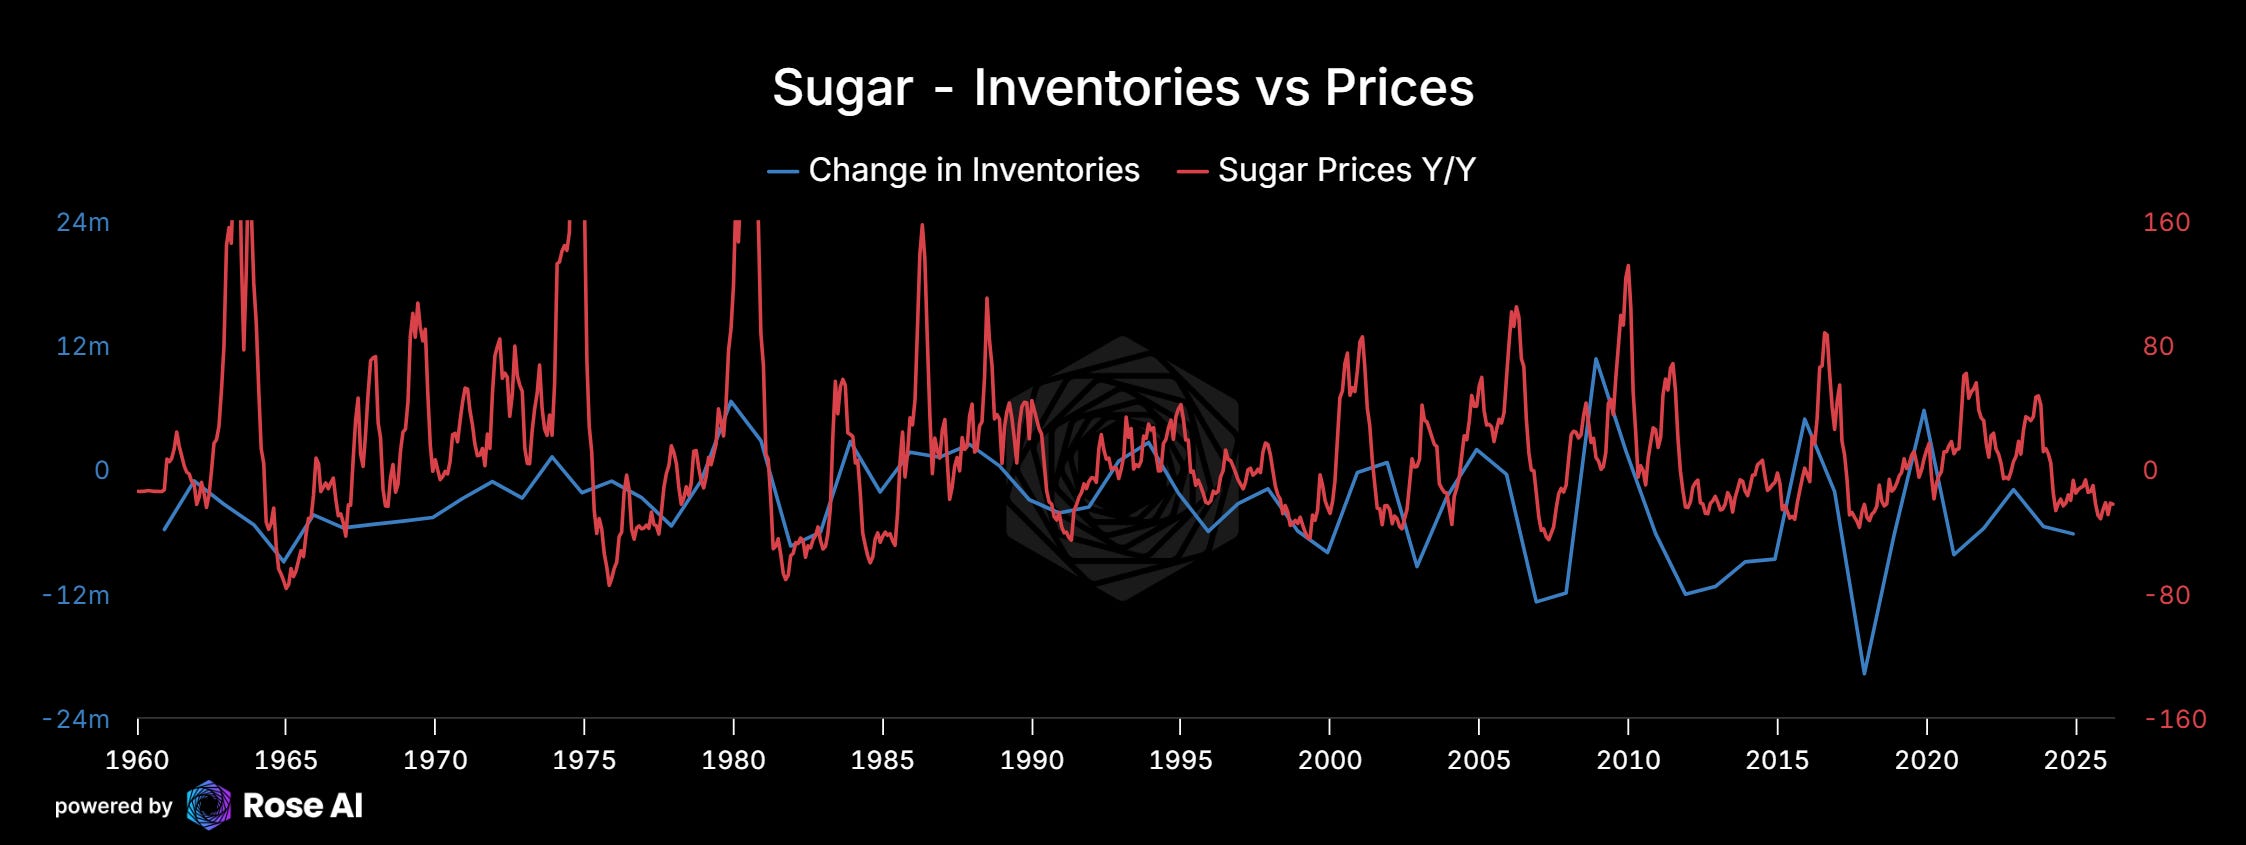
At our base case of a 7 million tonne deficit, the historical analog points to sugar in the low-to-mid 20s. At the tail case, where Brazil crushes 60%+ and the Indian monsoon misses, the analog is 2009, when sugar went from 11 cents to 30 cents in eighteen months. That was the largest single-year stock draw on the 65-year chart and it produced the biggest sugar rally of the modern era.
The Trade
I am long sugar optionality in the 15-18 cent range. The downside is bounded by ethanol parity: sugar cannot fall far before mills mechanically cut ethanol production and restore sugar supply. The upside is open, with multiple catalysts stacked through the summer.

Forward call volatility on the March 2027 18-cent strike sits where it sat when Brent was $80. The market has not repriced the optionality for ~$110 crude.
The catalysts, in order:
Late May: IMD second-stage monsoon forecast with regional breakdown for the sugar belt
June through September: UNICA biweekly crush reports, each a real-time read on the mix
June through August: Brazilian diesel stockout window, which forces further ethanol substitution
October: ISMA first Indian crop estimate and Brazilian municipal elections
November: CNPE E35 extension decision and Indian export policy for the new season
The crush season runs through November. Each of those events is independently bullish sugar. The convexity is in the conditional correlation: they are all driven by the same upstream variable, Hormuz keeping Brent elevated.
The mills have voted. The government confirmed the ballot on May 1. The market has not yet counted.
What would be the best way to play this trade without options ?
Alex, I'm a paid subscriber. You spent hours on this writeup, yet in the The Trade section, the text has no trade mechanics (strike, expiration, etc.). The graphic for the trade is inexact and unclear. I guess you are suggesting placing a trade for a call spread, short at the 18.50 to 18.75 strike, and long at the 16 to 16.50 strike, with an August, Sept. or Oct. expiration? Along with another call spread, short at the 16..25 to 16.75 strike and long at the 14.75 to 15.25 strike, with a June or July expiration? What is the expiration date for the underlying futures contract?