

A New Oil Era
The Cartel Cracks

I know I know, you don’t need me telling you why you should be bullish on days when the market is up 7%.
In my defense, we communicated this to paid subs in our portfolio review Monday. We are now long 10% crude through a combination of upside broken butterflys (we buy calls near the money, sell a couple out of the money, and then buy the deep tail back in case things get pretty wacky).
We did this for two reasons.
First, our UK Rates (SONIA) and gold positions had picked up way too much short oil beta. The Cascade trade of long Agricultural futures (Wheat, Corn, Sugar, and now a bit of Live Cattle) weren’t going up enough on days oil went up, and we were getting whacked on our long rates and gold positions. We needed to close the hole in the portfolio.
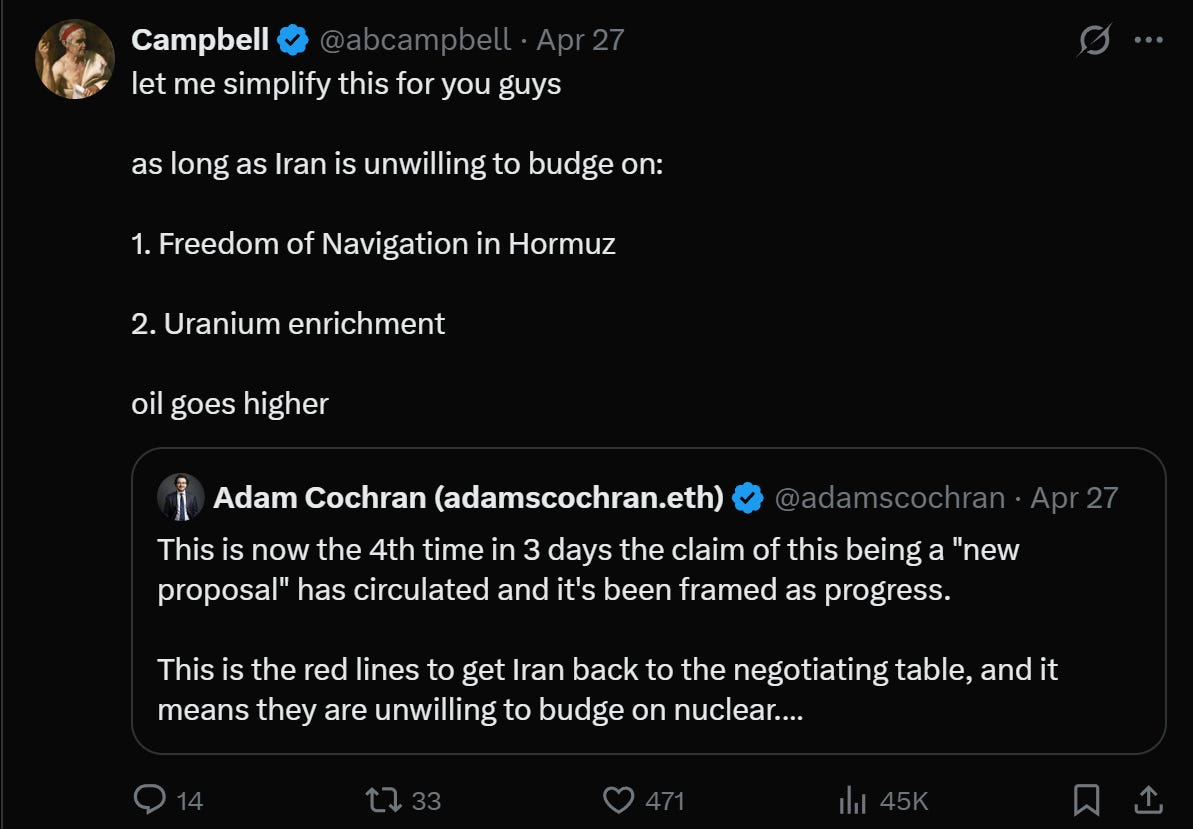
Second, the Venn diagram of potential agreement spaces between the US and Iran looked to be shrinking every day. The space an economist might call the “gains to trade area” was collapsing. Or as I put it in a cheeky tweet:
Now, for the record: I have no special info on predicting whether there will or won’t be conflict. I read the tapes like anyone else. But over the last couple of weeks, a few things became clear.
Iran had no intention of giving up its enrichment program. The government in Tehran was split between two blocs with different incentives: moderates looking to make a deal out of Parliament, and ideologues based out of the IRGC, many of whom just watched their fathers get killed by the US and Israel. And underneath all of it, Iran harbored deep ambitions for controlling Hormuz.
On the other side, the US pulled off something clever. By shifting the locus of conflict from “will the US invade, that’s too much blood and treasure” to “we’ll sit outside YOUR blockade and impose our own,” the US shifted the dynamic to one that is locally stable, even if it’s globally another notch of escalation with respect to the real long-term adversary, China.
In the meantime, US stocks ripped on the back of three things: the AI acceleration (which we are still long, though not as much as we were going in, so boo), American Energy Dominance (lower global energy production will inevitably lead to a boom in the folks who produce, pipeline, and export our abundant LNG to a world desperate for new supplies), and the fact that markets have not yet priced in substantial and sustained inflationary impacts from the conflict. Partly from the lid on oil, partly from expectations of a quick resolution.
Which adds cards to Trump’s hand and takes them away from Iran.
The Old Order Is Fracturing
Which brings us to the earth-shattering news: the UAE is leaving OPEC.
In retrospect, predictable.
For the past 5-10 years we’ve been hearing nonstop that the “old world order was dying” and “we need to prepare for a new global order.” The implication being, of course, that China would run that new era at the expense of Pax Americana. Ironically, 26 years into the 21st century, things don’t really seem to be playing out that way.
OPEC was born out of pan-Arab, pan-Islamic alliance against the West. The current war in the Persian Gulf has seen Iran explicitly targeting energy and civilian infrastructure belonging to its Arab Muslim neighbors. Not “we took out a terrorist in an apartment building” targeting. “We’re threatening to destroy your way of life by going after the desalination plants” targeting.
If you were the UAE, how would you feel about being in the same club as those guys?
This is what decoupling looks like. And decoupling isn’t just the US and China. It’s decoupling from the old world order entirely: freedom of navigation, access to markets, low barriers to trade, grow the pie rather than fight over it. The UAE looked at the organization, looked at who was firing missiles at them, and walked.

The UAE has been sitting on massive spare capacity for years, constrained by OPEC quotas that made less and less sense as their relationship with member Iran deteriorated. Their production capacity is set to reach 5 million bpd by 2027, while their OPEC+ quota held them well below that. A 1.4 million bpd gap between what they can pump and what they were allowed to pump. Now the leash is off.
And here’s the kicker: long term, they don’t even need the Strait.
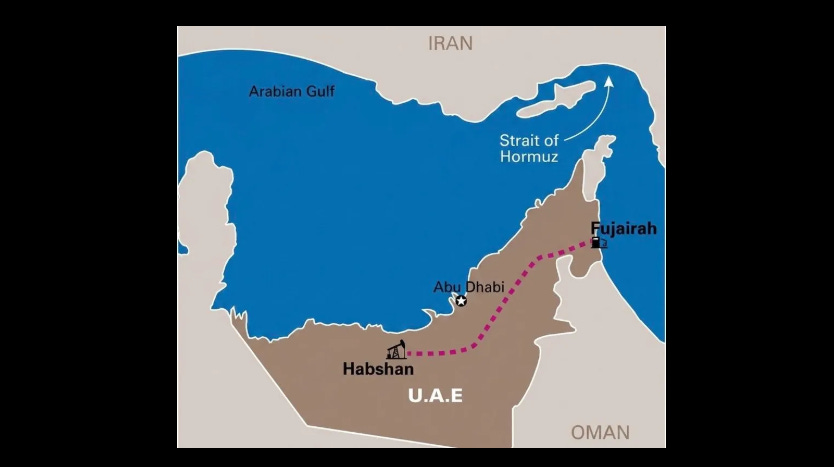
The Habshan-Fujairah pipeline gives the UAE a direct route from its western oil fields to the port of Fujairah on the Gulf of Oman, bypassing Hormuz entirely. While the rest of the Gulf sweats over the Strait, the UAE is building optionality out of the chokepoint. Maybe a treasury dollar swaps line was involved, maybe not, we’ll likely never know, but the petrodollar bears now have some serious egg on their face.
Where Is the Oil Market Today
Let’s get into the numbers.
Production

The headline: Total OPEC production collapsed from 28.5 mb/d in Q3 2025 to 20.8 mb/d in March 2026. That is a nearly 8,000 tb/d decline. The biggest movers: Saudi Arabia down 2,314 in March alone, Kuwait down 1,369, Iran down 182. The war is physically removing barrels from the market.
Total Declaration of Cooperation (OPEC + allies) production fell from 42,969 in Q4 2025 to 35,055 in March. Down almost 8,000 tb/d from peak.
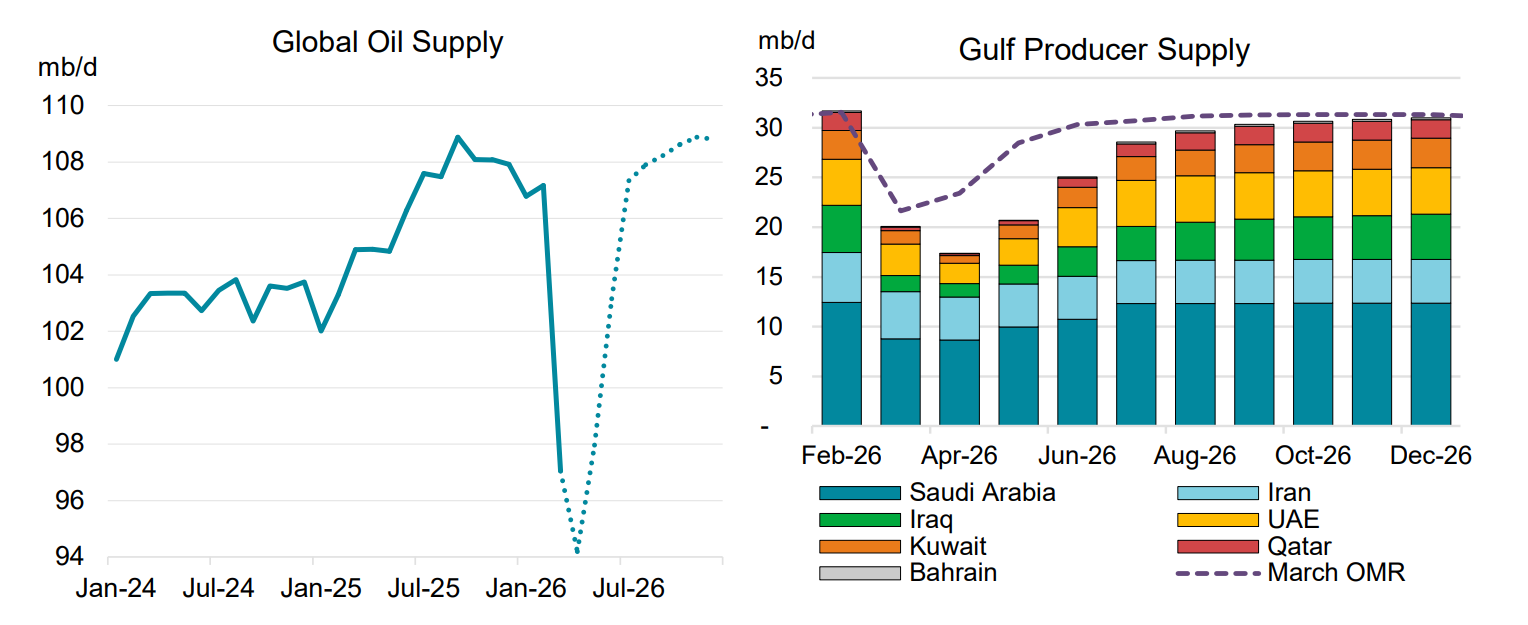
Global supply has fallen off a cliff. From roughly 103 mb/d in mid-2025 to below 98 and heading lower. The dotted line forward projection suggests further declines.
The Gulf producer stack tells the story in color. Saudi and Iran are the big drawdowns. UAE volumes also declining under the old OPEC framework, though that’s about to change now that they’ve walked. The March OMR trendline shows continued deterioration.
And don’t forget the supply side at home. If anything, oil rigs are down since the start of the crisis. US supply is not coming to the rescue anytime soon.
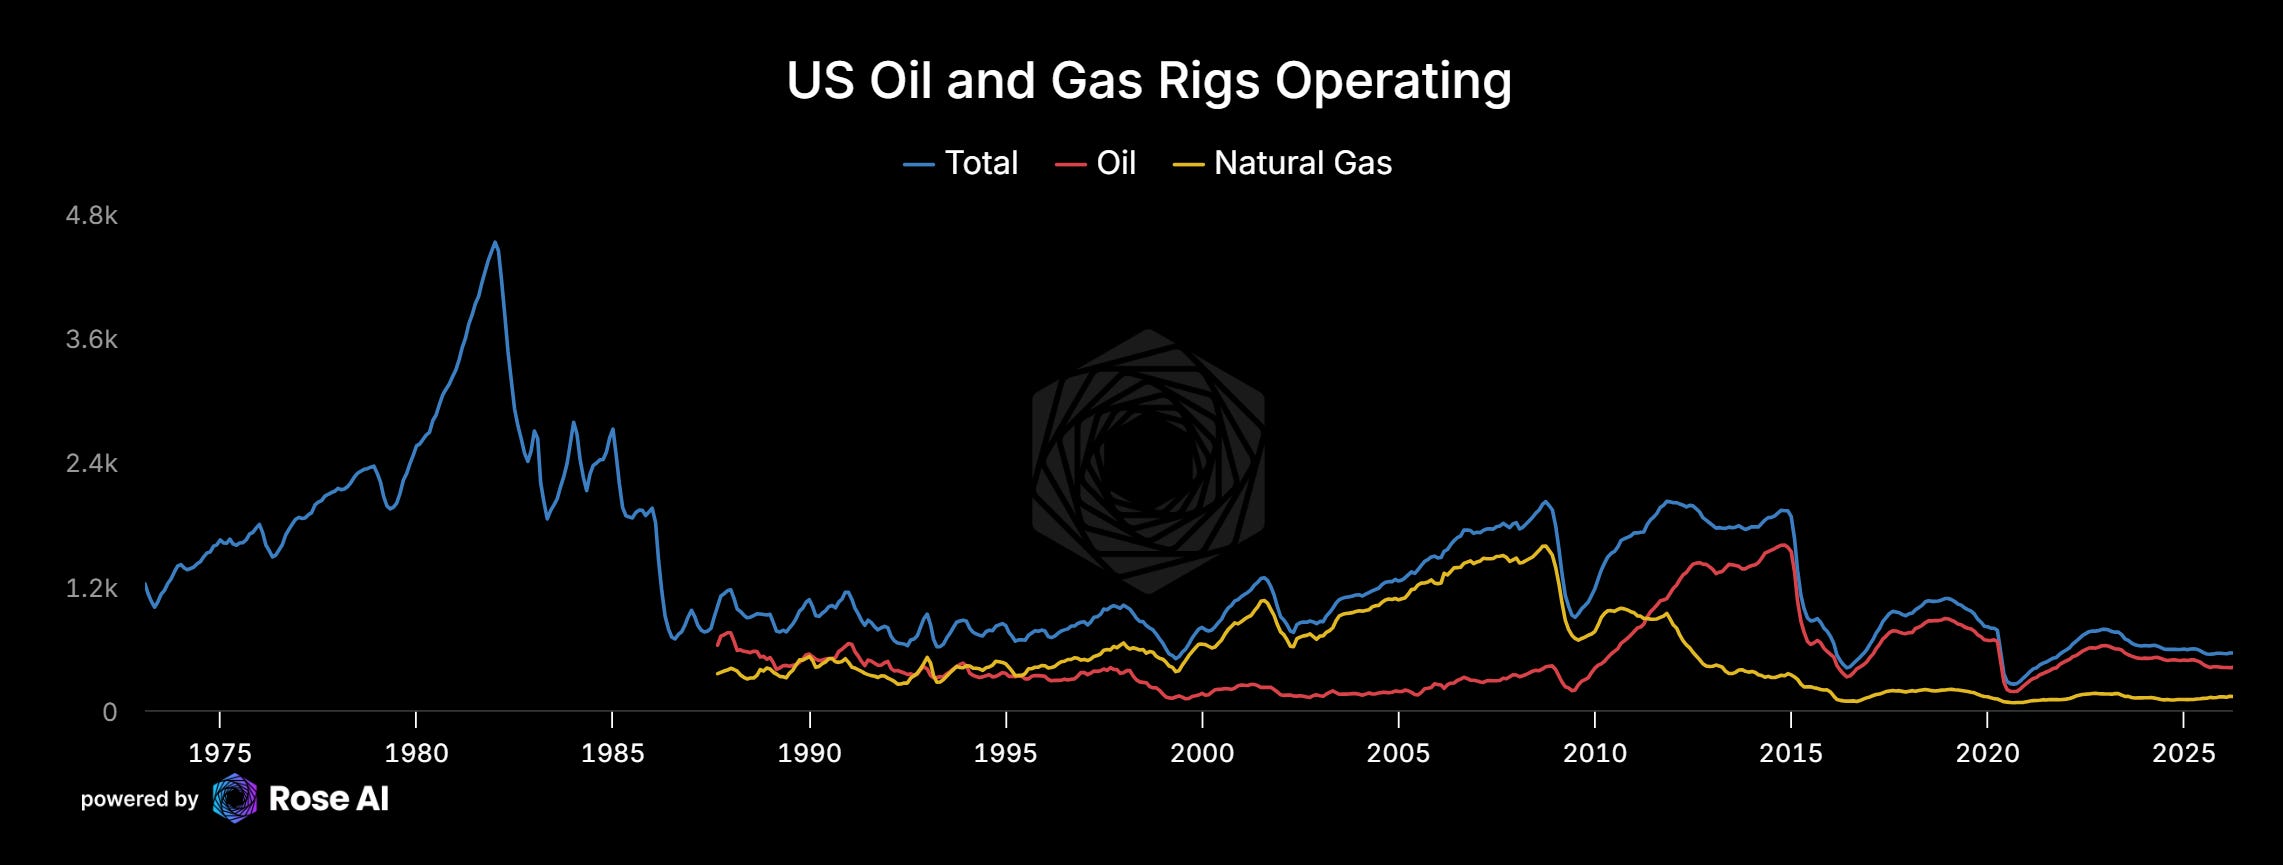
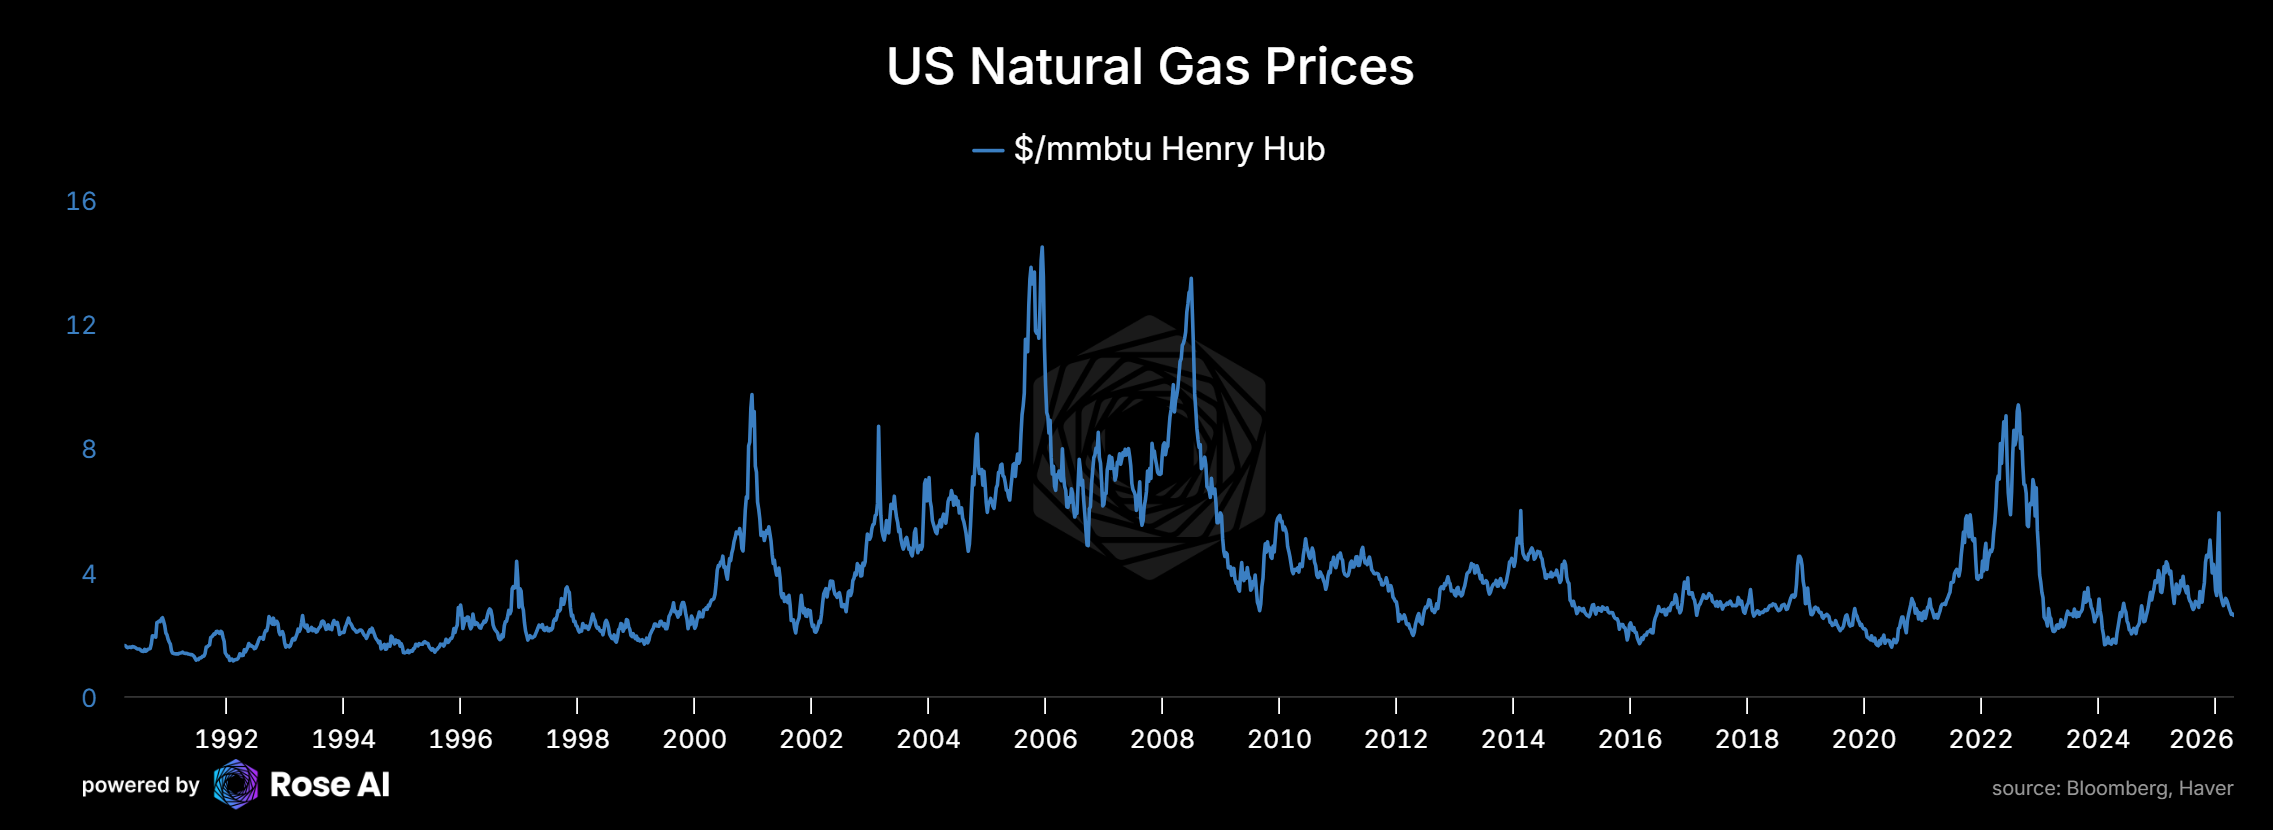
It doesn’t help that a lot of the profitability from US oil comes from natural gas and prices remain at the lows.
Shale isn’t coming to the rescue. Rig counts are down, drilled-but-uncompleted wells are depleted, and producers are prioritizing returns over growth. The US can increase production at the margin, but the days of shale as the global swing producer plugging every gap are behind us.
Inventories
The physical market is screaming.

Middle East floating storage has exploded. From near zero through most of 2025 to record highs. That’s crude that can’t find a home, bottled up, sitting on tankers because the onshore logistics through the Gulf are disrupted. This is what a chokepoint crisis looks like in the physical market.

Asia ex-China onshore stocks. In 2025, they tracked the seasonal average. In 2026, they’ve fallen off a cliff, dropping from ~600 mb in January to below 540 mb by April. That is a 60+ million barrel drawdown in three months, massively below both the 2025 path and the 2024-25 average. Refineries in Asia are running out of feedstock.
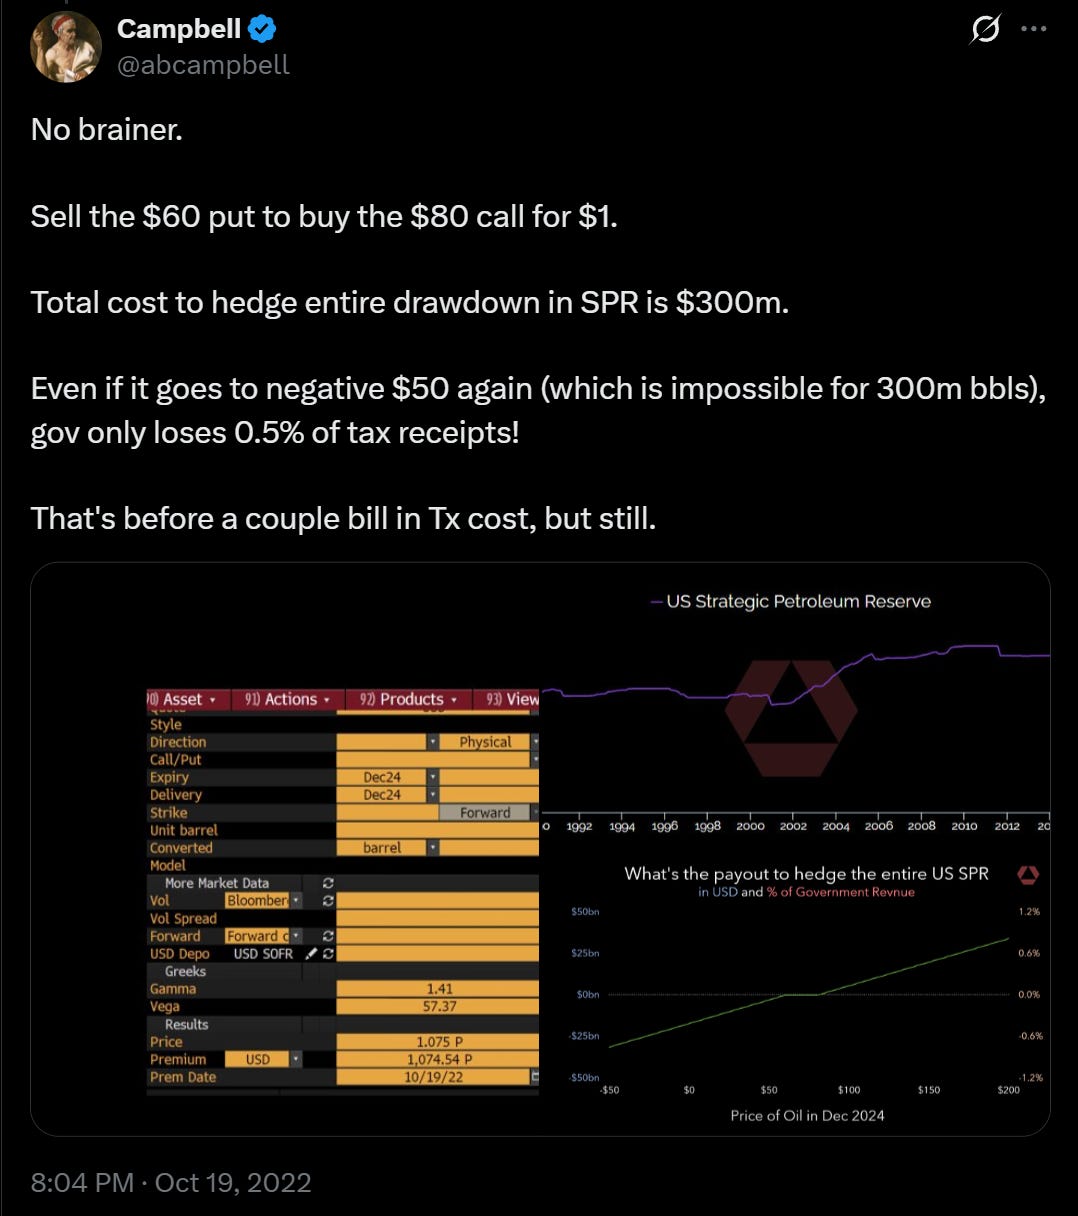
Let’s not forget the prior administration raiding the oil piggy bank.
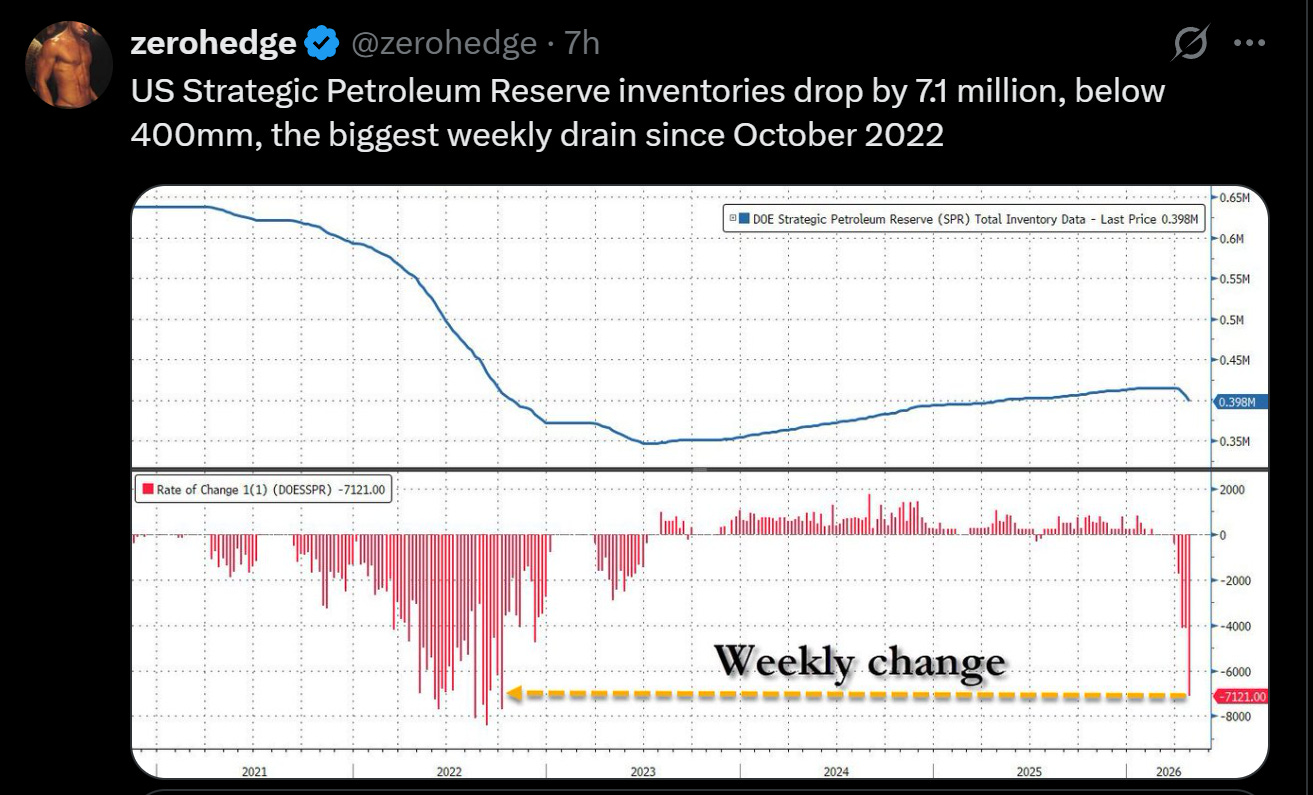
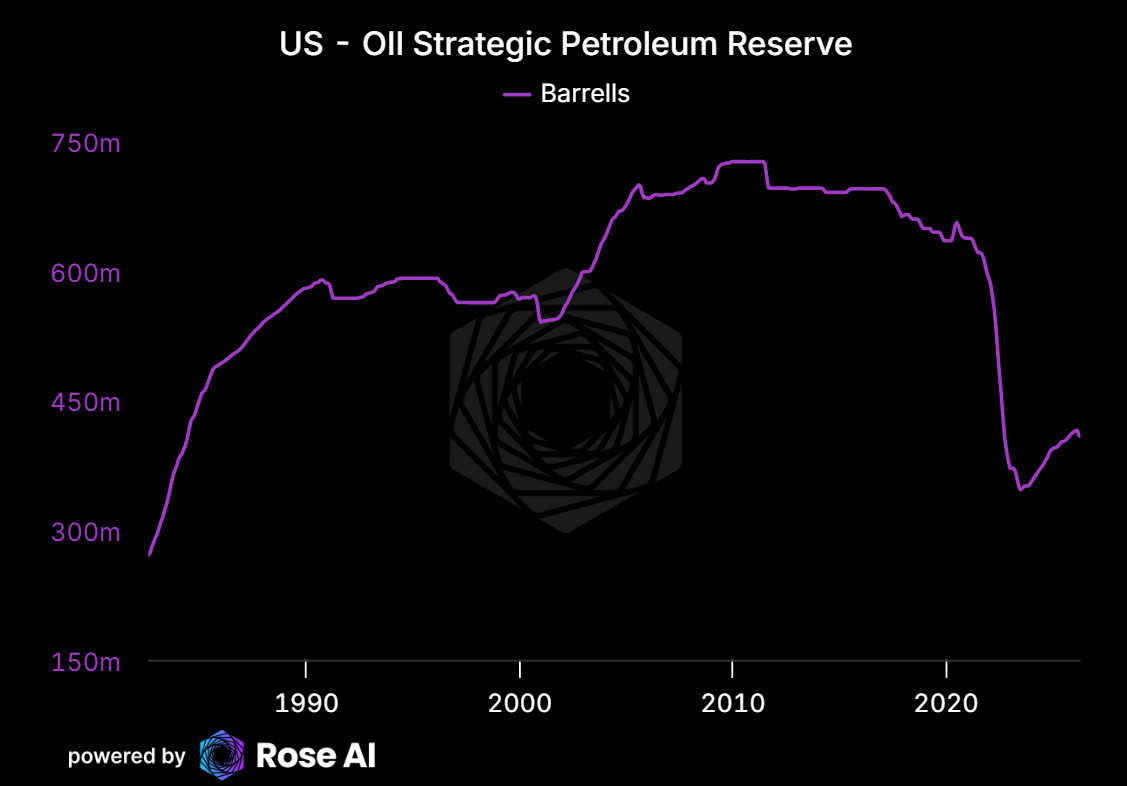
The SPR question looms. The US has been drawing down strategic reserves to keep a lid on prices. How long can that last? What’s the actual flow rate, and what happens to the market when it stops?
Not to say I told y’all so, but...
Meanwhile, commercial inventories are starting to plummet.

Not to mention global.

And this tightness is just starting to flow through to distillate production.

When Do the Inventories Run Out?
Let’s do the math.
Asia ex-China onshore stocks are at ~540 mb and drawing at roughly 20 mb/month below the seasonal norm. The 2025 seasonal low was around 590 mb in October. They’re already 50 mb below that floor and it’s only April. At this pace they hit ~480 mb by July and ~420 mb by October. That’s 170 mb below seasonal. Refineries don’t wait until the tank is empty. They start cutting runs well before that. Call it Q3 for involuntary demand rationing in Asia.
The SPR sits at 398 mb after the largest weekly draw since October 2022. You can’t drain it to zero. The cavern infrastructure has a floor around 150 mb, below which you lose both flow rate and the ability to respond to an actual emergency. So you’ve got about 248 mb of usable runway. At 7.1 mb/week, that’s 35 weeks on paper. Call it 8 months. But no administration is going to drain the strategic reserve to fumes during a shooting war. Realistically you’ve got 4-5 months of meaningful releases before they blink and let prices clear.
Goldman’s scenario analysis tells the same story from the other direction. Even their benign scenario (Gulf exports normalize by mid-June) still shows global visible inventories hitting record lows before recovering. The baseline scenario hits record lows by mid-2026 and stays there. The severely adverse scenario (normalization by end-July) pushes inventories to depths we haven’t seen in the data series.
Here’s the math: commercial inventories are heading to record lows this summer regardless of scenario. The SPR buffer buys months, not quarters. And Asia hits refinery run cuts by Q3 if the draw continues.
The curve already knows this.
The Curve
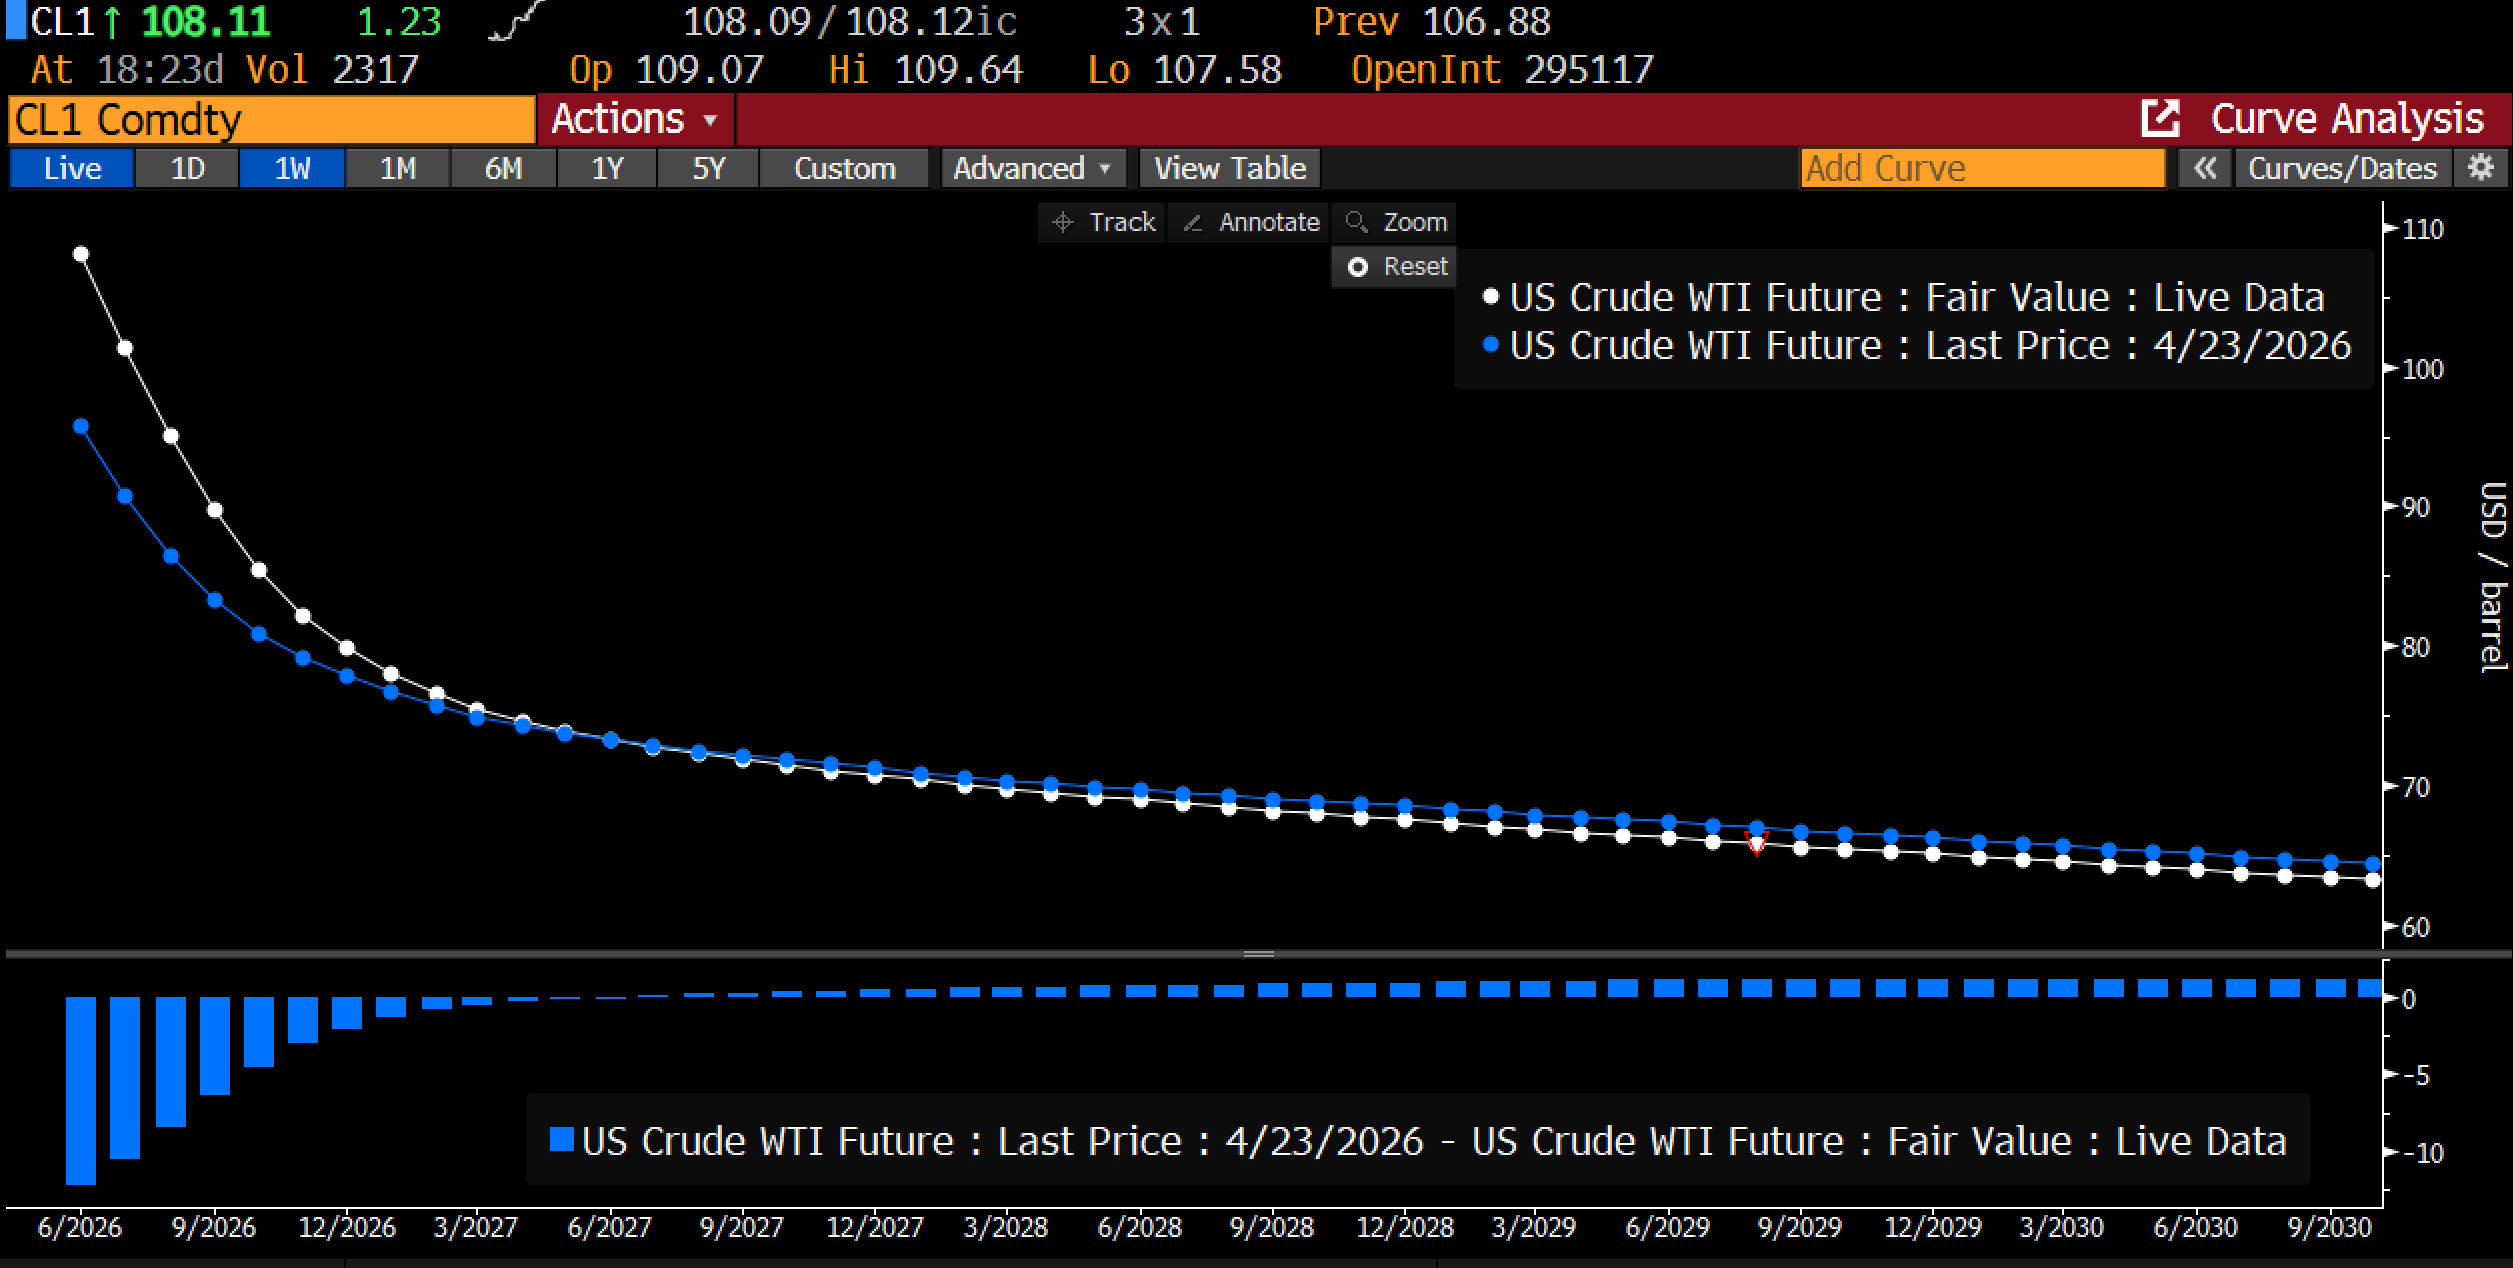
The curve tells you everything. The curve is in steep backwardation. Prompt is nearly $110, but the back of the curve (2028-2029) is still trading in the mid-$60s. The market is paying a massive premium for barrels now and assuming things normalize later. In fact, the news that the UAE left OPEC actually led longer-dated oil to sell off this week, right as near-term oil went parabolic.
These are the kind of signs you want to see if you are willing to impose short-term pain on Iran in order to extract concessions. There will be short-term inflation as a result, for sure, but the market is telling you that in spite of the escalation this week, the long-term supply-demand picture for oil just got looser.

The Brent prompt spread tells you the urgency. From sub-$1 in November 2025 to $6.52 as of April 27. That is a move that screams physical tightness. The market isn’t gently adjusting. It’s scrambling for barrels.

The 3-2-1 crack spread, which measures the margin refiners earn turning crude into gasoline and distillate, has nearly doubled from around $28 in December to $52.80. Refiners are printing money because products are even tighter than crude. You’re going to feel this at the pump. And then you’re going to feel it in the CPI print.

European jet fuel at nearly four-year highs. The product markets are confirming what the curve is screaming.
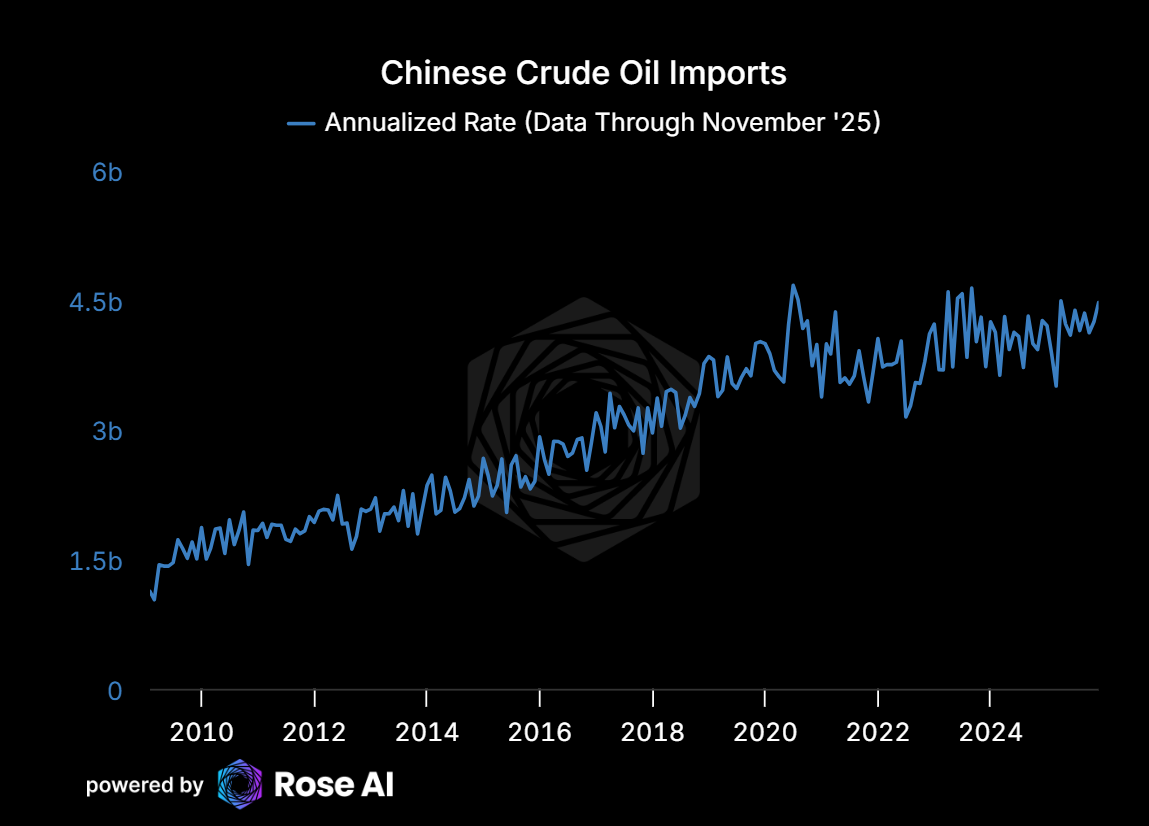
China

The great unknown. China’s crude import data has been choppy and hard to read through the noise of their own economic slowdown. But the physical data from Asian inventories suggests they’re drawing faster than imports can replenish. They are claiming that inventories are constant. Not sure if I believe this as much as I believe the youth unemployment data. More than anyone, they want to put on a brave face right now.
More on this as the data comes in.
Where Will Oil Be Tomorrow
Here’s where it gets interesting. The world is starting to price in a global energy market in deep deficit for months, not weeks.
The Cascade: Oil → Fertilizer → Ags
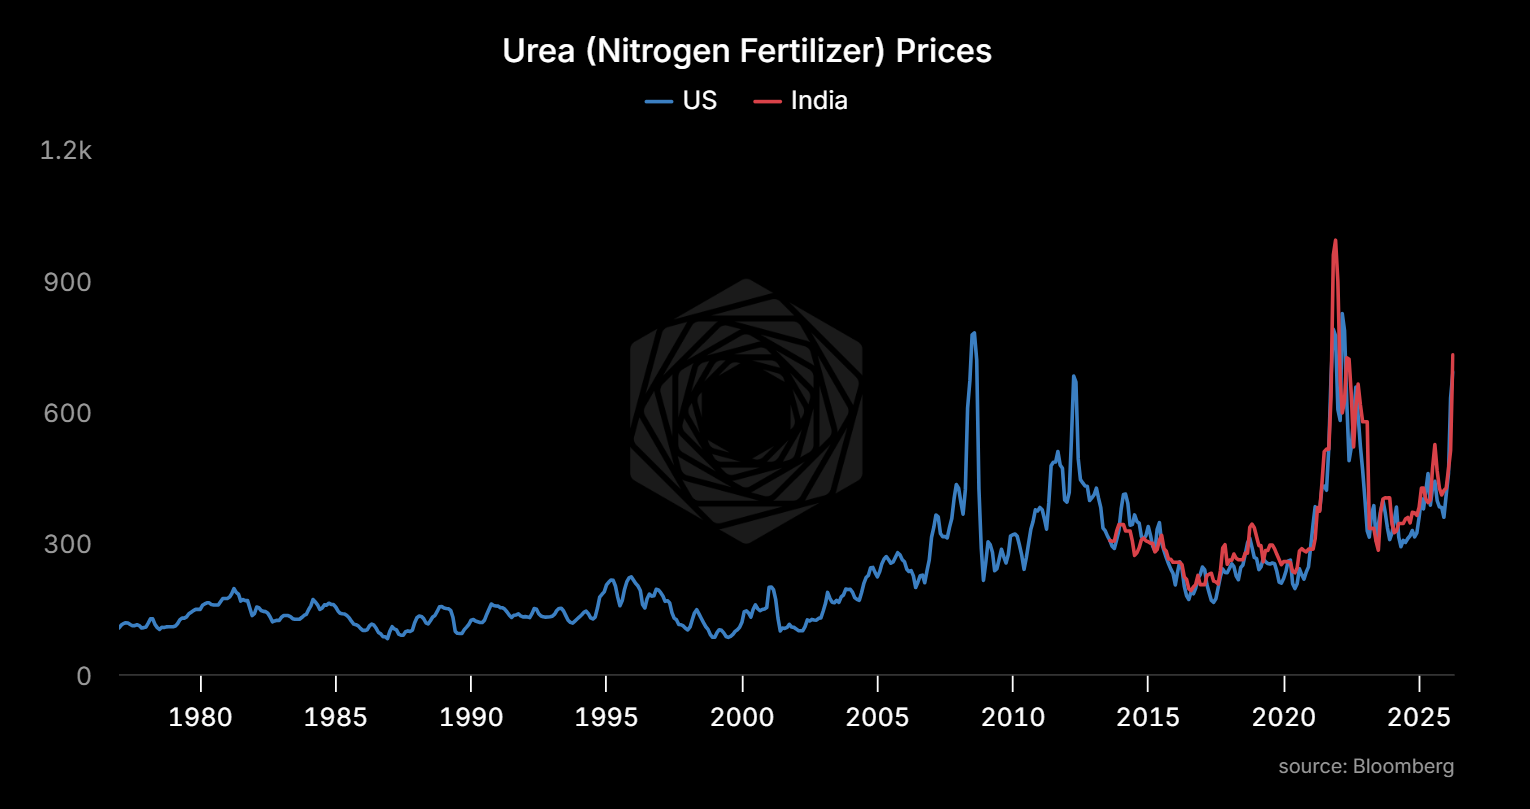
This is where the Cascade trade reconnects. Natural gas and oil are key feedstocks for fertilizer production. As energy prices rise, fertilizer costs follow. And fertilizer is the single largest variable input cost for grain production globally. Update on this soon. Wheat already moving, corn catching up, and even sugar making some interesting moves today.
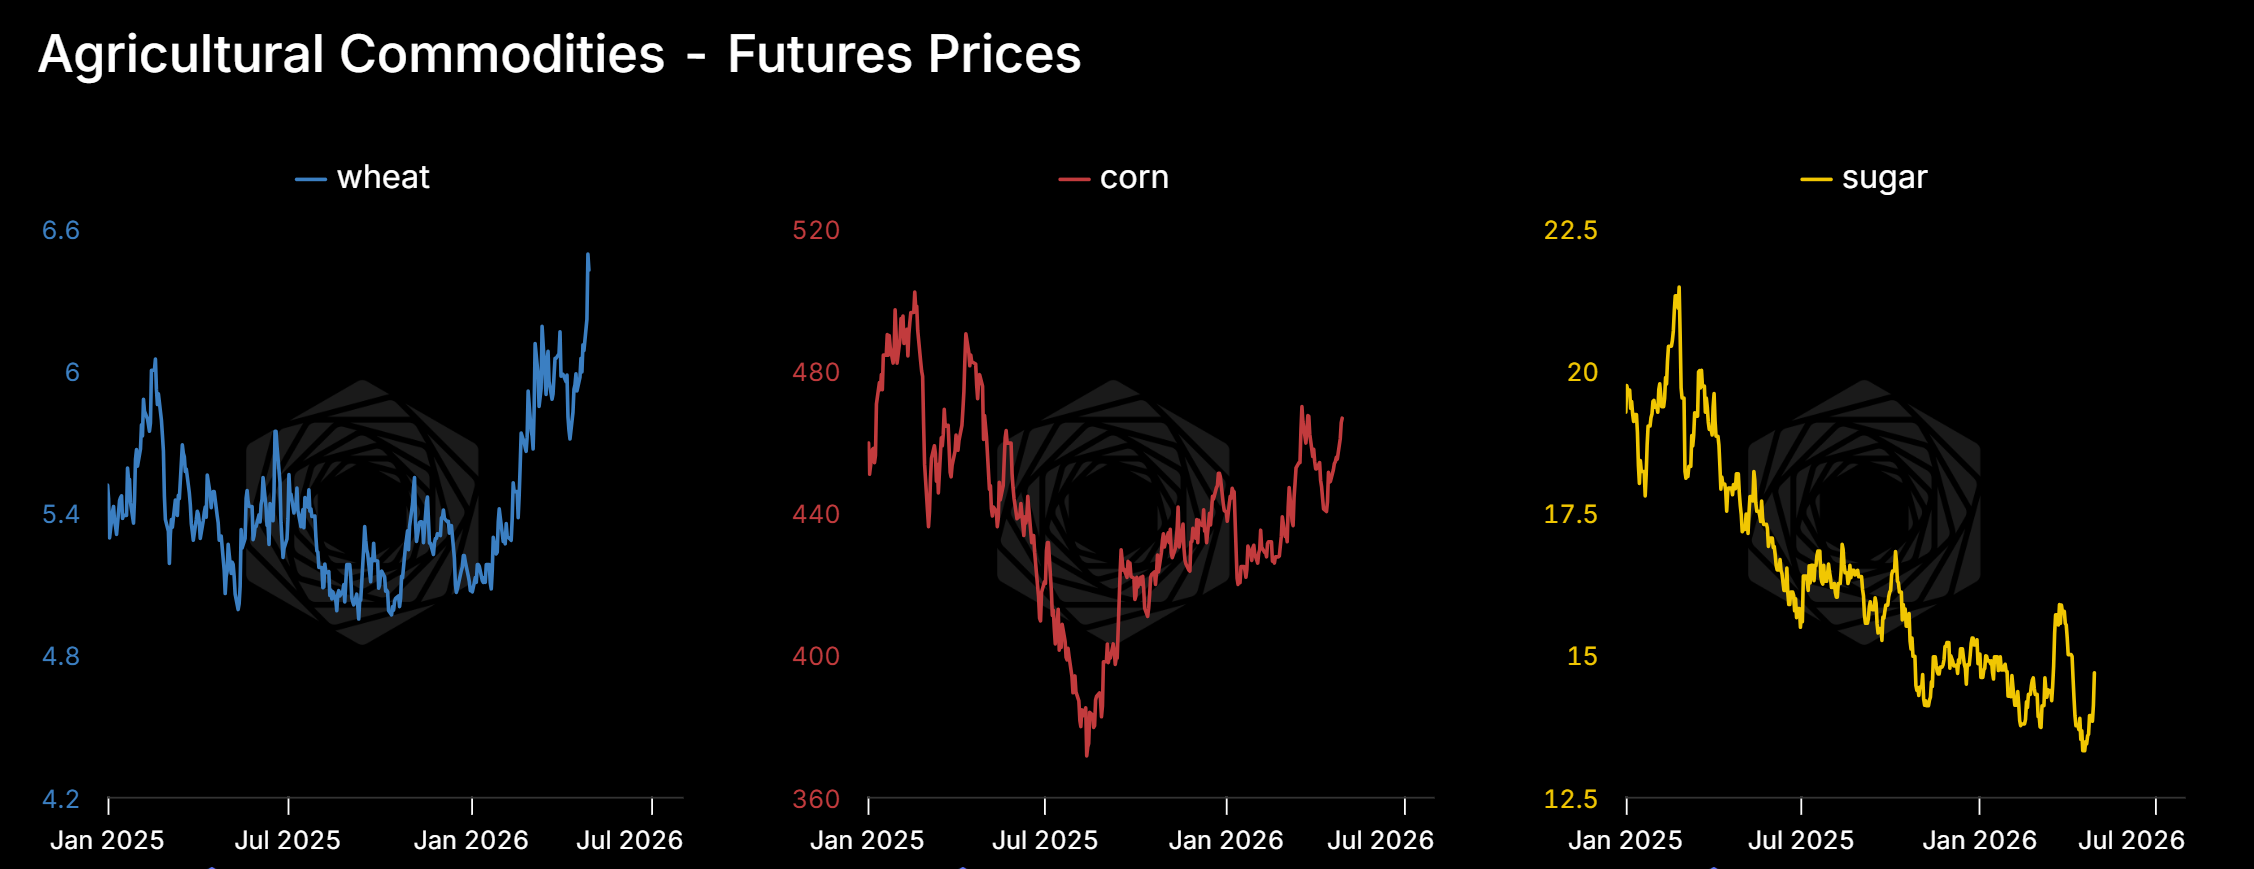
We’re seeing the early innings of what I think will be another face-ripping rally in agricultural prices. The Cascade trade (long wheat, corn, sugar, and now live cattle) is the expression of this thesis. Agricultural calendars are immutable clocks: if fertilizer is expensive during planting season, yields decline. That doesn’t show up in prices immediately. It shows up at harvest. The market hasn’t connected these yet.
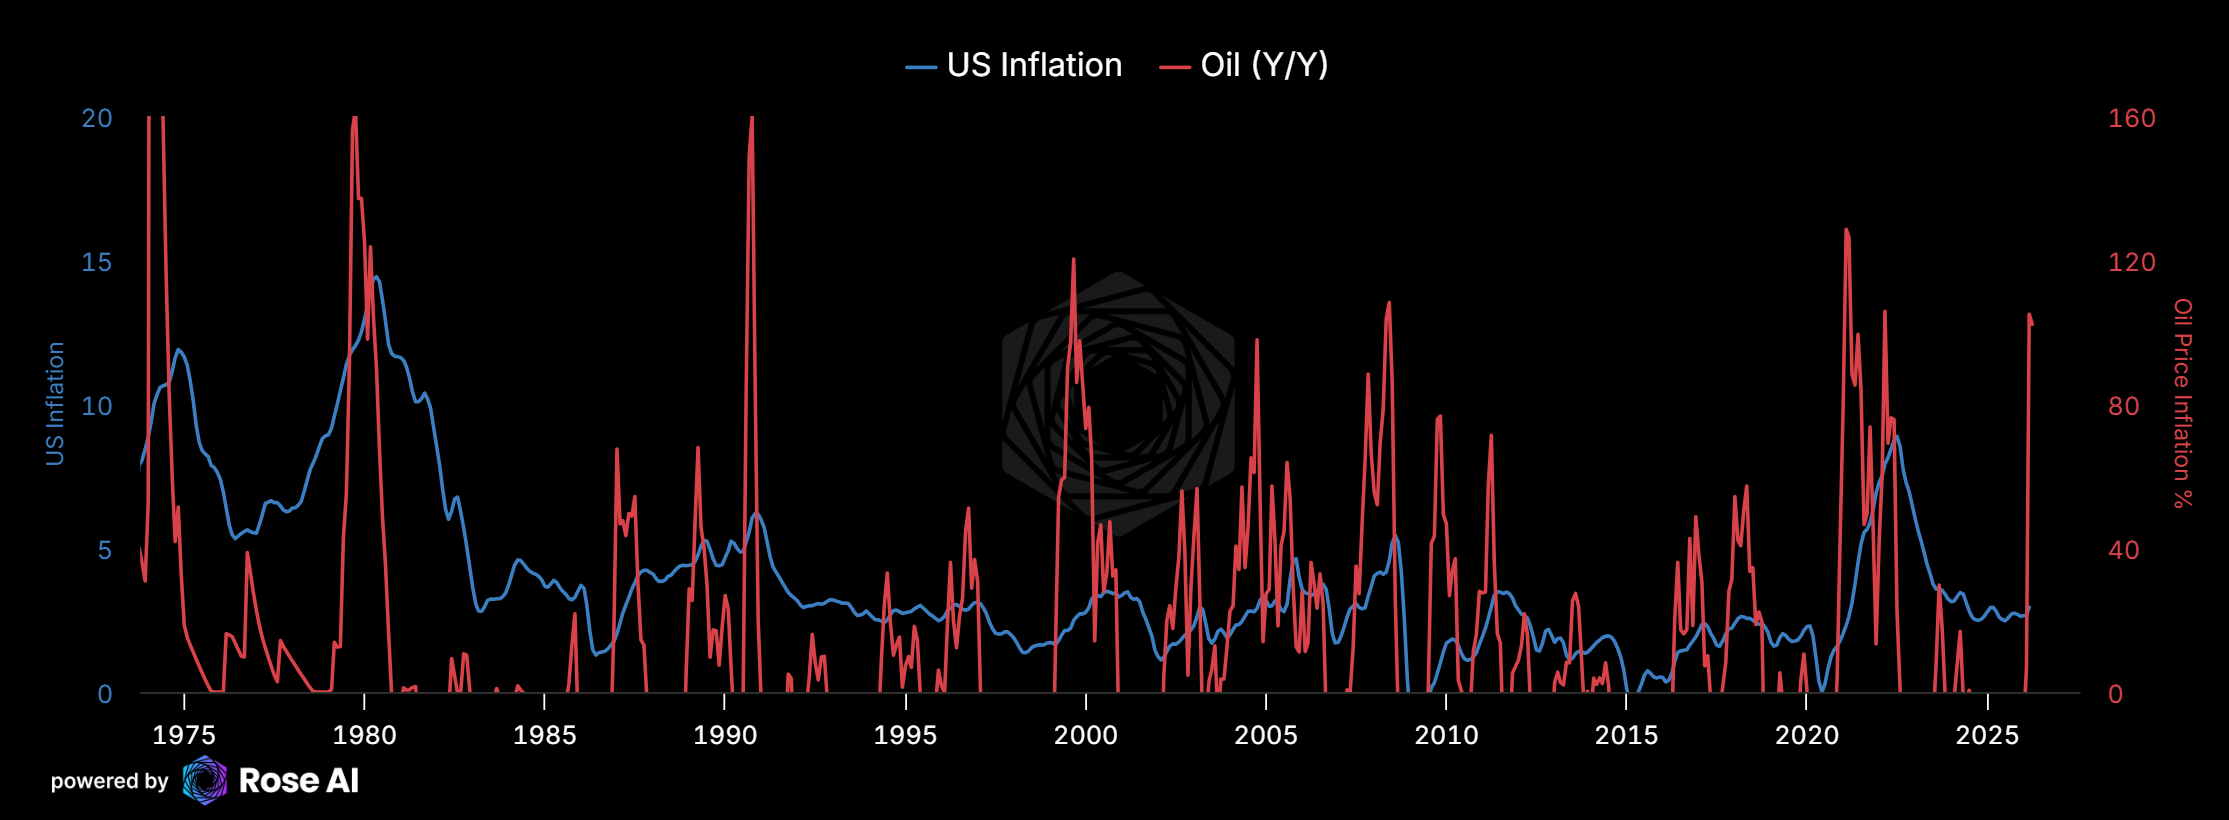
The Inflation Question
Now let’s talk about what all of this means for inflation.
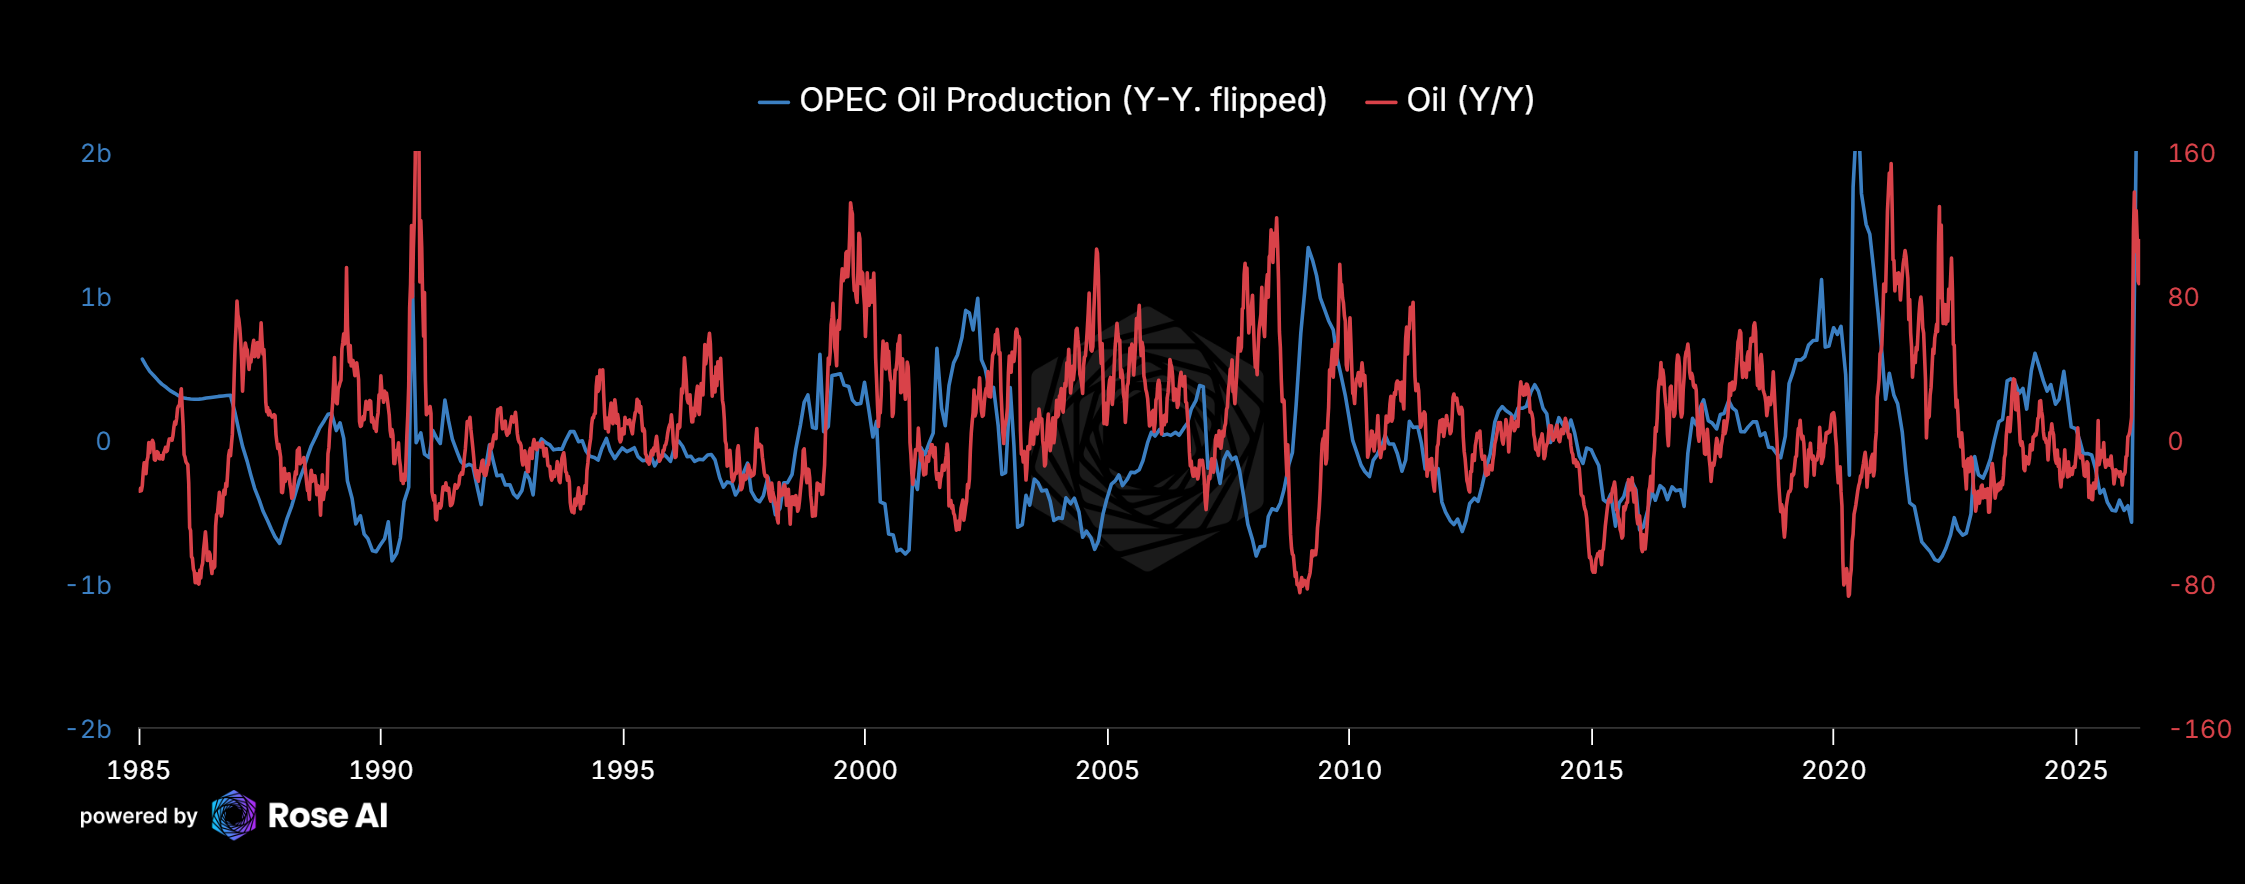
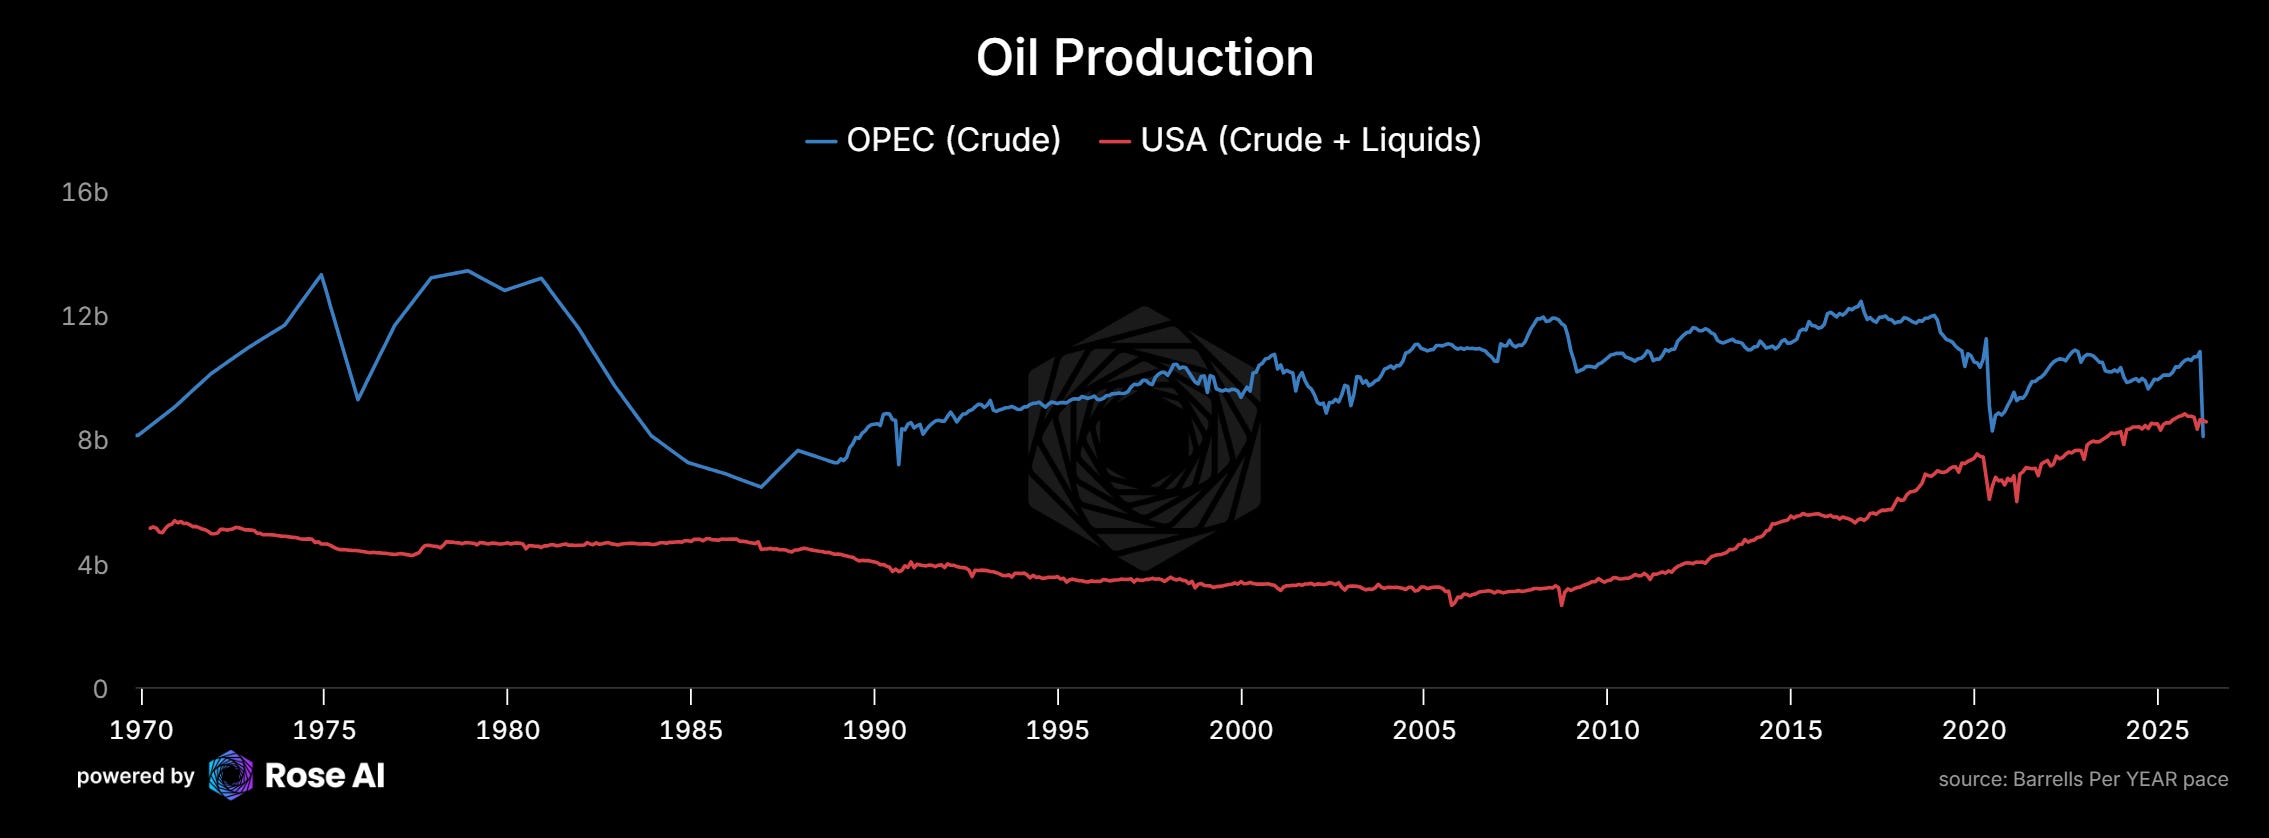
Pretty much since the early 2000s, OPEC played a role stabilizing the oil market, expanding production when the market was tight and taking oil offline when things got too loose. You can see in the chart how tightly oil prices track OPEC production changes. This time is no different in mechanics, just in magnitude. OPEC production isn’t declining because of voluntary cuts to manage price. It’s declining because the cartel is fracturing and its members are at war.
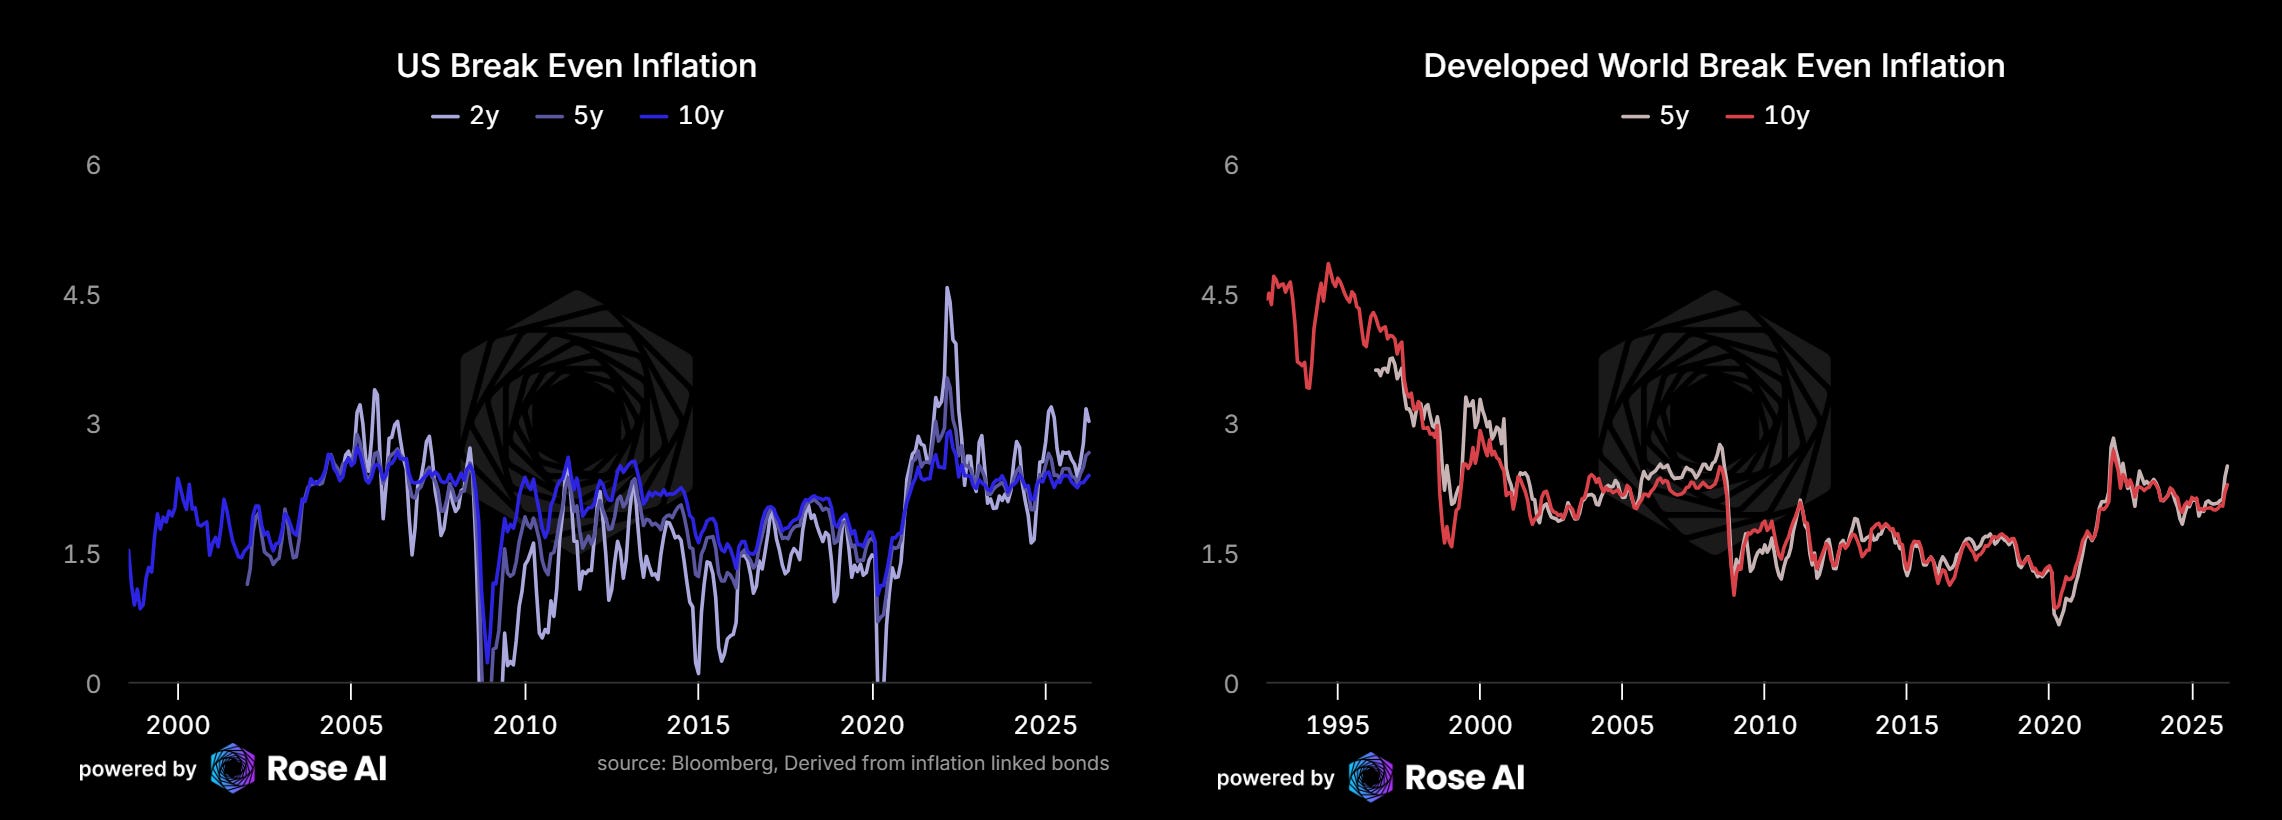
We sold some nominal bonds yesterday, and need to look at breakeven inflation. Not sure it’s pricing in enough.
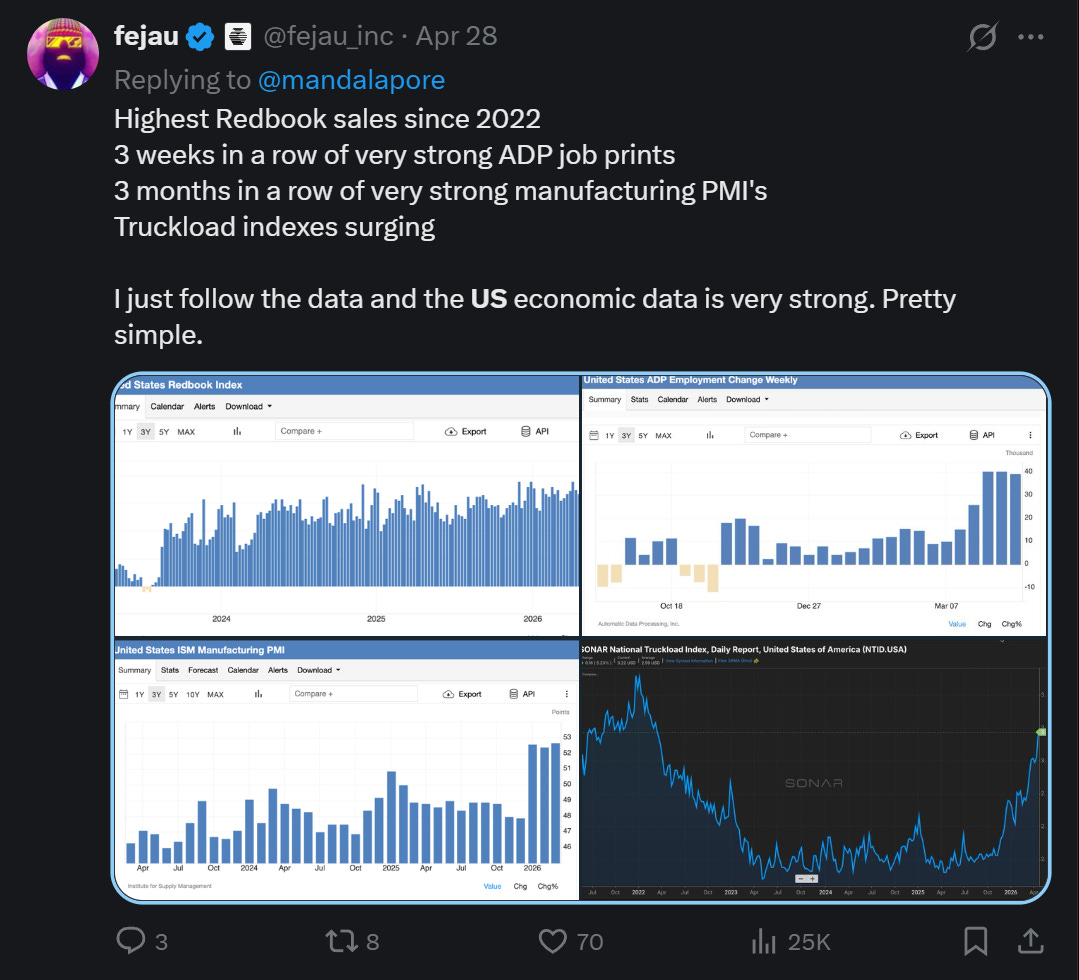
Warsh is coming in at a very difficult time, and even ex-oil, the economy looks to be heating up.
Who Benefits
So who benefits from all of this? Look at the table.
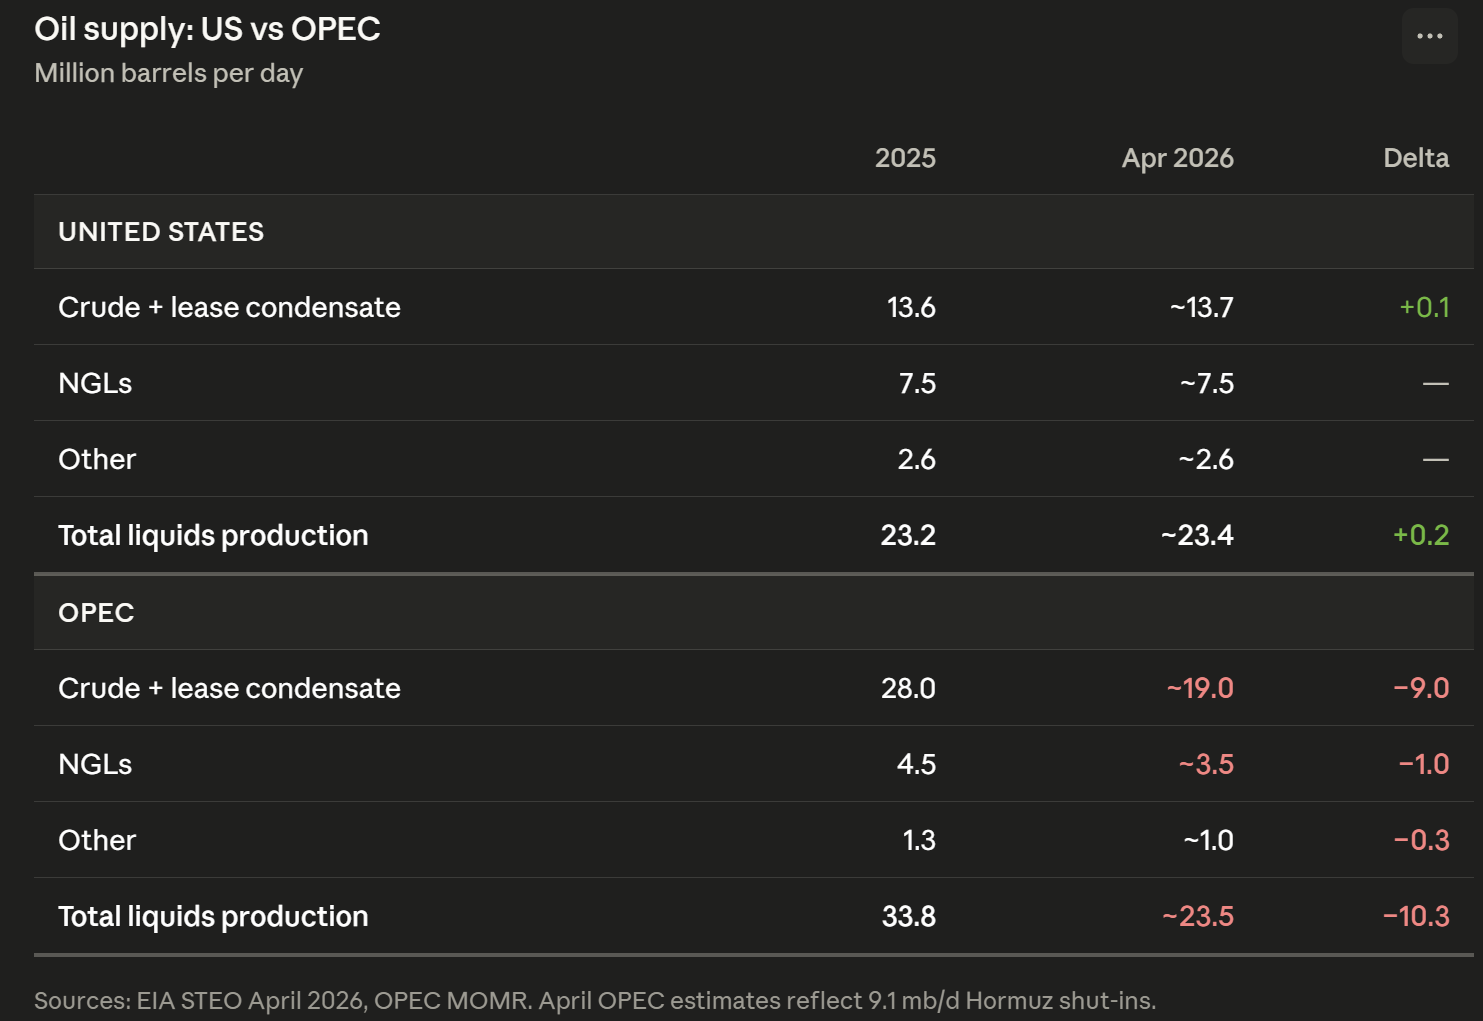
The US is now producing more total liquids than OPEC crude output. That’s not a typo. US total liquids production sits at ~23.4 mb/d, essentially flat year-over-year. OPEC total liquids production has fallen to ~23.5 mb/d, down 10.3 mb/d from 2025. American energy dominance used to be a slogan. Now it’s in the data.
Needless to say, you want to be long folks that are levered to the gap between European/Japanese and American gas prices, at decent valuations, with a lot of upside. For paid subs, we’ll put the individual names we think are the best bets in the Appendix below, along with a link to a dashboard which provides more depth.
And here’s the longer-term structural point. The UAE has massive spare capacity that they are going to bring online. As soon as they can export more, they will. And they’re going to work to bypass the Strait doing it. That’s bearish for OPEC discipline and bearish for the narrative that supply cuts are sustainable. But it’s bullish for total global supply eventually, and it reshapes who the winners and losers are in the energy complex.

The world keeps trying to price this conflict like it’s a two-week event. The production data says otherwise. The inventory data says otherwise. The curve says otherwise. And now OPEC itself is fracturing.
I’ve avoided trading oil for the last couple of years for reasons I won’t get into here. But as the Dread Pirate Roberts once said:

I am not left-handed either.
It’s time to put the sword back in my fighting hand.
Disclaimers
This analysis was built over several days of active markets. Prices, curves, vol surfaces, and positioning data reflect the time they were pulled, not the time you’re reading this. Some of these levels will have moved by the time you see them. Do your own work. Check the chain before you trade. The price on your screen when you lift the offer may look nothing like the price on mine when I wrote this up.
Charts and graphs included in these materials are intended for educational purposes only and should not function as the sole basis for any investment decision.
These opinions are mine and mine alone and do not represent the views of any of Rose’s clients or counterparties.
The Ramble does take positions in various assets we write about, and views are subject to change without notice.
This letter does not constitute an offer to sell, a solicitation of an offer to buy, or a recommendation of any security or any other product or service by Rose, Campbell or any other third party regardless of whether such security, product or service is referenced in this brochure. Furthermore, nothing in this website is intended to provide tax, legal, or investment advice and nothing in this website should be construed as a recommendation to buy, sell, or hold any investment or security or to engage in any investment strategy or transaction. You are solely responsible for determining whether any investment, investment strategy, security or related transaction is appropriate for you based on your personal investment objectives, financial circumstances and risk tolerance. You should consult your business advisor, attorney, or tax and accounting advisor regarding your specific business, legal or tax situation.
THERE CAN BE NO ASSURANCE THAT ROSE TECHNOLOGY INVESTMENT OBJECTIVES WILL BE ACHIEVED OR THE INVESTMENT STRATEGIES WILL BE SUCCESSFUL. PAST RESULTS ARE NOT NECESSARILY INDICATIVE OF FUTURE RESULTS. AN INVESTMENT IN A FUND MANAGED BY ROSE INVOLVES A HIGH DEGREE OF RISK, INCLUDING THE RISK THAT THE ENTIRE AMOUNT INVESTED IS LOST. INTERESTED PROSPECTS MUST REFER TO A FUND’S CONFIDENTIAL OFFERING MEMORANDUM FOR A DISCUSSION OF ‘CERTAIN RISK FACTORS’ AND OTHER IMPORTANT INFORMATION.
Appendix: US Energy Dominance (Paid Subscribers)
We built this dashboard to screen the US gas and LNG equity universe across value, growth, spread beta, quality, and what we call “setup” (how much of the move is already priced in). A few names jump out.
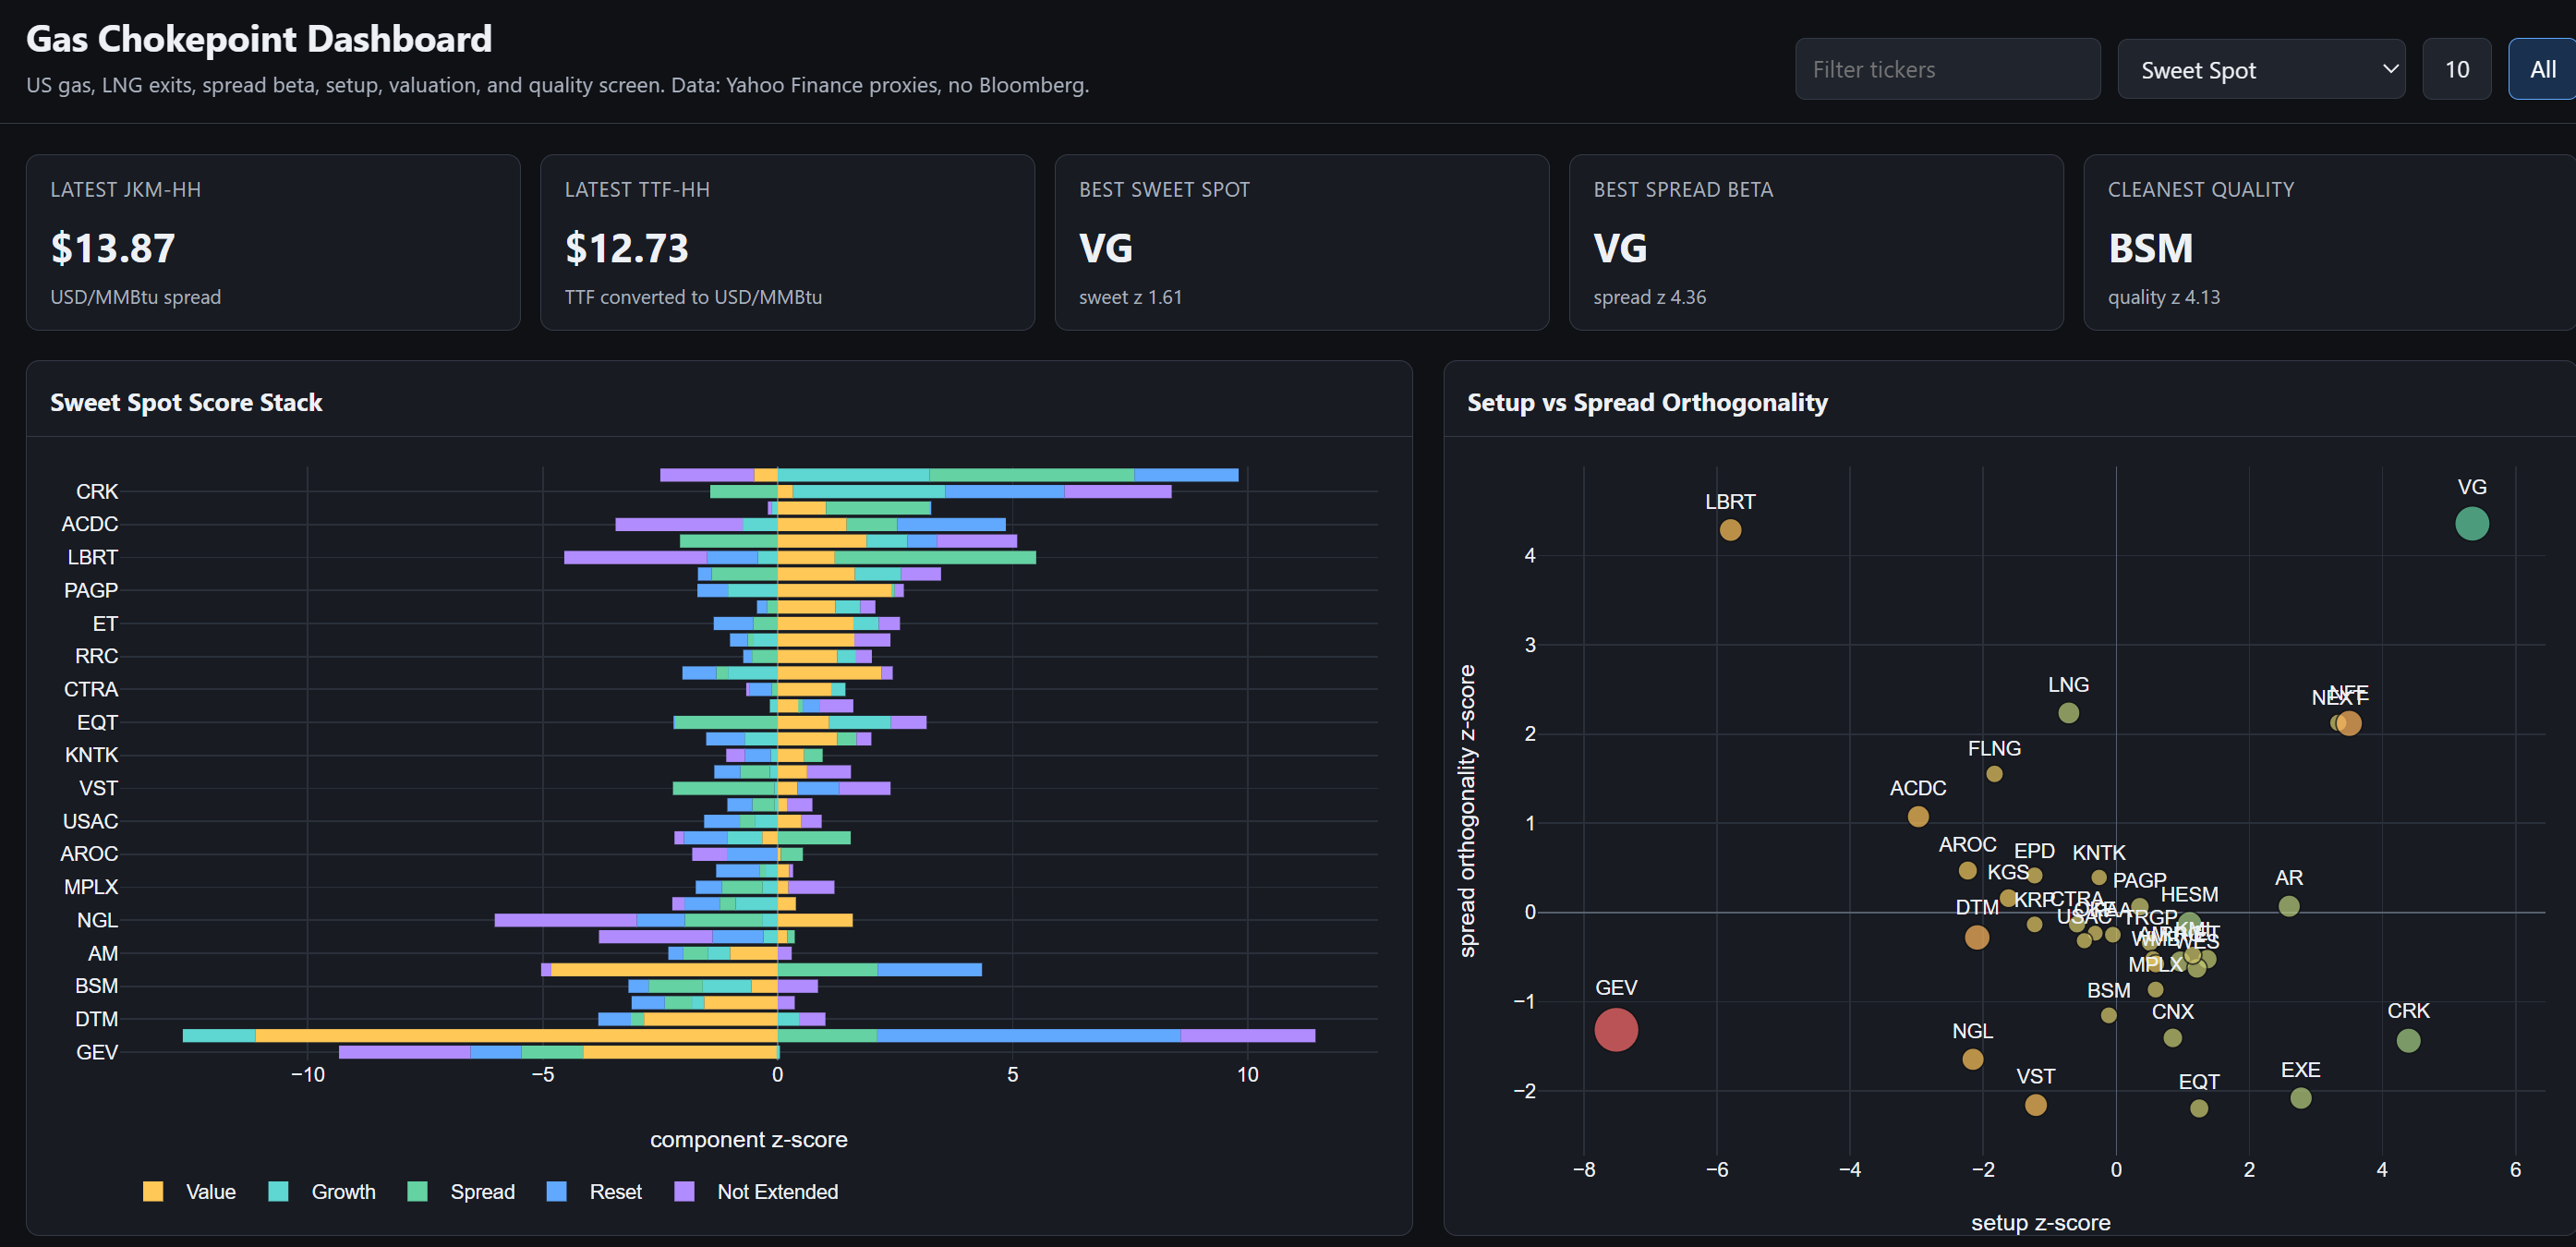
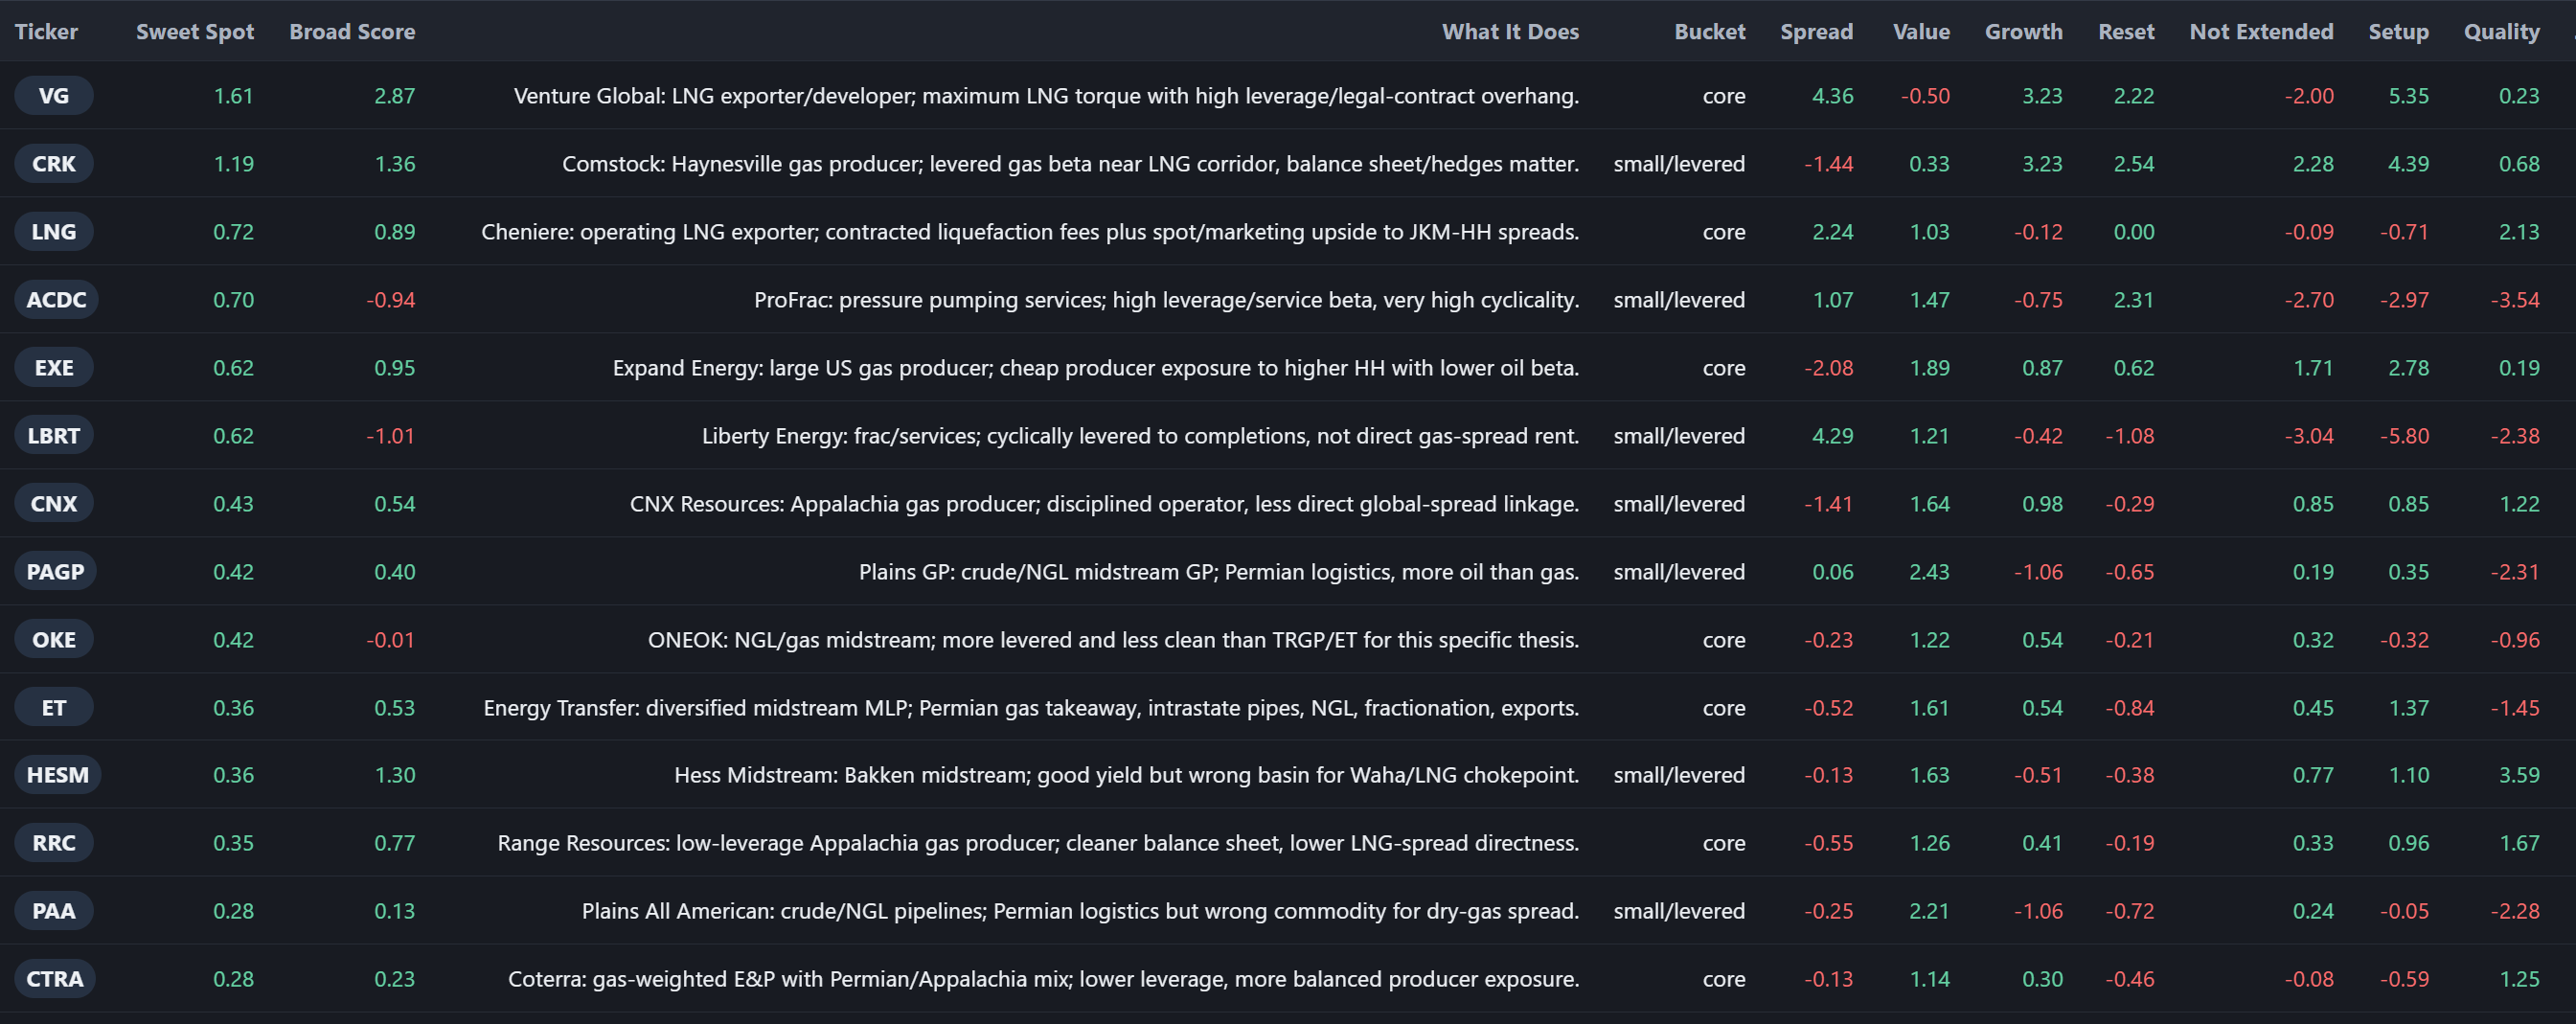
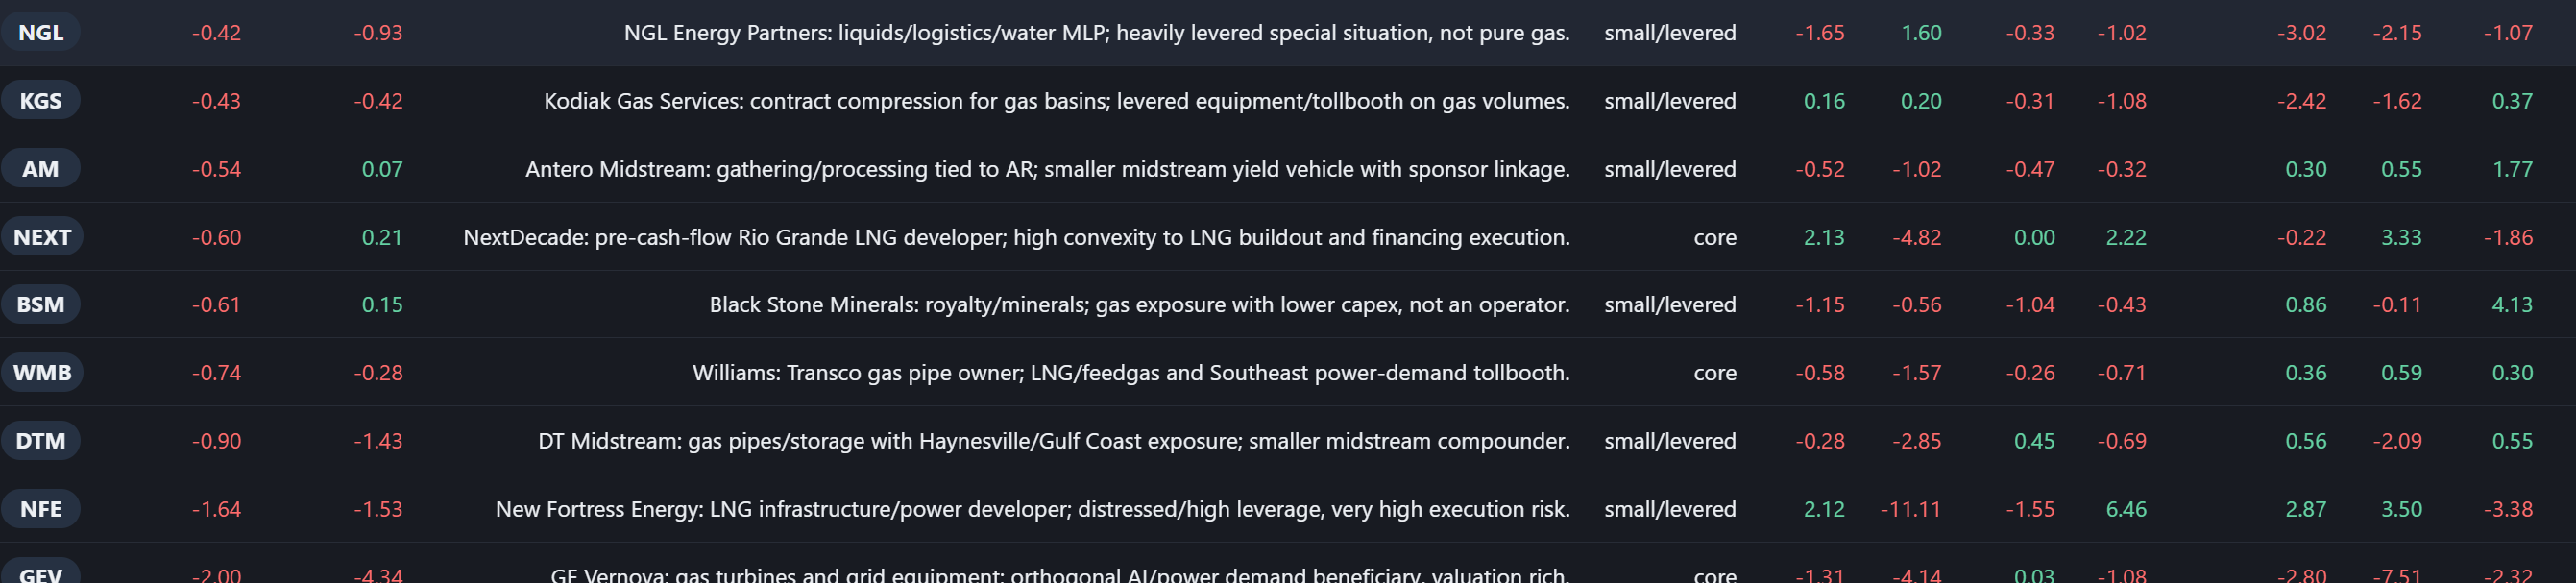
The “Sweet Spot” ranking surfaces names with the best combination of LNG torque, reasonable valuation, and balance sheet quality. VG (Venture Global) sits at the top of the core bucket: maximum LNG torque with high leverage to the legal/contract overhang resolution. CRK (Comstock) leads the small/levered bucket: Haynesville gas producer near the LNG corridor with a clean balance sheet and solid hedge matters.
(work in progress, data may be lagged since we pulled this together over the weekend)
Alex, great piece. When you have some time (😁) I’d like to hear your perspective on the “inflation” implications of rising crude prices. Friedman, is famous for pointing out that inflation is “always and everywhere a monetary phenomenon”, ie, inflation comes from “money printing”, not commodity price shocks . If what we are seeing right now is an oil price shock, which will no doubt create a price shock wave in other downstream commodities, how do you think the longer end of the credit markets will respond? And is a Warsh fed really going to set policy off of an oil influenced CPI? Thx, Liam
Does inflation go high enough to push the yields on the long end high enough to break the housing market?