

10 Silver Days of Christmas
This is where it’s fun. This is where it’s scary.

It’s been 10 days since our last missive on silver.
10 days was 25% ago.
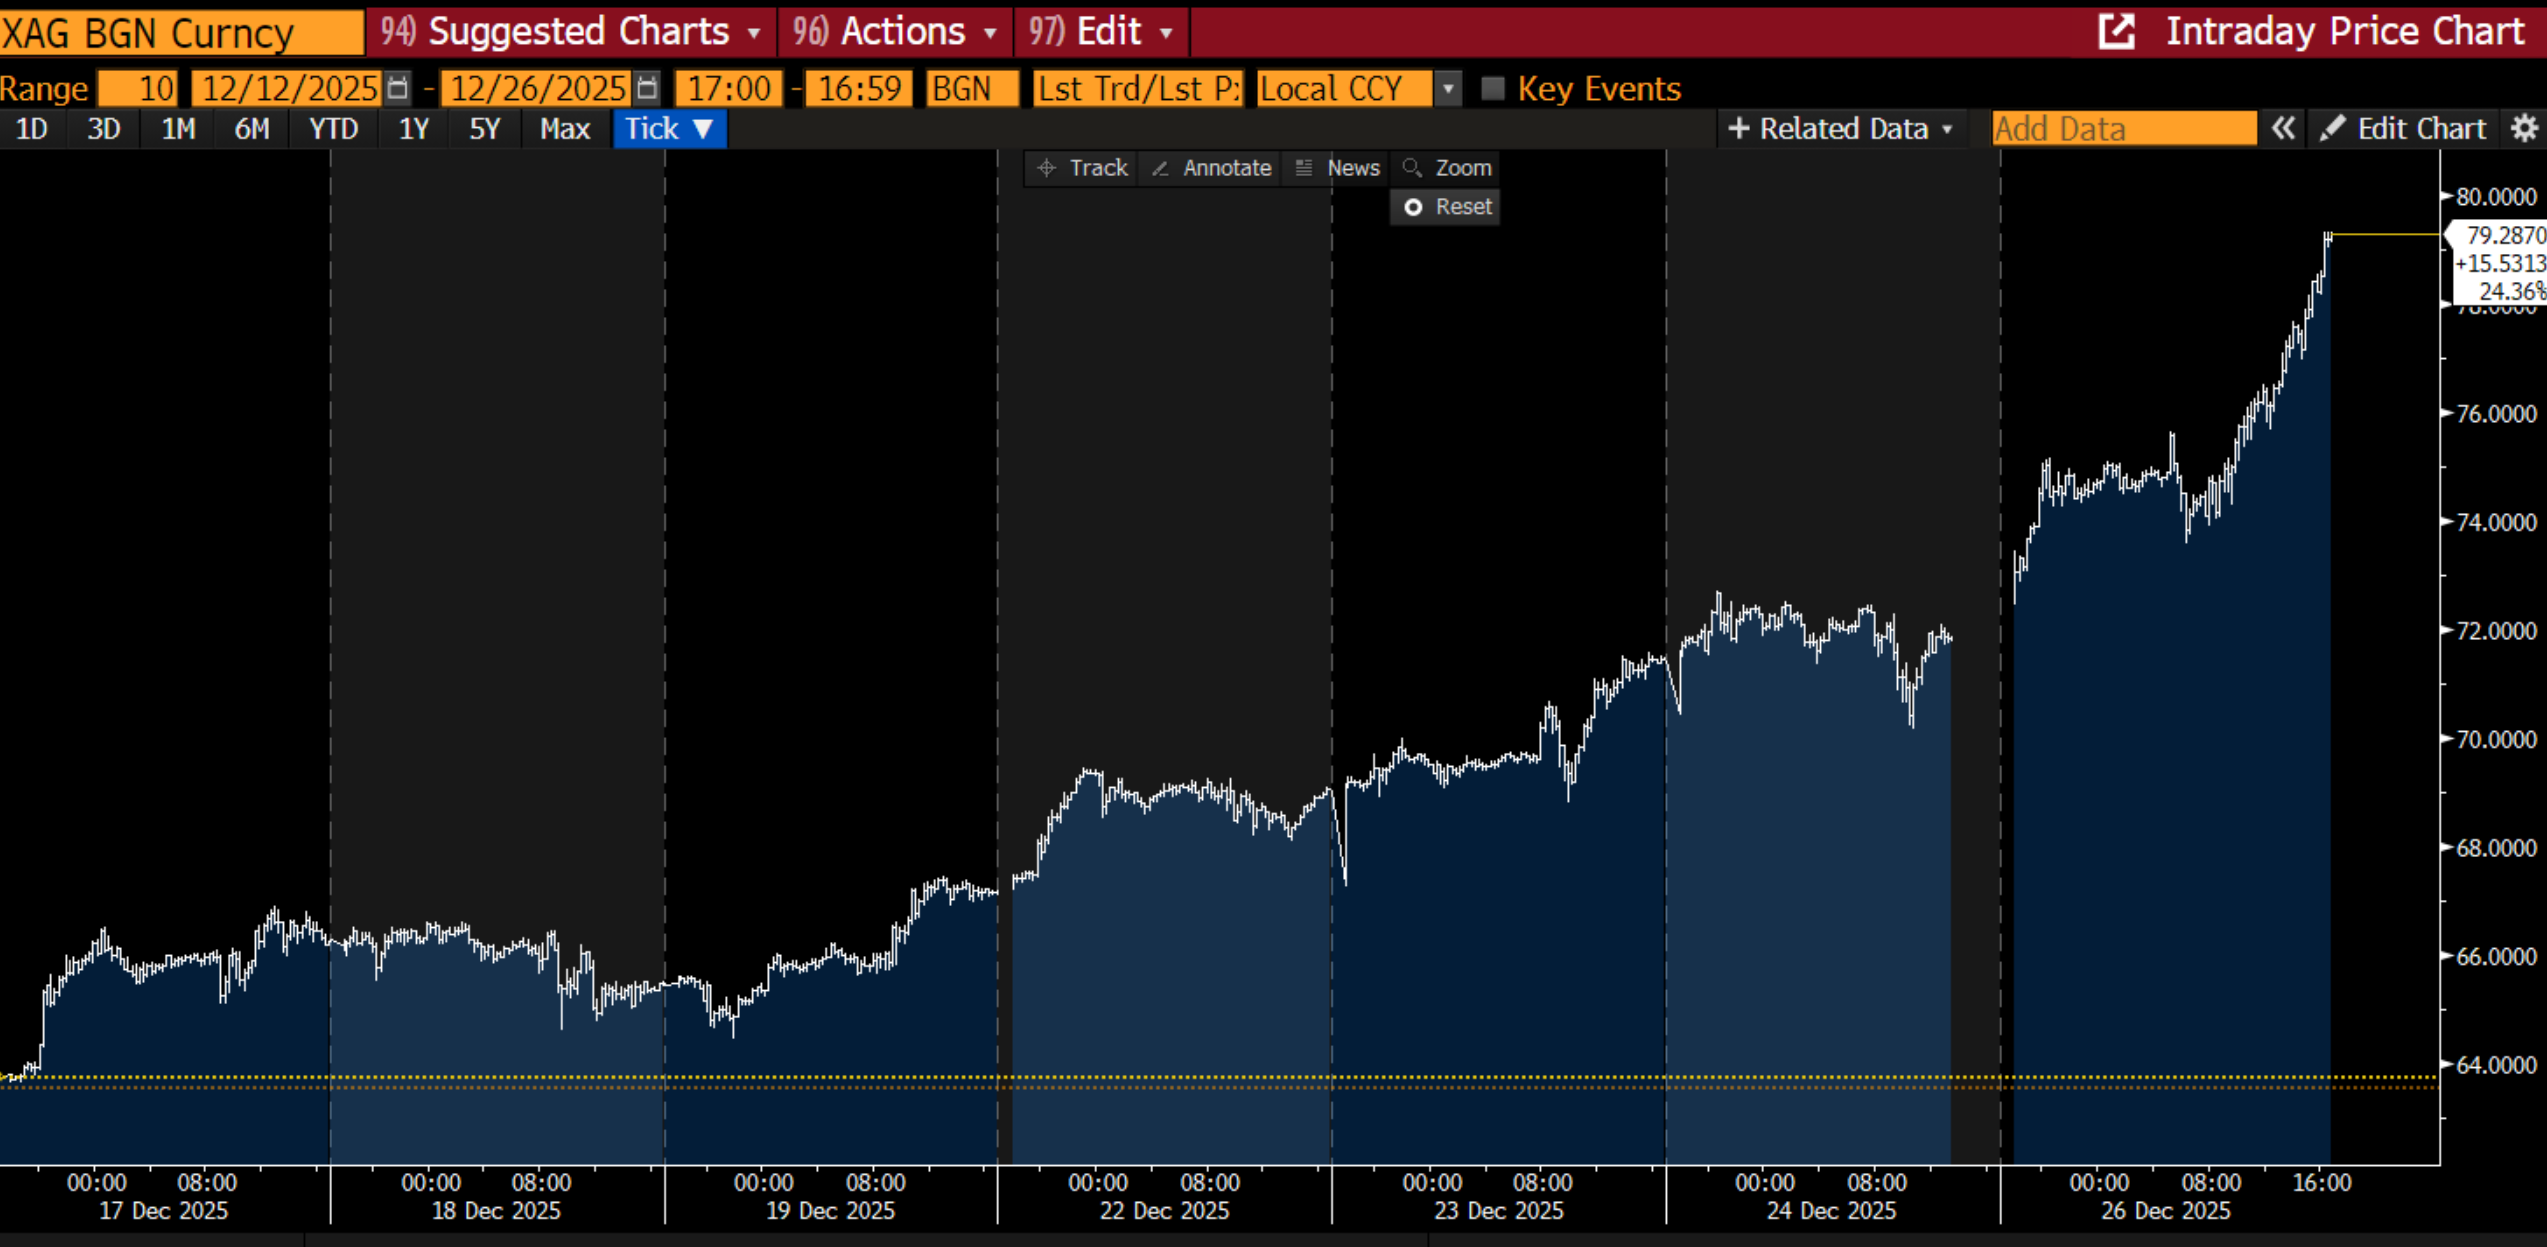
In that time: China announced export licensing on silver starting January 1st. Shanghai physical hit $91 while COMEX closed at $77. The London forward curve remains in deep backwardation—not as extreme as October, but still inverted. CME hiked margins. And I’ve spent the afternoon after a well-deserved digital detox staring at Bloomberg and Rose to see what’s changed and whether it changes our view.
Short answer: I wouldn’t buy fresh here. I’d look to accumulate in the coming drawdown, and stay nimble if you’re playing via options.
This is the part they don’t tell you about in the trading books. The part where your thesis is working—maybe working too well—and now you have to manage your emotional drawdown capacity as much as your checkbook. The part where the math you penciled out on a napkin becomes not just a probability distribution but a call option now in the money.
Scary because now you have more homework to do. To check the math. To price the contra narratives that will be used against you.
So that’s what this is.
The Bear Case (Or: Things That Could Kill You)
In the next two weeks there are legitimate short term bearish narratives/pressures which silver bulls will have to navigate.
Don’t be surprised by a red candle. It’s coming. The question is whether you buy it. We already took a little bit of ‘delta’ (aka exposure to the price) and stashed it in gold, cycling back into the original trade and making us long 15% gold and long silver 30-40% vs a ratio of closer to 10:1 earlier.
We also bought some upside butterflies and bought a lot of dollar calls. Which will become more clear later.
Anyway, the bearish pressures being…
1. Tax Selling
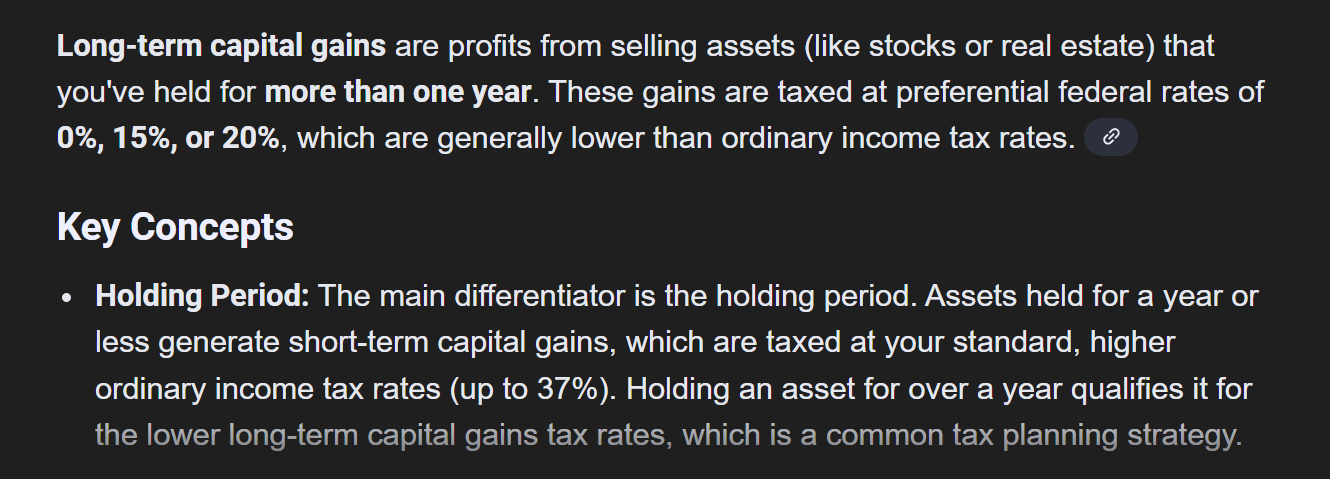
You’re in a trade that’s up a LOT. Like, uncomfortable-conversation-with-your-accountant a lot. For anyone holding shares bought to exercise long call positions that went in the money, there’s serious reluctance to sell before December 31st.
Especially if they are less than a year out and looking not only at the cap gains hit but the diff between short term and long term
That creates bullish pressure NOW.
Which means bearish pressure January 2nd.
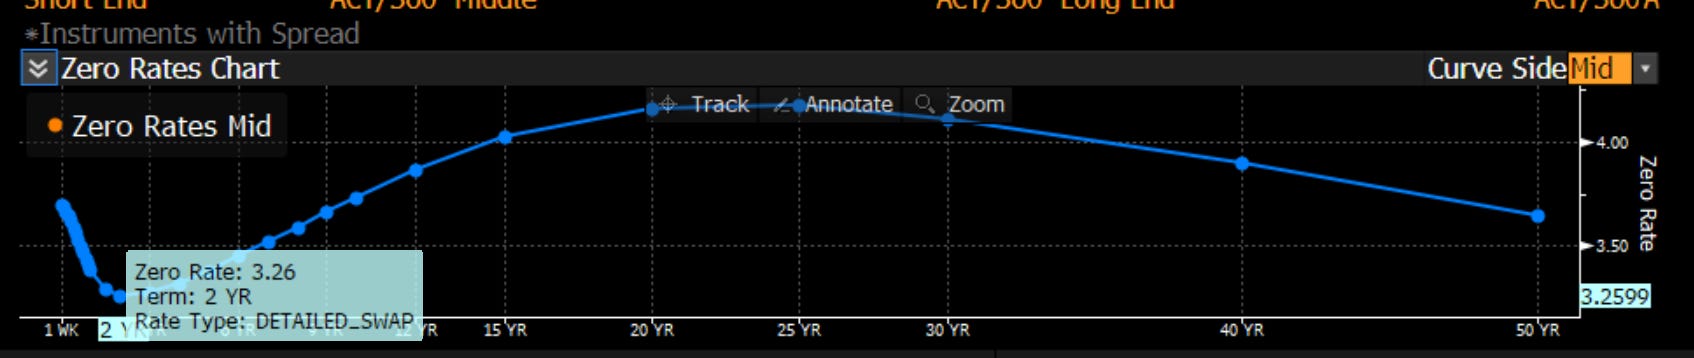
2. The Dollar / Rates Thing
Latest GDP print came in hot. There's a lot of 2yr easing that could come out of the curve, forcing policymakers to choose between a stronger dollar or higher short rates. Neither is great for shiny rocks denominated in dollars in the short term.
3. Margin Hikes
CME raised margins on precious metals effective December 29th.
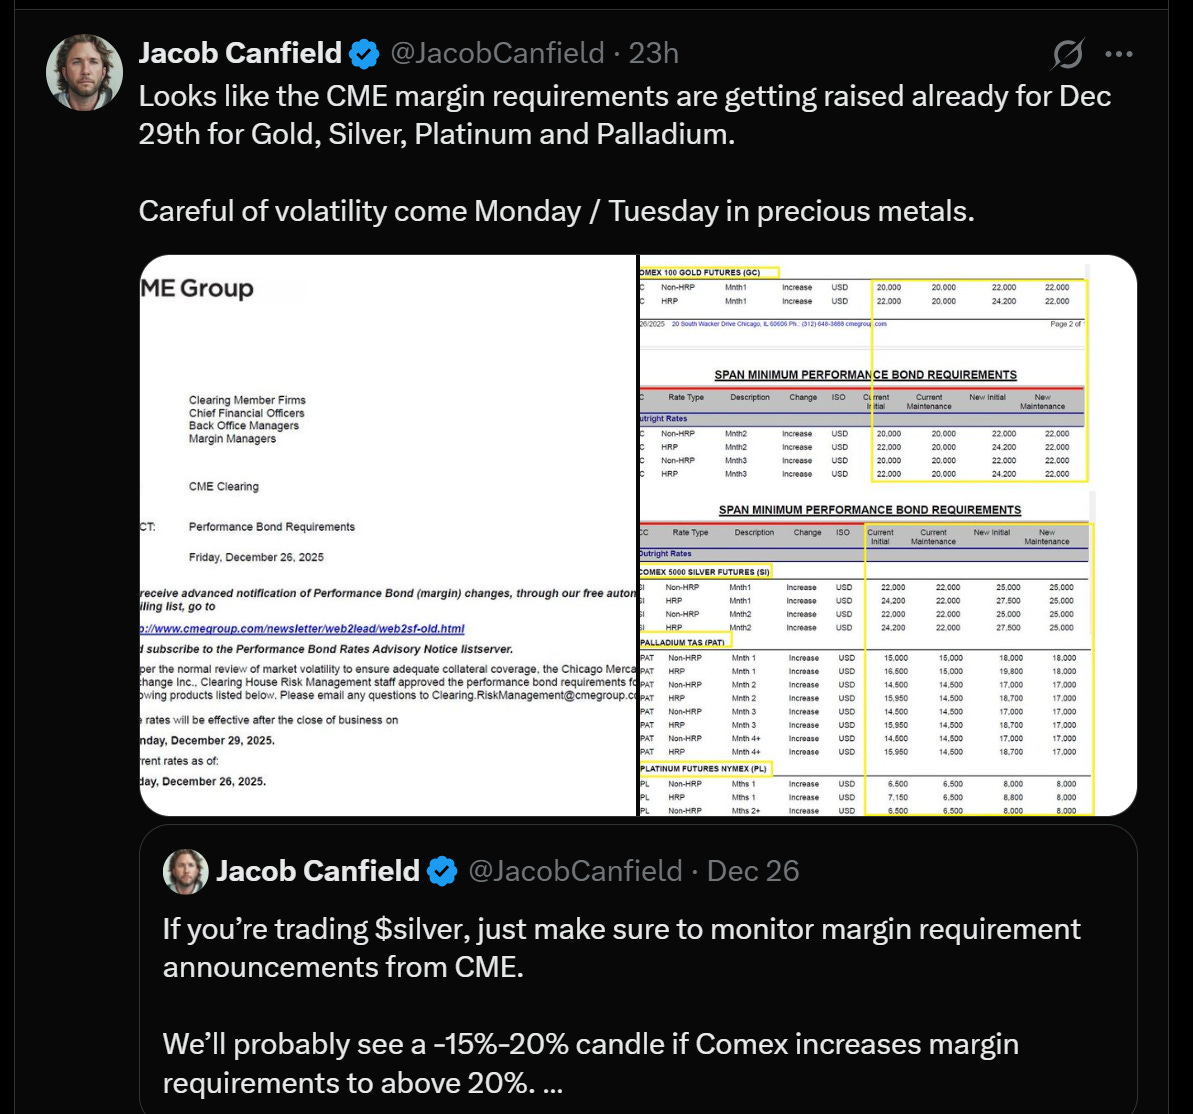
If you’re levered in futures, this matters. Higher margins = higher capital requirements = forced liquidation for the undercapitalized. This is the playbook that killed silver in 2011—CME hiked margins five times in eight days, leverage collapsed, rally died.
So should you be scared? Well, thing is to a large extent the margin on silver was already way up past that part and so the recent increases have an impact but much less proportionately. Plus most of the demand is, as we shall see, physical.
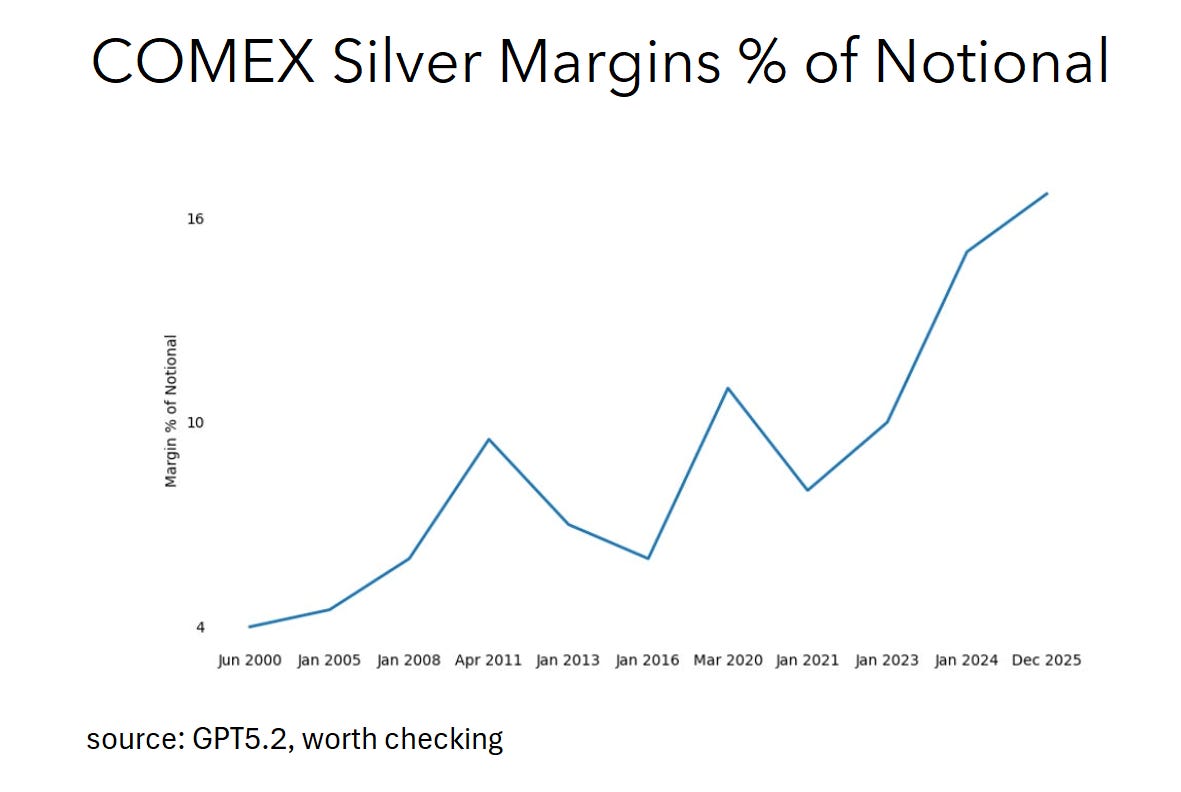
In 2011, margins started at ~4% of notional—meaning you could control $100 of silver with $4 of capital. That’s 25x leverage. Degenerate stuff. CME ratcheted margins to ~10% over a few weeks, leverage collapsed from 25x to 10x, and the forced liquidation cascade murdered the rally.
Today? We’re already at ~17% of notional. Six times leverage. That’s tighter than the WORST point of 2011.
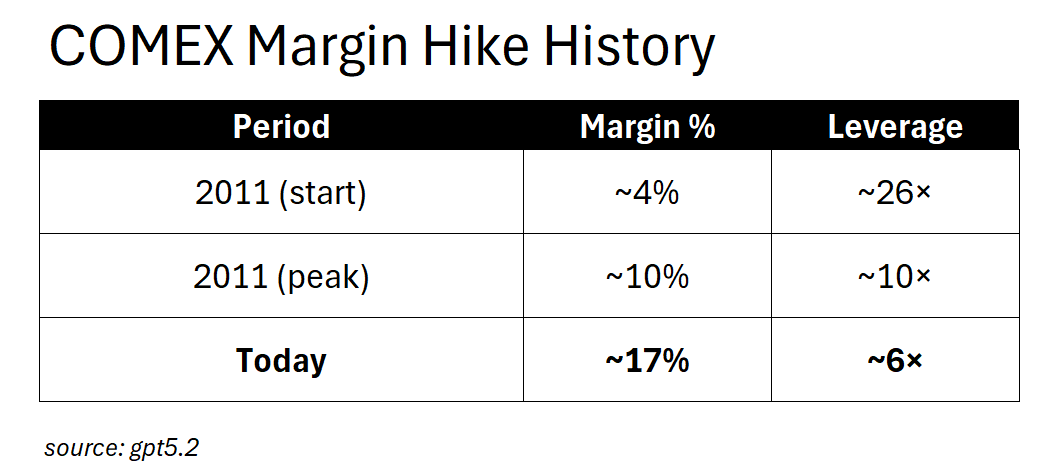
The margin kill switch has already been pulled. We’re living in post-squeeze margin territory.
What does another hike do from here? It doesn’t flush specs—there’s not much speculative leverage left to flush. It hits hedgers. Producers trying to lock in prices. Refiners managing inventory risk. The commercial players who actually need the futures market to function.
Push margins to 20%? You don’t get a 2011-style liquidation cascade. You get reduced liquidity, wider spreads, and commercials migrating to OTC. The mechanics have flipped.
The people warning about margin hikes are fighting the last war (if that chart above is right). Though good for contra narrative building in the short term .
4. “Overbought”
When some combination of the above starts hitting the tape, you’ll hear “overbought” from every chart-painting astrologer on fintwit. Technical selling begets more technical selling.
But like... overbought relative to what?
Again, the case for silver is that the economics of solar panels (inelastic demand as the silver is/was ~10% of the price of the panel) meets inelastic supply (remember 75% of production comes as a by product to other metals), not staring at tea leaves or lines on a chart. These are the kind of things that drive short term price movements.
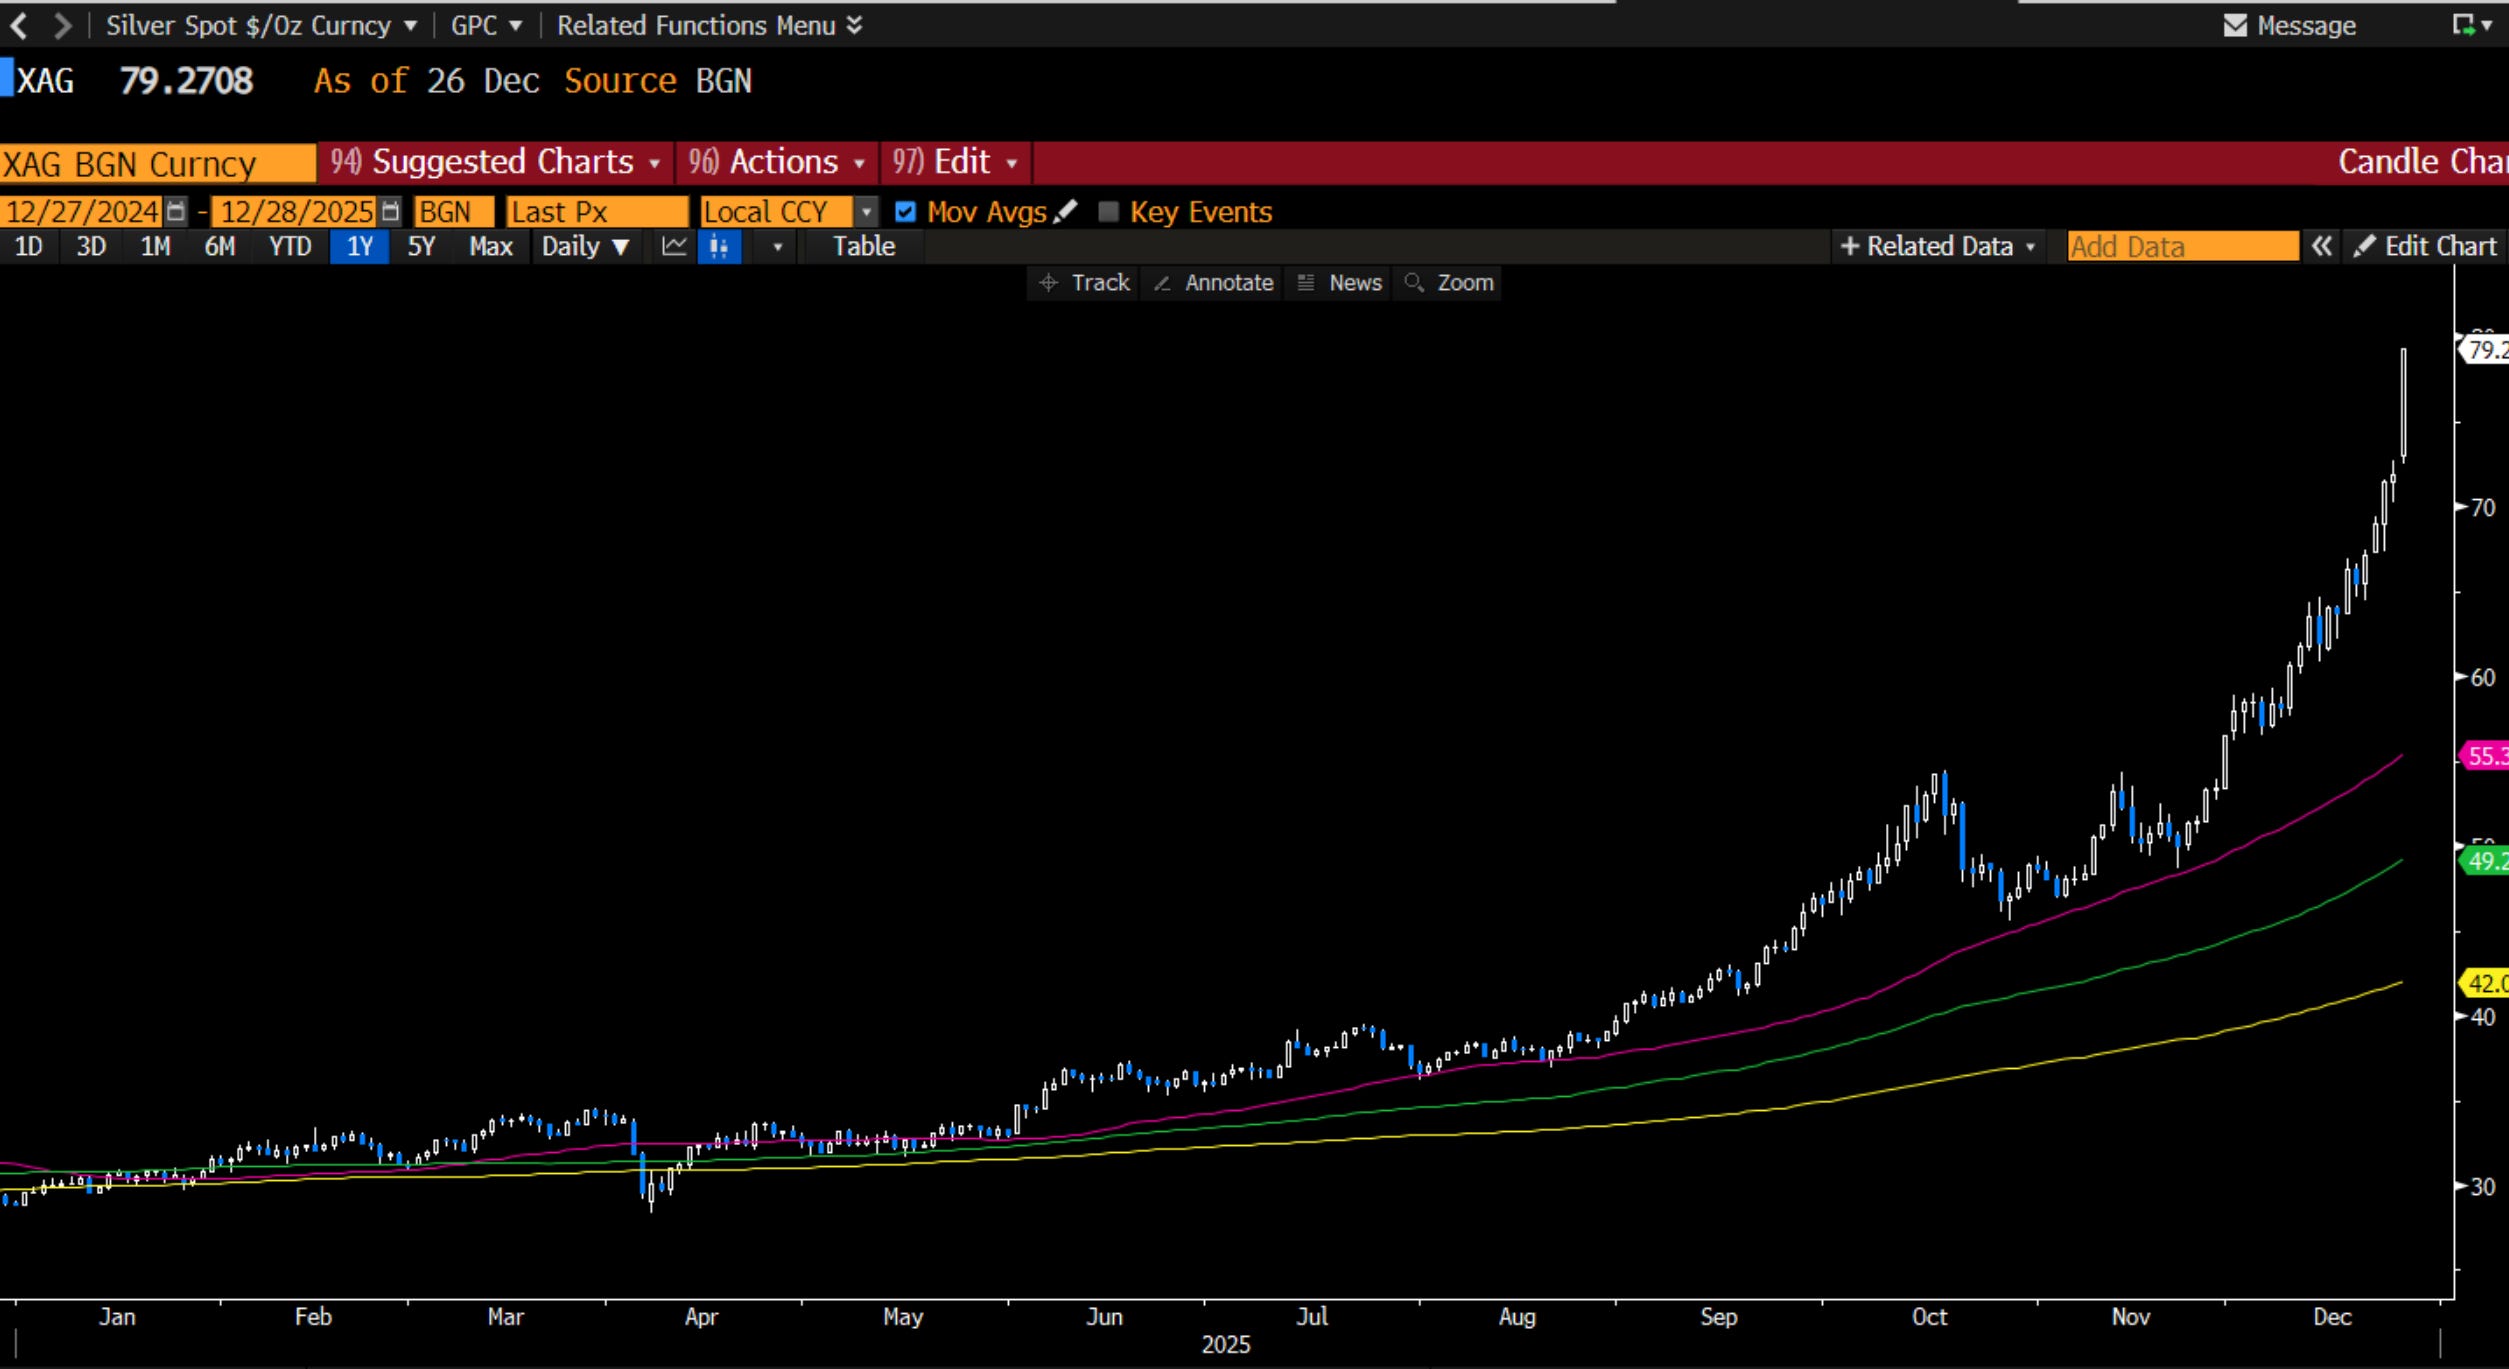
Silver just made all-time highs. You know what else makes all-time highs? Things that keep going up.
5. Copper Substitution
This is the one everyone throws at you. “They’ll just switch to copper.”
Fair. Let’s price it.
The Copper Thing (Or: Why Four Years Is a Long Time)
The copper substitution bear case is real.
It’s also slow.
Here’s the actual math, not the vibes:
Time Is The Binding Constraint
Even with unlimited capital, conversion has physical limits:
300 factories globally making solar cells
1.5 years to convert each one to copper plating
60 factories/year maximum parallel capacity
4 years minimum to reach 50% copper
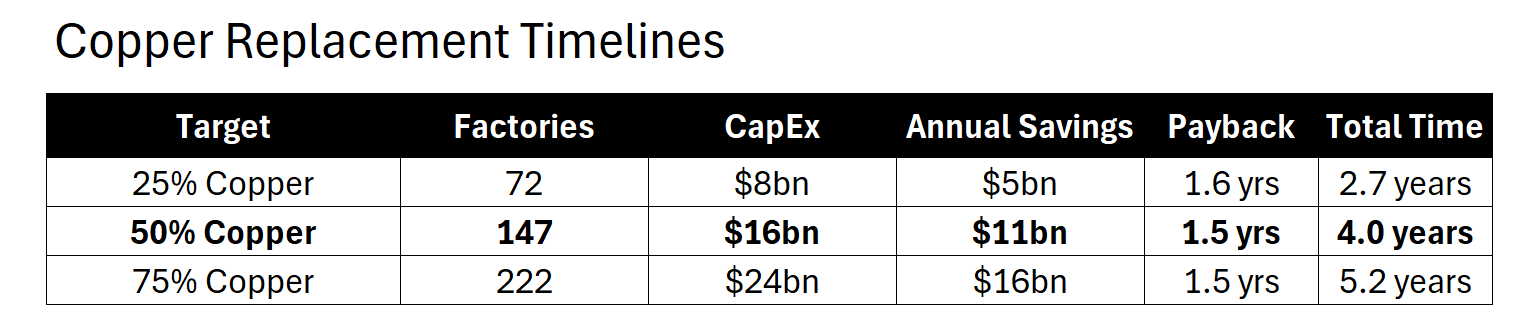
Look at those payback periods. 1.5 years. That’s a no-brainer capital allocation decision. CFOs should be tripping over themselves to sign off on this.
And yet: 4 years minimum to get halfway there.
You can’t throw money at physics. The factories have to be retooled one by one. The engineers have to be trained. The paste formulations have to be qualified. The supply chains have to be rebuilt. It takes time.
The Inelasticity Math
Solar manufacturers have already absorbed a 3x move in silver prices. Look at what that did to their profits:
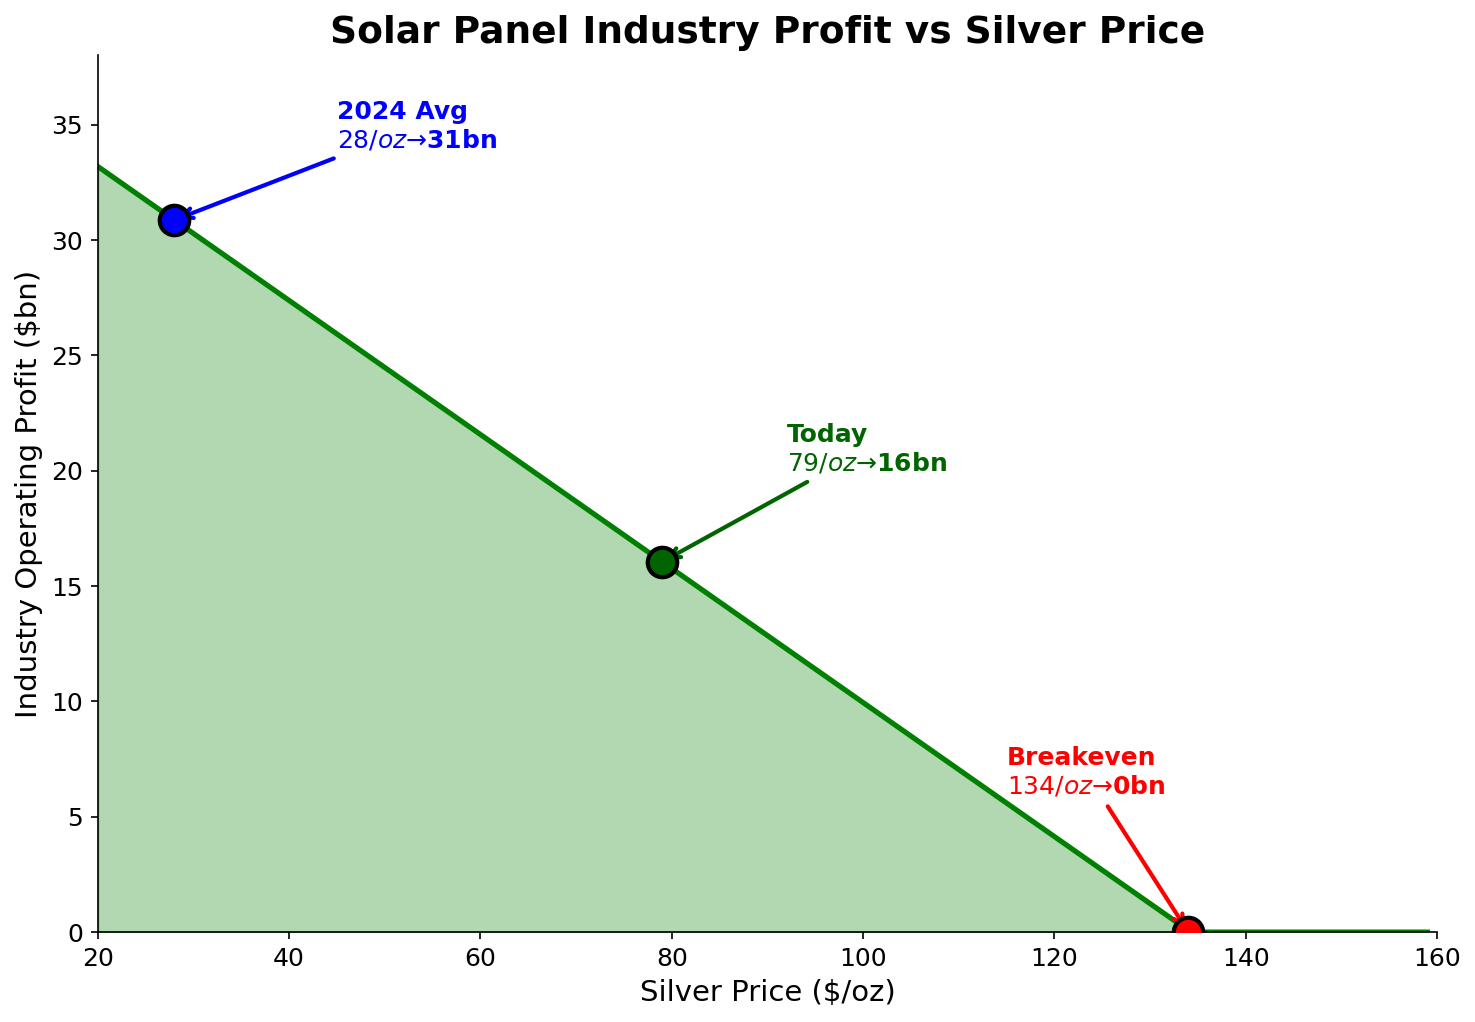
At $28/oz (2024 average), the industry made $31bn. At $79/oz today, they’re down to $16bn. Profits cut in half—and they kept buying.
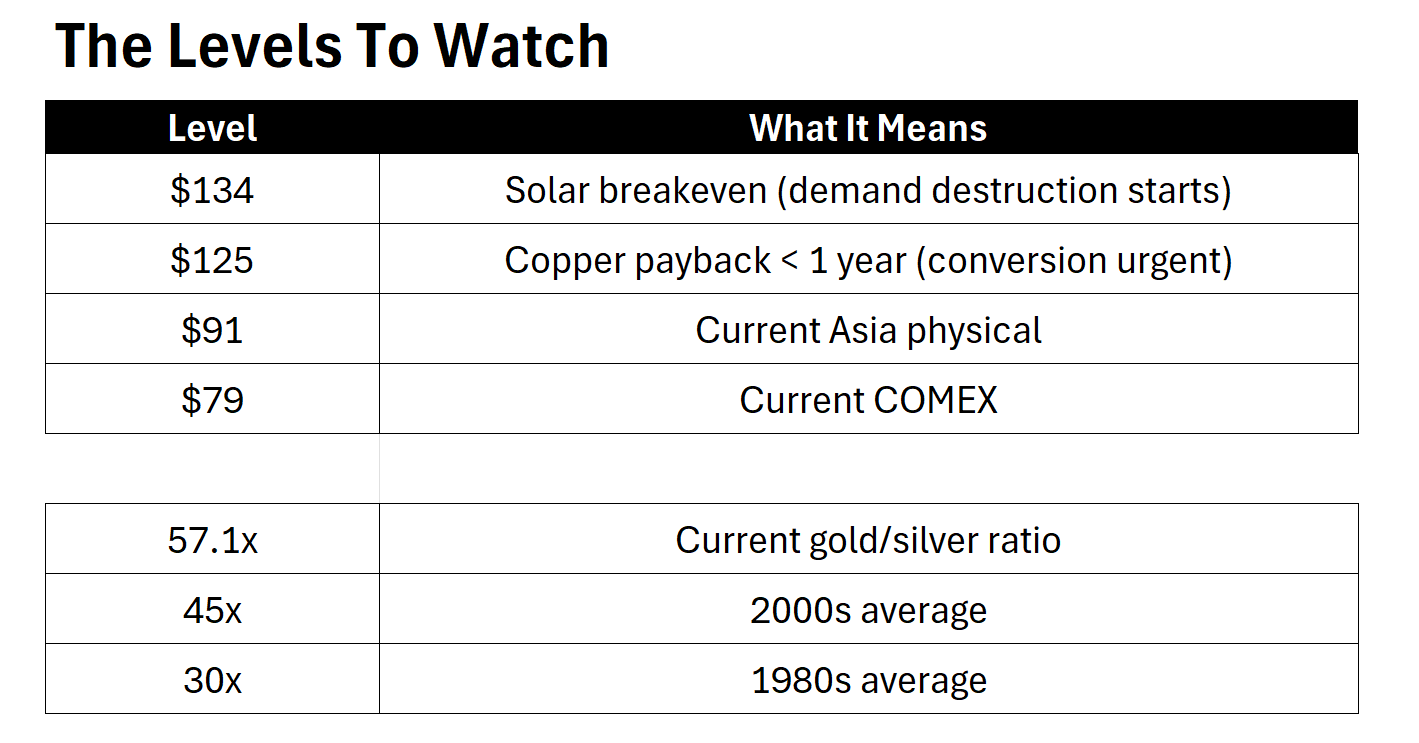
The breakeven? $134/oz. That’s 70% higher than spot.
$134 is not a price target. It’s the price where demand destruction even BEGINS.
The Urgency Threshold
At higher silver prices, the copper conversion economics get more compelling:
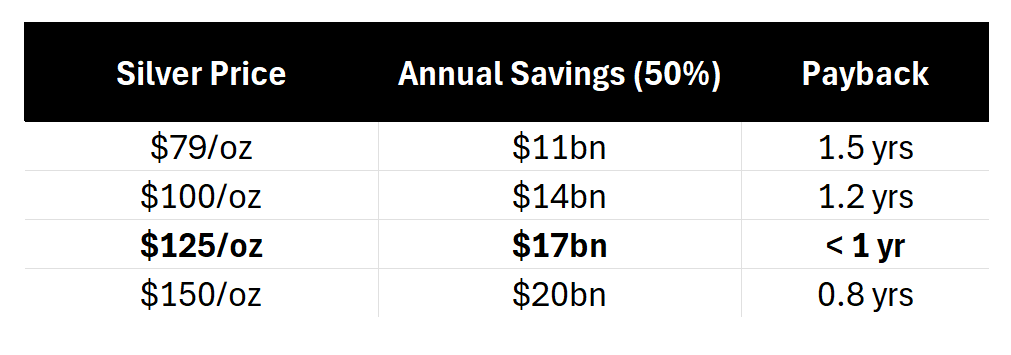
$125/oz is the inflection point—payback drops below one year and every board meeting becomes a copper conversion discussion. But even if they all decided tomorrow, you’re still 4 years from 50% copper. And $125 is still 50% higher than spot.
The money is screaming “do it.” The physics are saying “wait.”
The Intensity Paradox
Here’s the funny part. While everyone’s talking about copper substitution, the industry is actually moving to panels that use MORE silver:
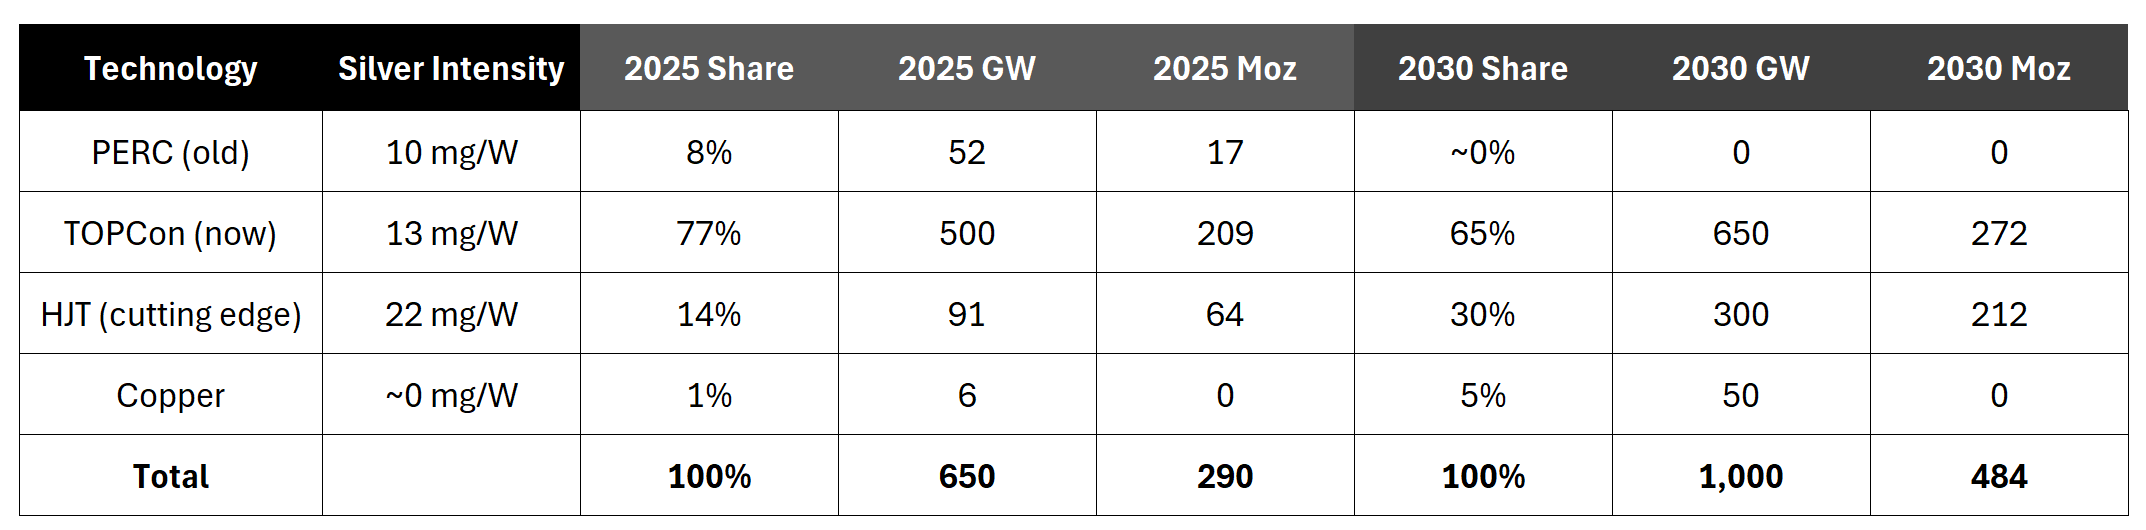
Weighted average intensity:
2025: ~13.5 mg/W
2030: ~15.2 mg/W
The mix shift from PERC → TOPCon → HJT increases silver intensity even as copper nibbles at the edges. Yes, intensity efficiency improves over time within each technology, but without a massive copper investment program, the industry is moving toward MORE silver per watt, not less.
The bears are talking about copper substitution. The industry is actually adopting HJT.
Bottom Line on Copper
The clock is ticking. But it’s ticking slowly.
Silver can move faster than factories can retool. The 4-year window is the thesis protection—70% upside before demand destruction, and substitution can’t catch up even if it started today.
The Bull Case (Or: Why This Could Rip Your Face Off in a Good Way)
Okay. Bear case addressed. Now let’s talk about why I’m still long.
1. China Just Weaponized Silver
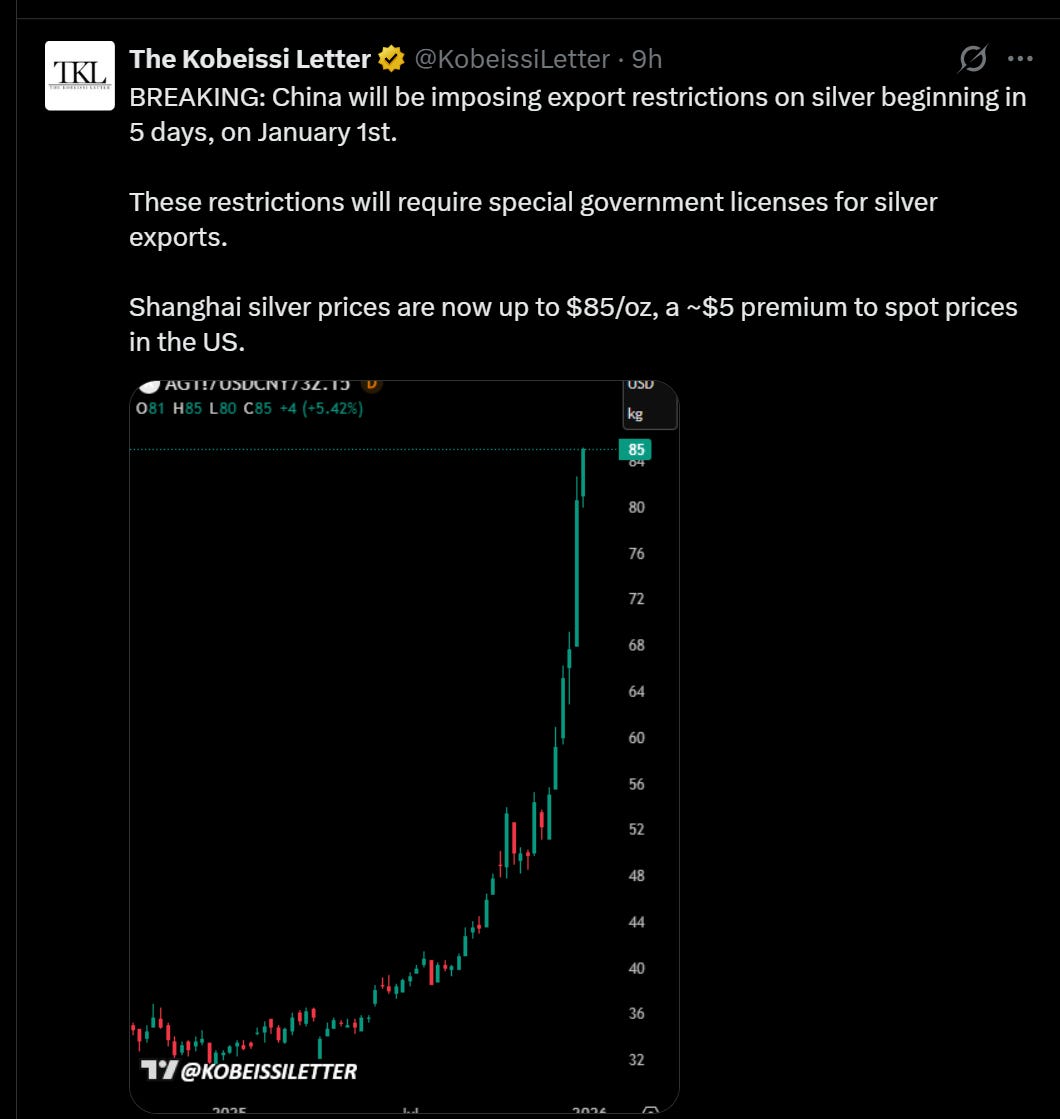
China is imposing export licensing on silver starting January 1st. Five days from now.
This matters because China is a massive NET EXPORTER of refined silver—about 121 million ounces annually, almost all flowing through Hong Kong to the world.
That flow now requires government permission.
Strategic. Resource. Play.
2. The Physical Premium is Obscene
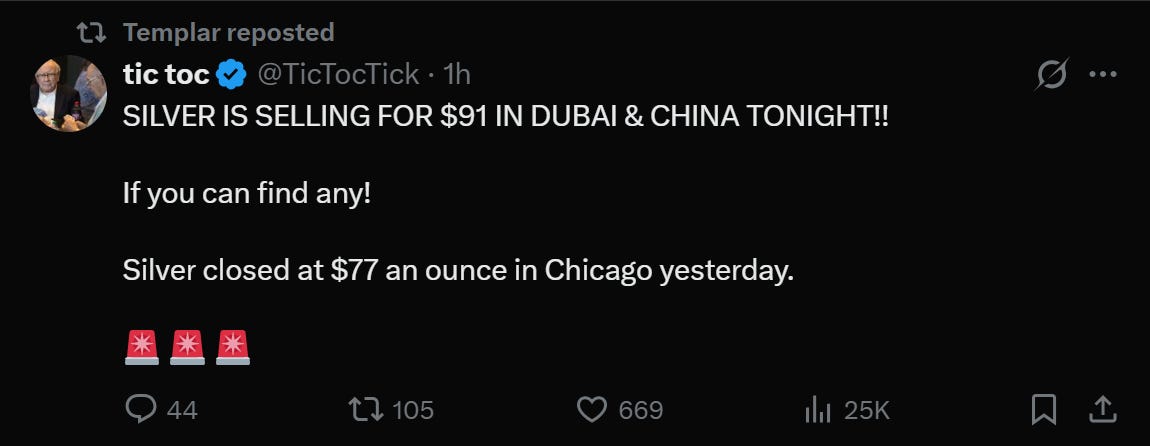
Shanghai: $85/oz Dubai: $91/oz COMEX: $77/oz
You live in a world of dollars. The marginal buyers don’t. They’re paying $10-14 premiums and they don’t care.
When physical diverges from paper like this, one of them is wrong. Historically, it’s not physical.
3. London is Screaming
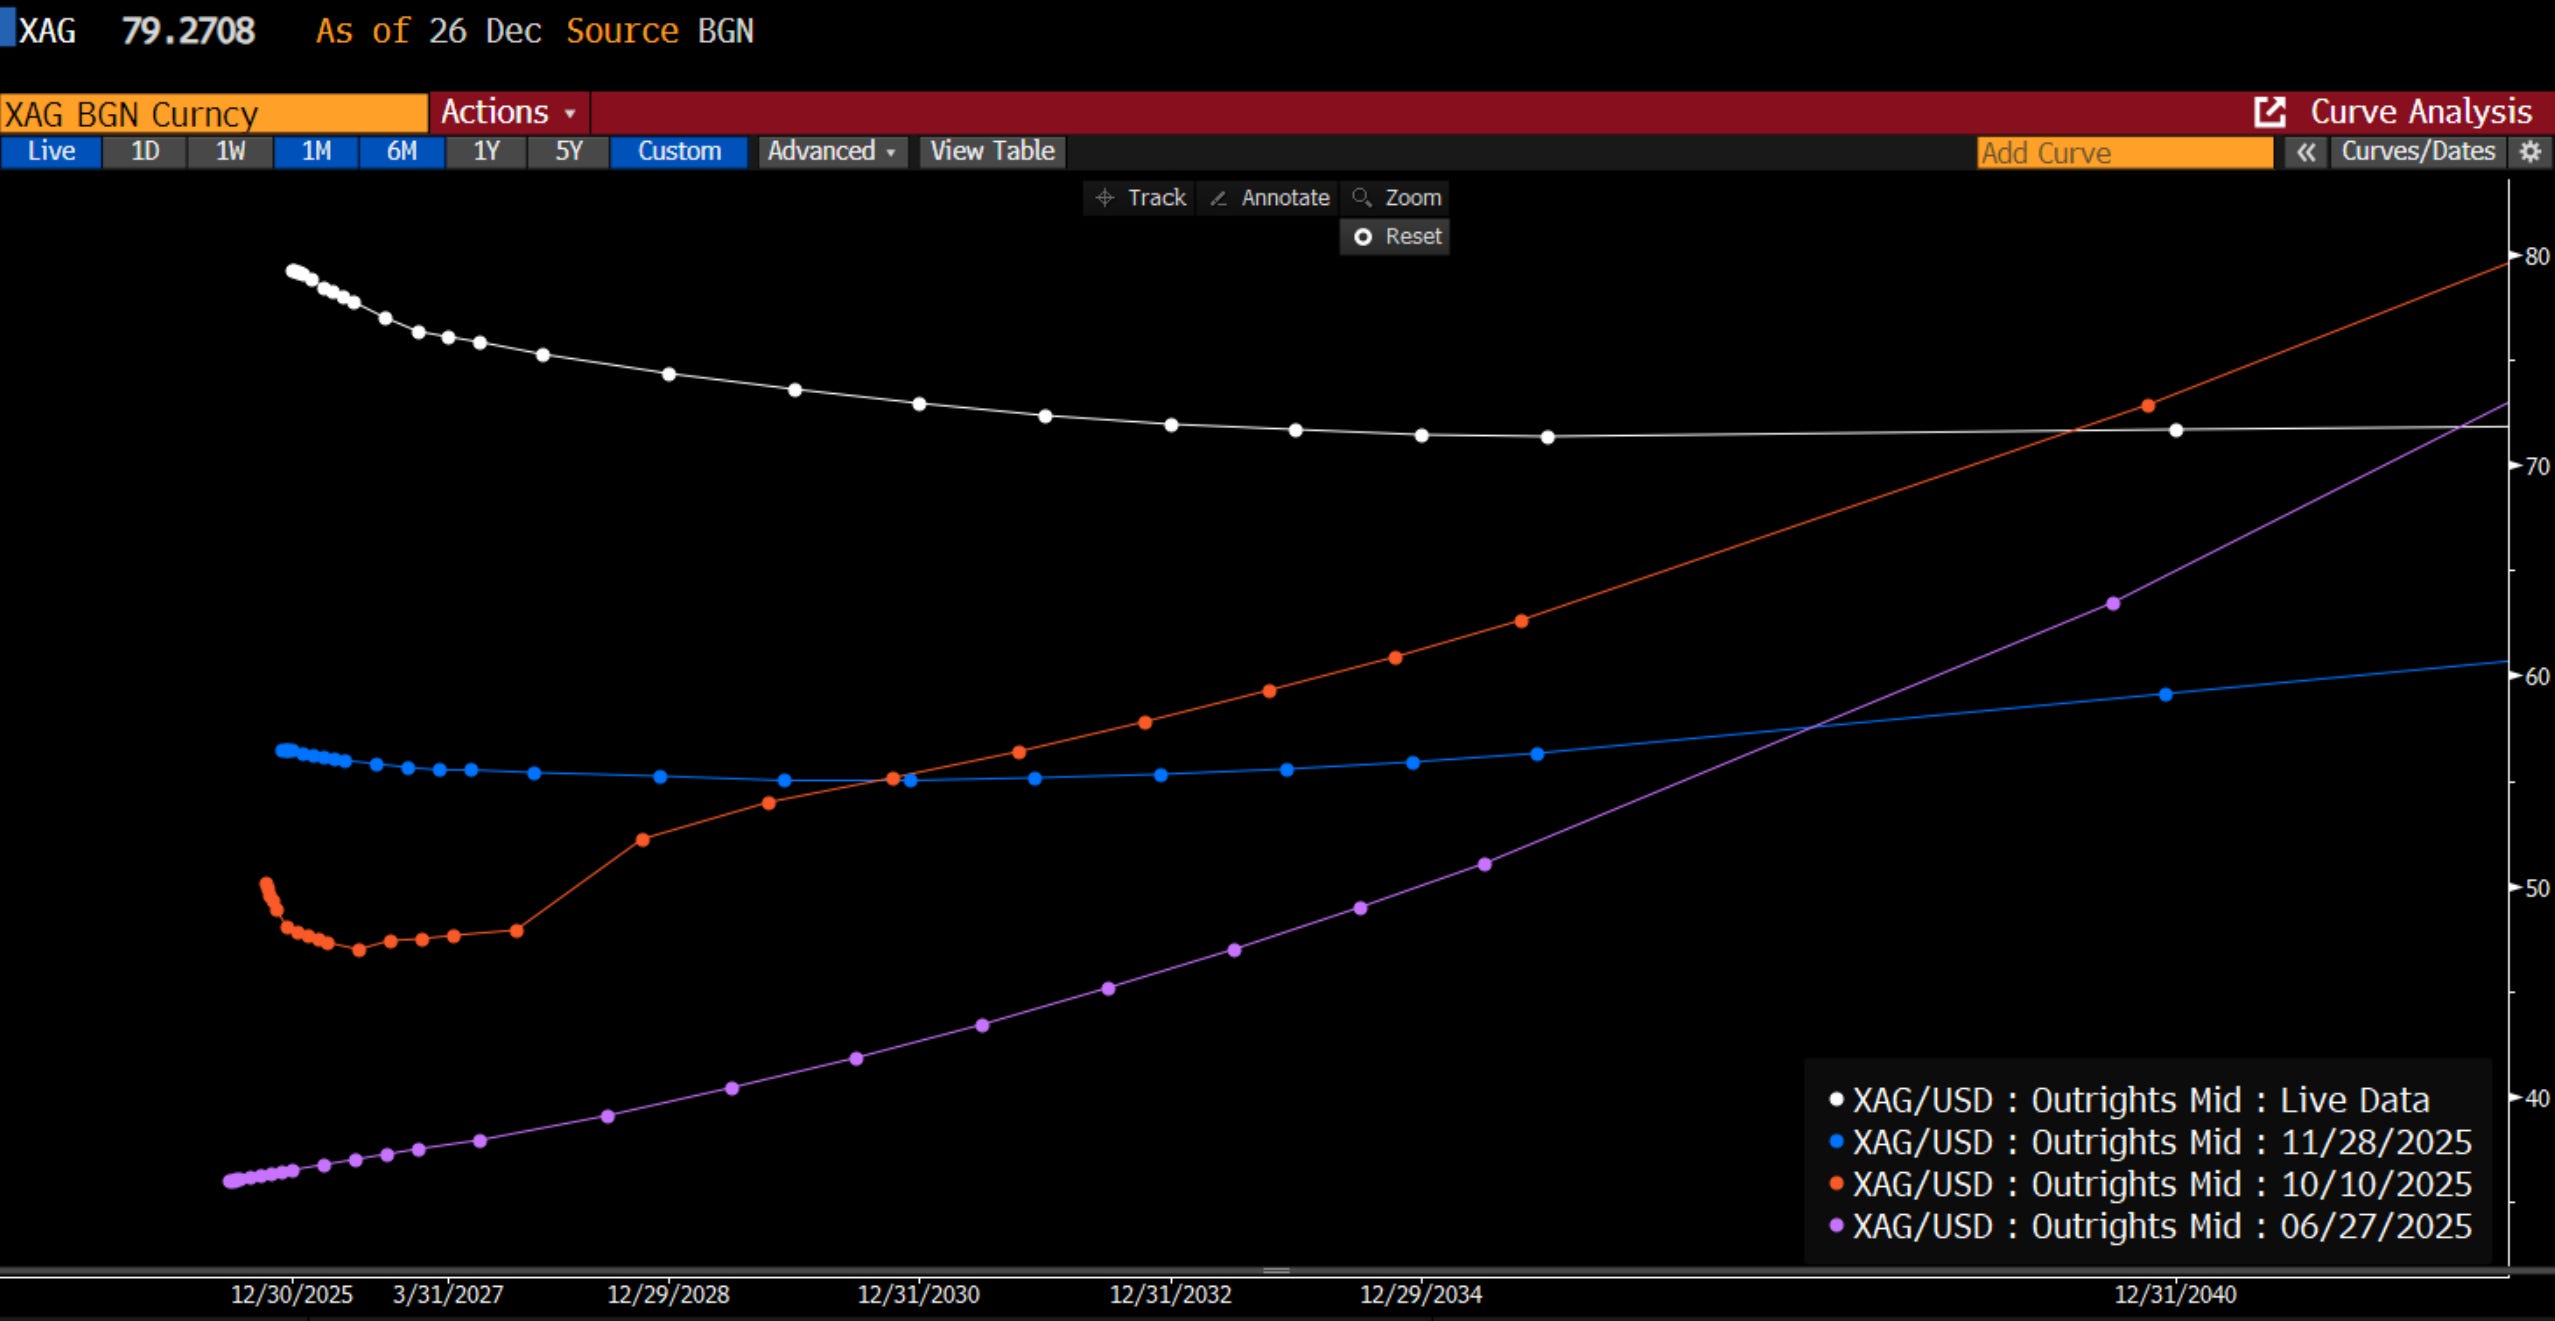
The London OTC market—where actual physical silver changes hands between bullion banks, refiners, and industrial users—is in the deepest backwardation in decades.
What’s backwardation? The market paying you MORE for metal today than for a promise of metal later. Spot > forwards. That’s not normal. That’s stress.
A year ago: $29 spot, curve rising to $42. Normal contango. Today: $80 spot, curve FALLING to $73. Inverted.
Meanwhile COMEX paper sits in lazy contango pretending everything’s fine.
Three markets, three stories:
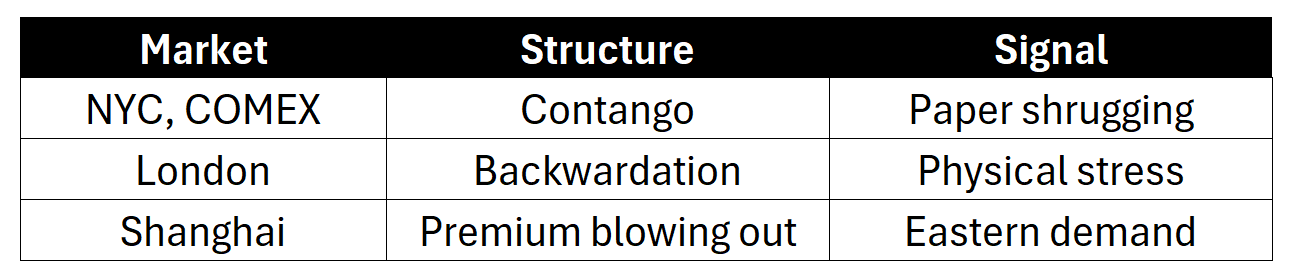
4. Vol Has Repriced
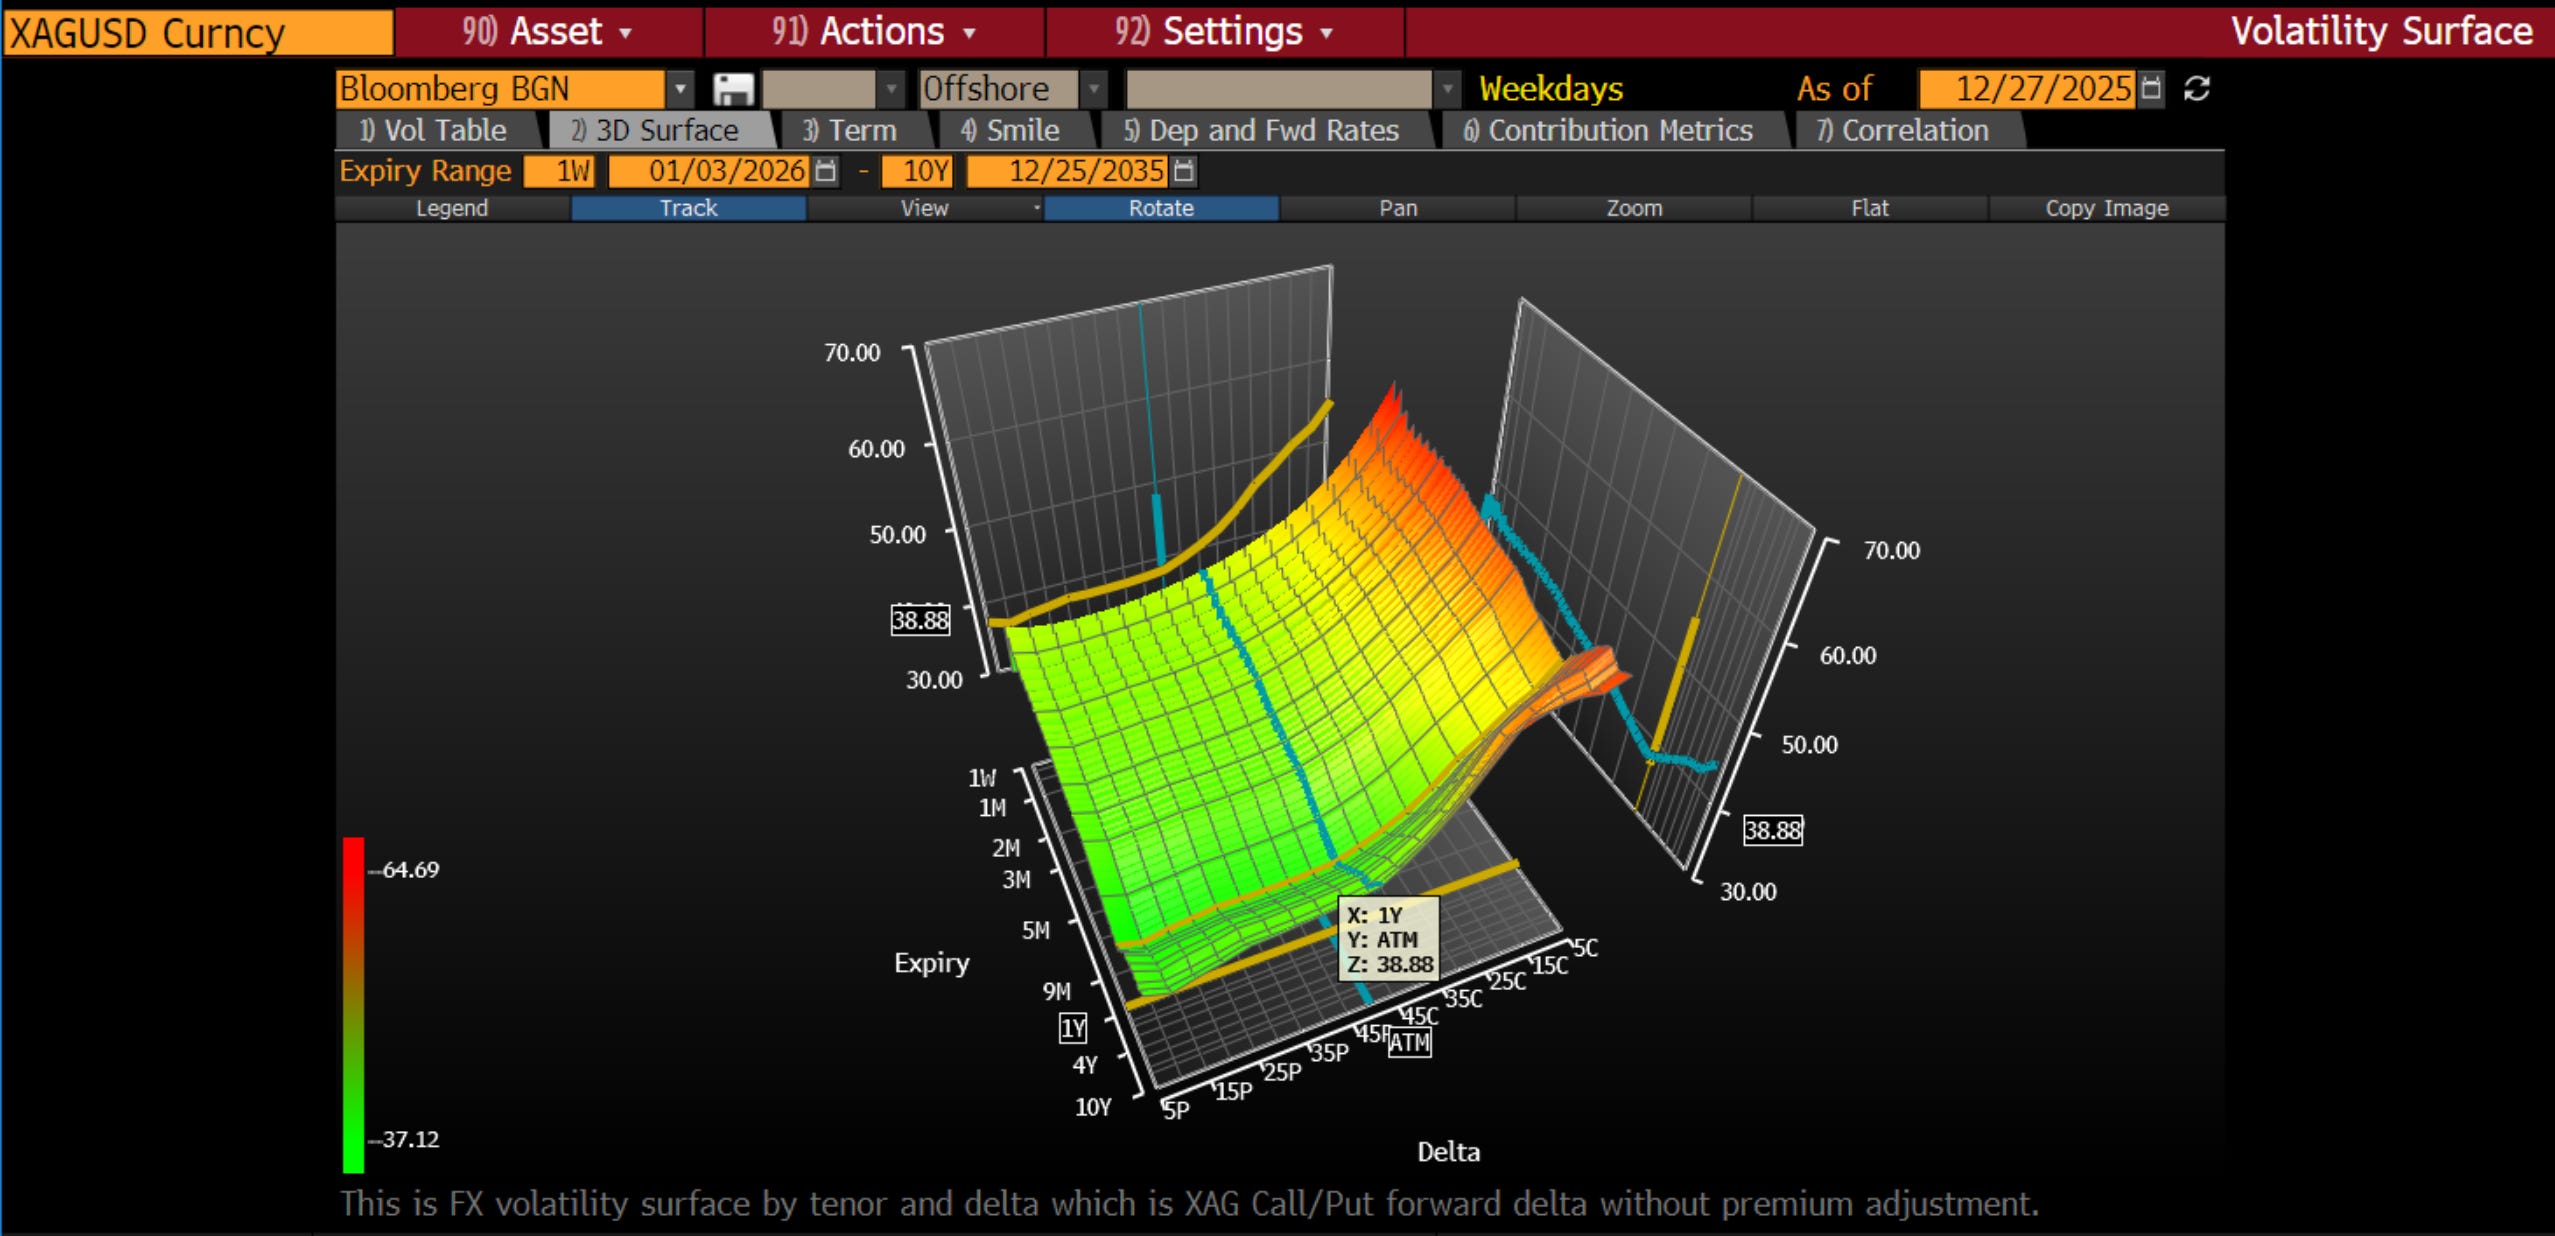
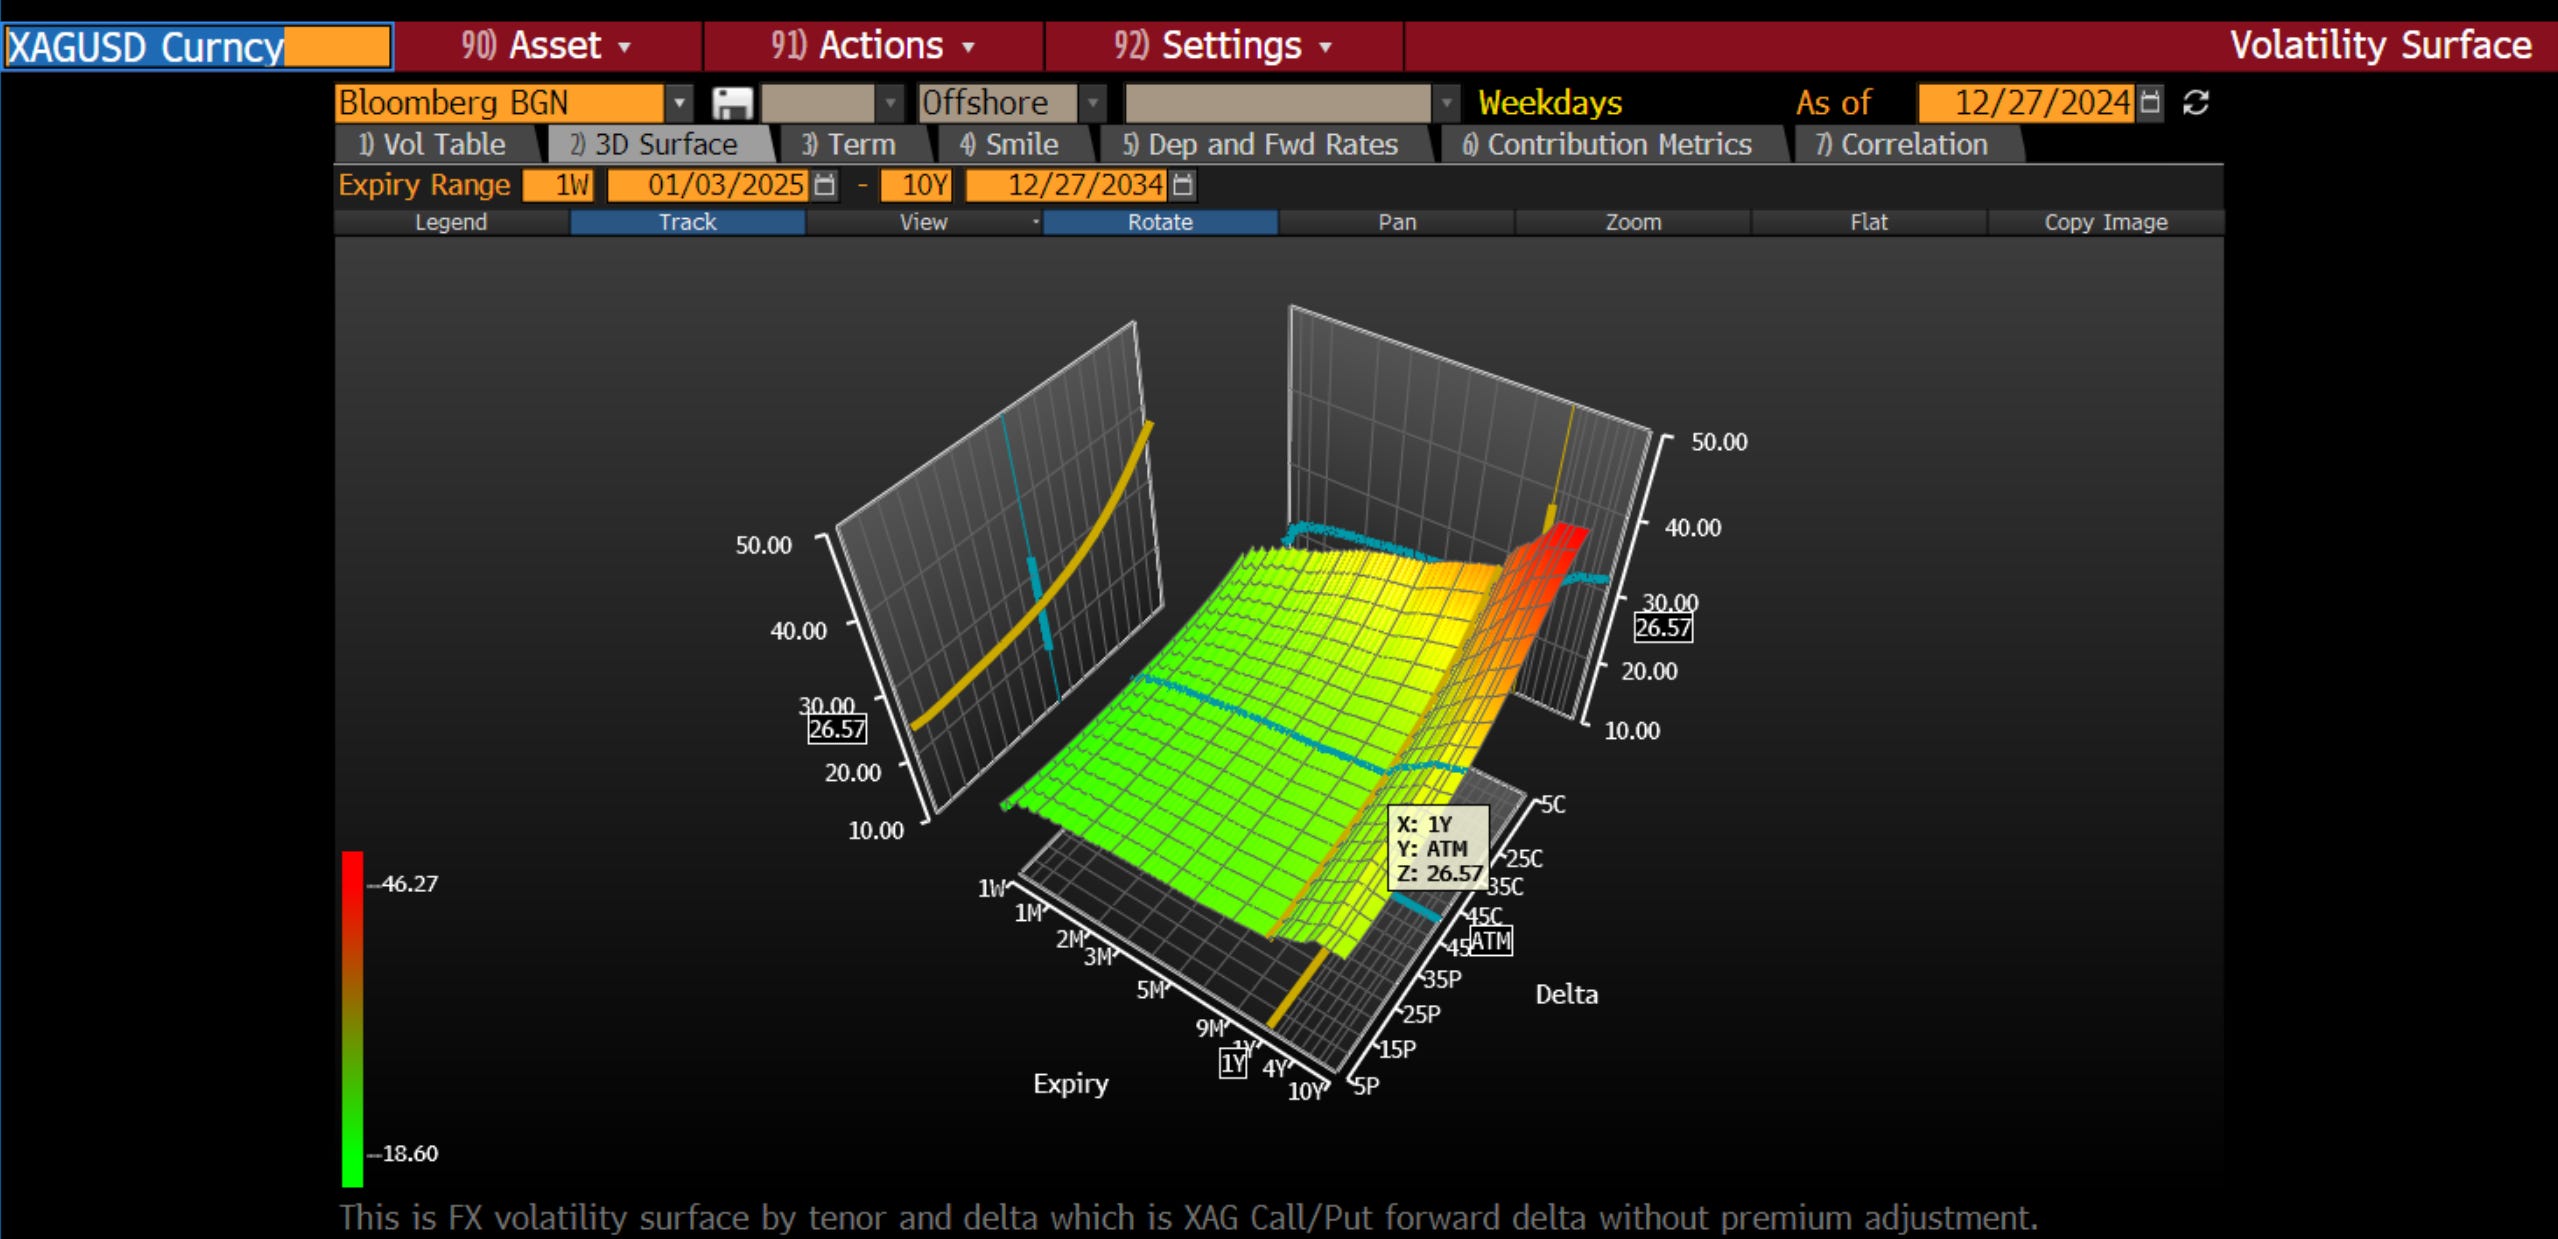
ATM vol went from 27% to 43% year-over-year. Upside calls even steeper—50-70% implied on OTM strikes.
The options market is pricing tail risk to the upside. We’ve climbed our way up this skew curve by continuously buying call spreads, buying at the money vol in exchange for selling upside. Recently going so far as to buy a 6m butterfly which buys 1 call on SLV at $70, sells 2 at $90, and buys back the tail at $110. Which kind of represents the view where in the short term we’d want to materially cut our delta.
5. Specs Aren’t Crowded
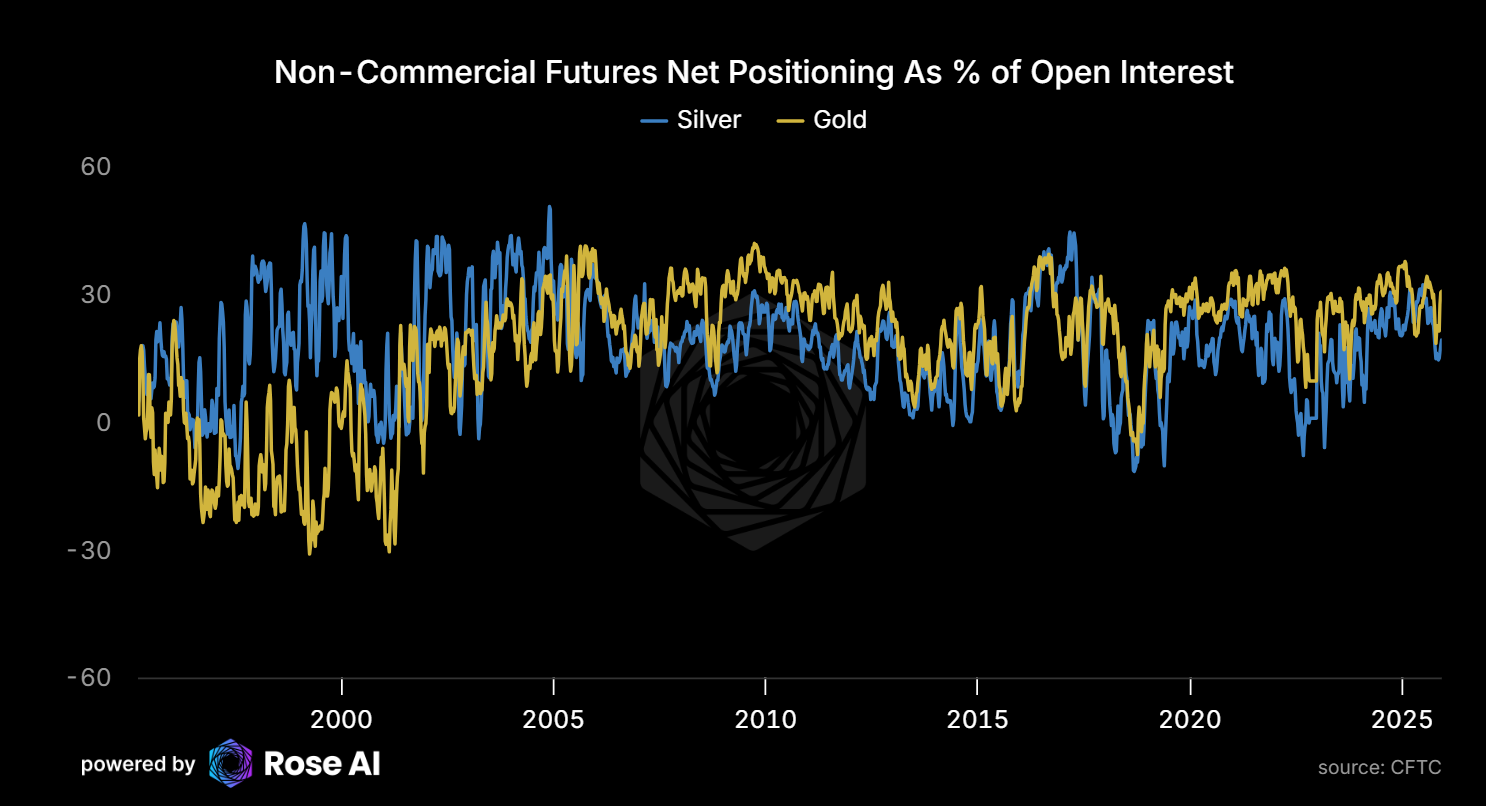
Gold specs: 31% of Open Interest Net Long, Silver specs: 19% with room to run.
Despite the move, silver positioning isn’t at extremes. There’s fuel left.
6. ETFs Are Still Catching Up
Investment demand has risen along with prices, confirming our prediction that silver would exhibit Veblen like characteristics.
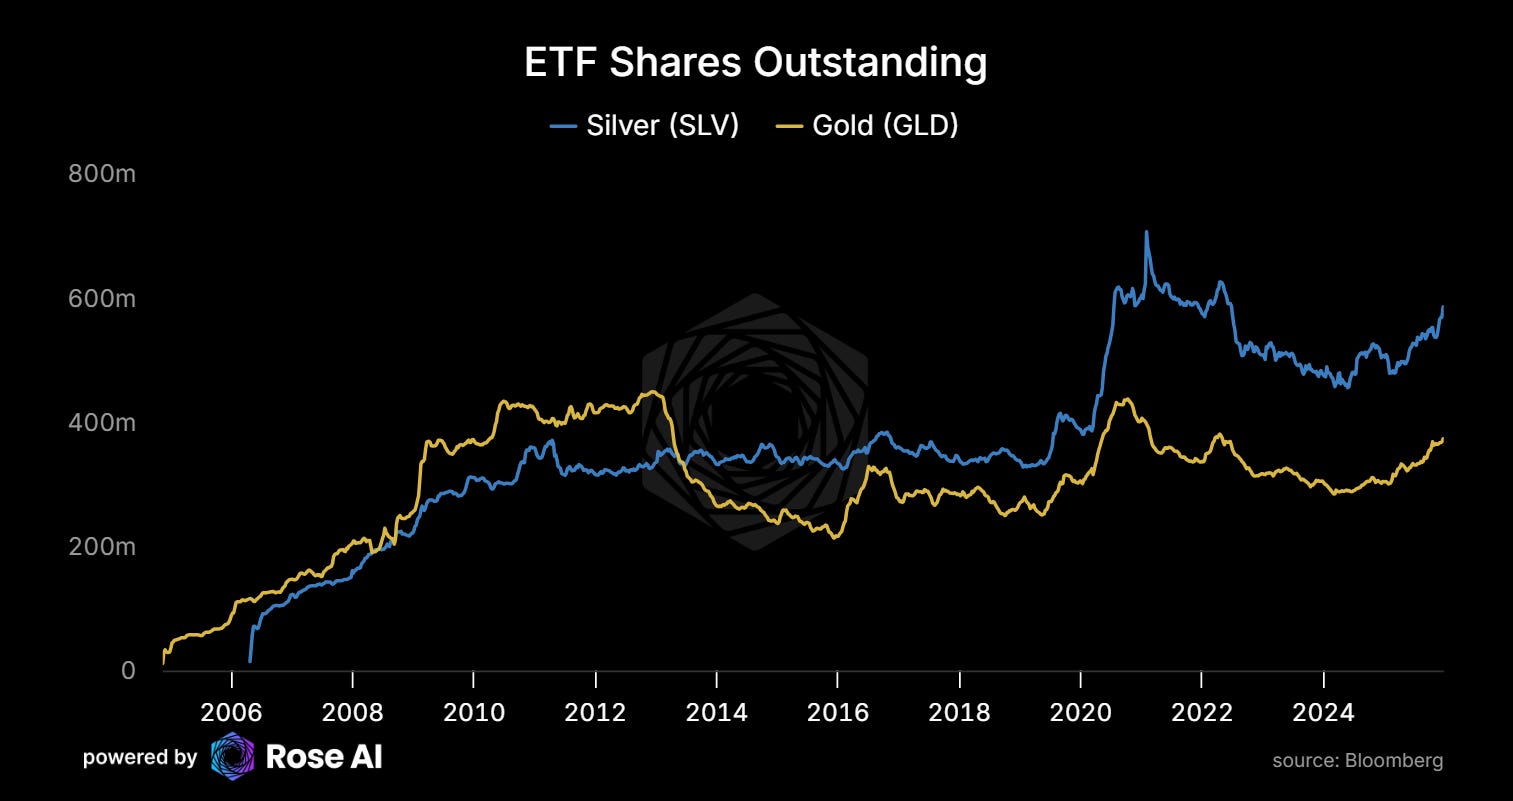
SLV shares outstanding are climbing again after years of outflows. Price goes up, demand goes up. That’s not normal commodity behavior—that’s monetary demand.
Meanwhile, the China premium persists:
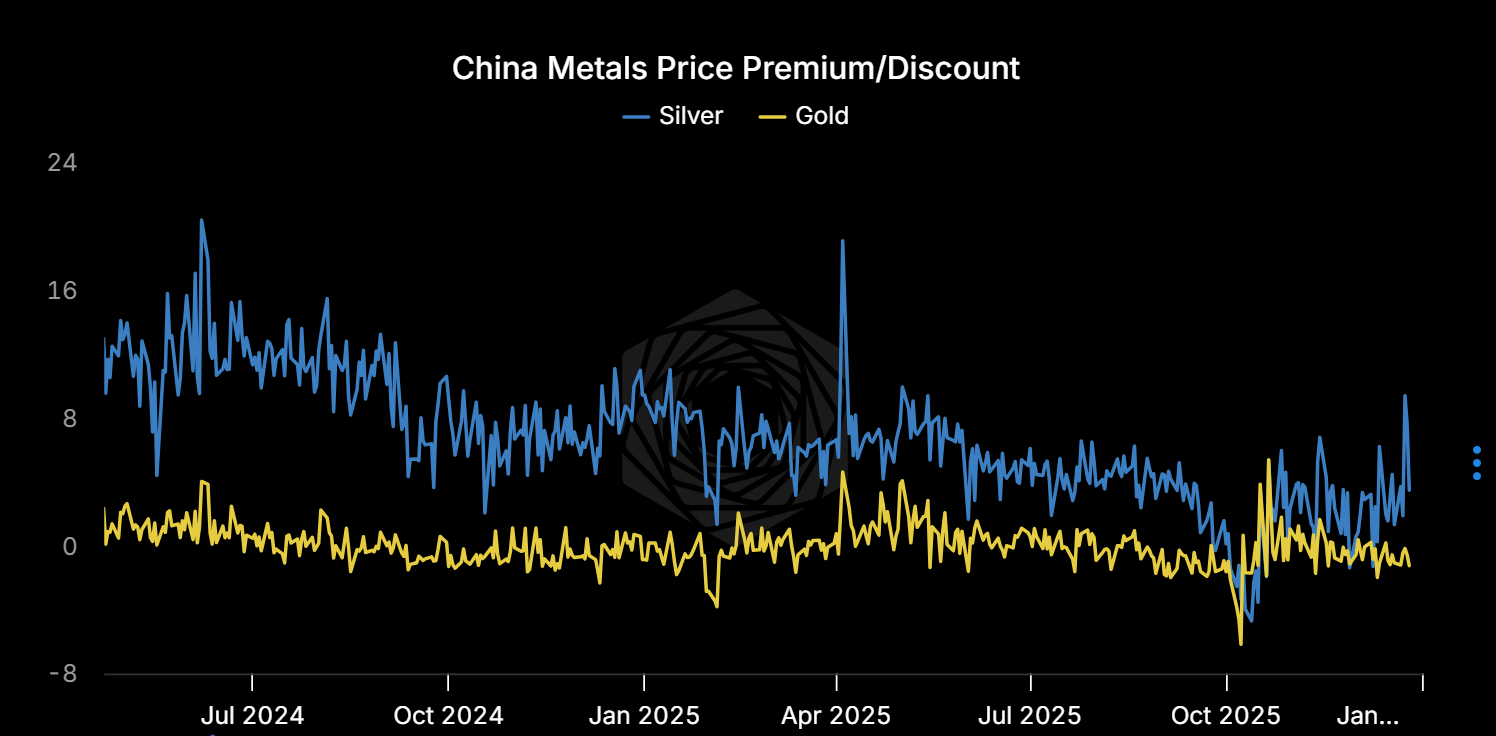
Western ETFs are finally buying. Eastern physical never stopped.
7. Solar Is Eating Everything
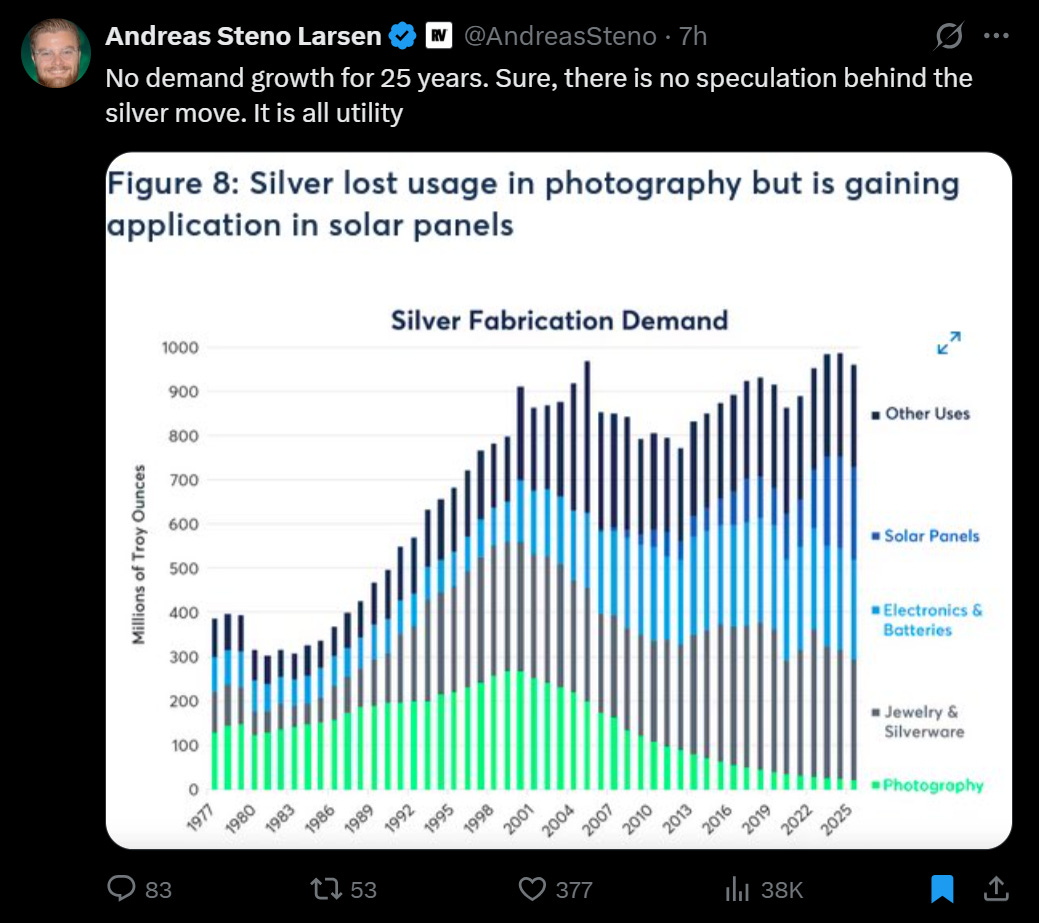
No demand growth for 25 years. No supply growth. Then solar happened.
Photography died. Solar replaced it and then some. 290 Moz today, 450+ Moz by 2030.
8. AI → Energy → Solar → Silver
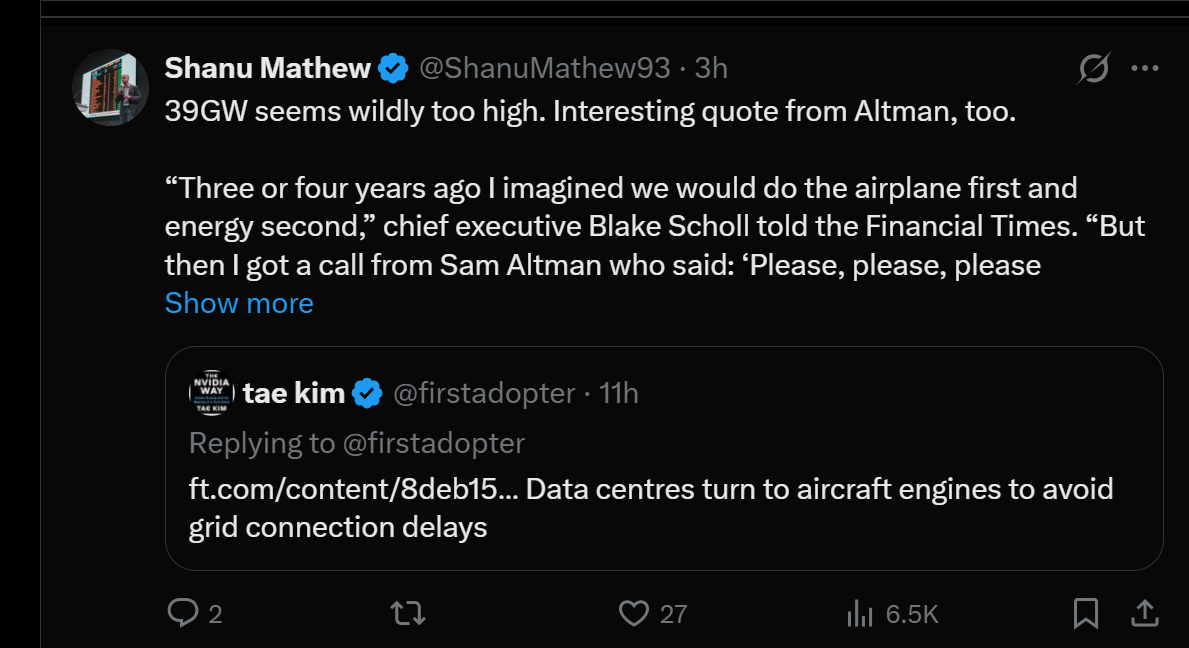
Sam Altman is calling random companies begging for electricity. Data centers are literally installing aircraft engines to avoid grid connection delays.
Every AI query needs electrons. The marginal electron is solar. Solar needs silver.
The chain is complete.
Levels To Watch
What I’m Watching
The risks: January tax selling. Dollar strength. Margin hikes (though the kill switch is exhausted).
The tells:
Backwardation deepening while price consolidates = accumulation
Backwardation resolving while price drops = squeeze unwinding
Shanghai premium persisting = structural, not noise
The framework:
Watch the curve, not the price.
If London physical stays stressed while COMEX paper yawns, the arb widens until something breaks. Either supply appears (price spikes to shake loose hoarded metal) or paper reprices to physical reality.
Bottom Line
The bear case is real in the short term. Tax selling, margins, dollar—these can hit you.
But the structure underneath:
London backwardation at multi-decade extremes
Asia paying $10-14 premiums
China export restrictions starting in 5 days
Solar demand inelastic to $134
Copper substitution takes 4 years minimum
72% of supply is byproduct (can’t just “mine more”)
Specs not crowded, ETFs accumulating metal, vol repriced
This is where it’s fun.
This is where it’s scary.
Position accordingly. Till next time.
DISCLAIMERS
I’m trying a thing where I write the entire blog in one setting over a handful of hours. So the numbers in this one are subject to revision.
Charts and graphs included in these materials are intended for educational purposes only and should not function as the sole basis for any investment decision. There will be typos. This is not my full-time job, and I do not promise the data included is accurate or up to date. Please consult me on anything contained herein before making an investment decision on the basis of this work.
These views are my own and do not represent any of Rose’s clients, partners, or investors.
THERE CAN BE NO ASSURANCE THAT ROSE TECHNOLOGY INVESTMENT OBJECTIVES WILL BE ACHIEVED OR THE INVESTMENT STRATEGIES WILL BE SUCCESSFUL. PAST RESULTS ARE NOT NECESSARILY INDICATIVE OF FUTURE RESULTS. AN INVESTMENT IN A FUND MANAGED BY ROSE INVOLVES A HIGH DEGREE OF RISK, INCLUDING THE RISK THAT THE ENTIRE AMOUNT INVESTED IS LOST.
"holding shares bought to delta hedge a long call. "
“Solar Panel Industry Profit….” Seems to imply silver is the key factor for industry profit, but are there not many other direct COGS and Rev/GM pressures behind that picture? Thanks for the perspective BTW, I’m now following but wanted to double click on this exhibit